Races in West Islip, New York (NY) Detailed Stats
Data:
Races - White alone (%)
Races - White alone (% change since 2000)
Races - Black alone (%)
Races - Black alone (% change since 2000)
Races - American Indian alone (%)
Races - American Indian alone (% change since 2000)
Races - Asian alone (%)
Races - Asian alone (% change since 2000)
Races - Hispanic (%)
Races - Hispanic (% change since 2000)
Races - Native Hawaiian and Other Pacific Islander alone (%)
Races - Native Hawaiian and Other Pacific Islander alone (% change since 2000)
Races - Two or more races(%)
Races - Two or more races(% change since 2000)
Races - Other race alone (%)
Races - Other race alone (% change since 2000)
Racial diversity
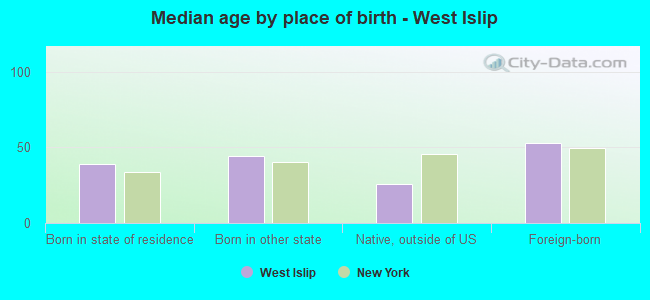
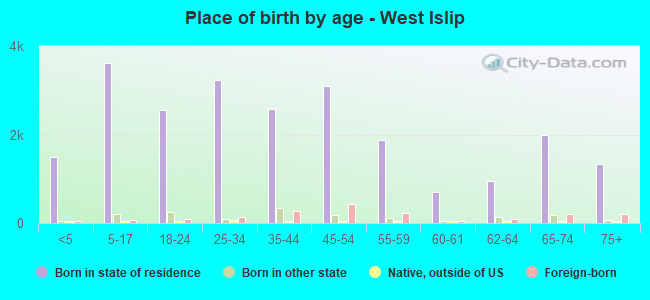
Place of birth - Born in state of residence (%)
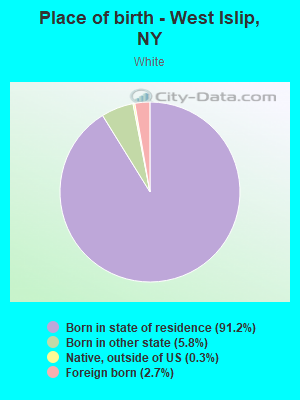
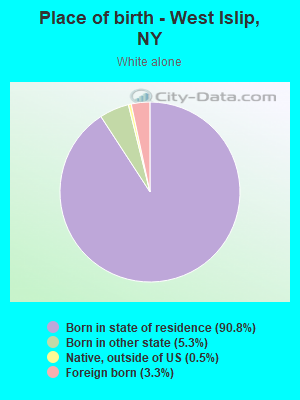
Place of birth - Born in state of residence (%) - White
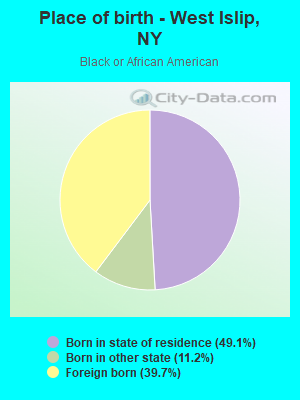
Place of birth - Born in state of residence (%) - Black or African American
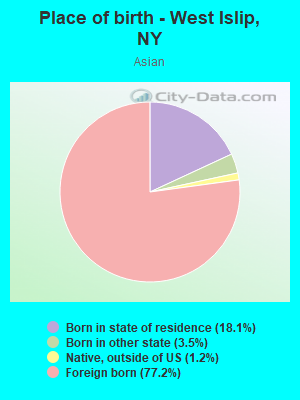
Place of birth - Born in state of residence (%) - Asian
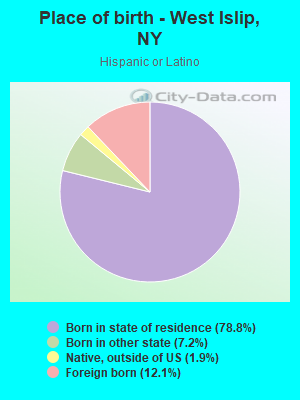
Place of birth - Born in state of residence (%) - Hispanic or Latino
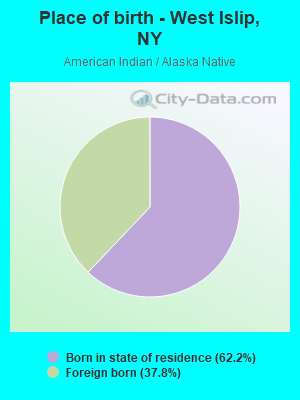
Place of birth - Born in state of residence (%) - American Indian and Alaska Native
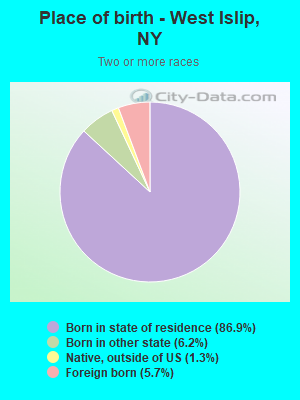
Place of birth - Born in state of residence (%) - Multirace
Place of birth - Born in state of residence (%) - Other Race
Place of birth - Born in other state (%)
Place of birth - Born in other state (%) - White
Place of birth - Born in other state (%) - Black or African American
Place of birth - Born in other state (%) - Asian
Place of birth - Born in other state (%) - Hispanic or Latino
Place of birth - Born in other state (%) - American Indian and Alaska Native
Place of birth - Born in other state (%) - Multirace
Place of birth - Born in other state (%) - Other Race
Place of birth - Native, outside of US (%)
Place of birth - Native, outside of US (%) - White
Place of birth - Native, outside of US (%) - Black or African American
Place of birth - Native, outside of US (%) - Asian
Place of birth - Native, outside of US (%) - Hispanic or Latino
Place of birth - Native, outside of US (%) - American Indian and Alaska Native
Place of birth - Native, outside of US (%) - Multirace
Place of birth - Native, outside of US (%) - Other Race
Place of birth - Foreign born (%)
Place of birth - Foreign born (%) - White
Place of birth - Foreign born (%) - Black or African American
Place of birth - Foreign born (%) - Asian
Place of birth - Foreign born (%) - Hispanic or Latino
Place of birth - Foreign born (%) - American Indian and Alaska Native
Place of birth - Foreign born (%) - Multirace
Place of birth - Foreign born (%) - Other Race
Residents speaking English at home (%)
Residents speaking English at home - Born in the United States (%)
Residents speaking English at home - Native, born elsewhere (%)
Residents speaking English at home - Foreign born (%)
Residents speaking Spanish at home (%)
Residents speaking Spanish at home - Born in the United States (%)
Residents speaking Spanish at home - Native, born elsewhere (%)
Residents speaking Spanish at home - Foreign born (%)
Residents speaking other language at home (%)
Residents speaking other language at home - Born in the United States (%)
Residents speaking other language at home - Native, born elsewhere (%)
Residents speaking other language at home - Foreign born (%)
Marital status - Never married (%)
Marital status - Now married (%)
Marital status - Separated (%)
Marital status - Widowed (%)
Marital status - Divorced (%)
Ancestries Reported - Arab (%)
Ancestries Reported - Czech (%)
Ancestries Reported - Danish (%)
Ancestries Reported - Dutch (%)
Ancestries Reported - English (%)
Ancestries Reported - French (%)
Ancestries Reported - French Canadian (%)
Ancestries Reported - German (%)
Ancestries Reported - Greek (%)
Ancestries Reported - Hungarian (%)
Ancestries Reported - Irish (%)
Ancestries Reported - Italian (%)
Ancestries Reported - Lithuanian (%)
Ancestries Reported - Norwegian (%)
Ancestries Reported - Polish (%)
Ancestries Reported - Portuguese (%)
Ancestries Reported - Russian (%)
Ancestries Reported - Scotch-Irish (%)
Ancestries Reported - Scottish (%)
Ancestries Reported - Slovak (%)
Ancestries Reported - Subsaharan African (%)
Ancestries Reported - Swedish (%)
Ancestries Reported - Swiss (%)
Ancestries Reported - Ukrainian (%)
Ancestries Reported - United States (%)
Ancestries Reported - Welsh (%)
Ancestries Reported - West Indian (%)
Ancestries Reported - Other (%)
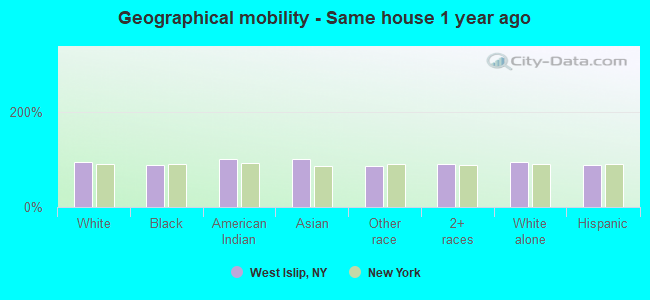
Geographical mobility - Same house 1 year ago (%)
Geographical mobility - Same house 1 year ago (%) - White
Geographical mobility - Same house 1 year ago (%) - Black or African American
Geographical mobility - Same house 1 year ago (%) - Asian
Geographical mobility - Same house 1 year ago (%) - Hispanic or Latino
Geographical mobility - Same house 1 year ago (%) - American Indian and Alaska Native
Geographical mobility - Same house 1 year ago (%) - Multirace
Geographical mobility - Same house 1 year ago (%) - Other Race
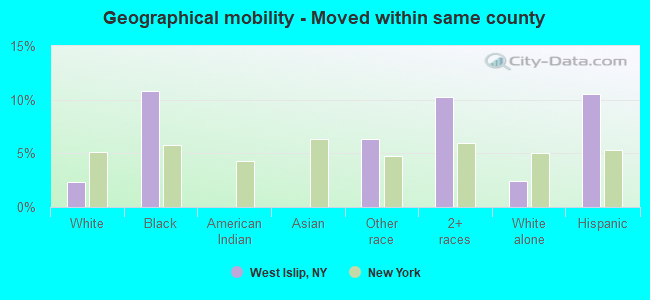
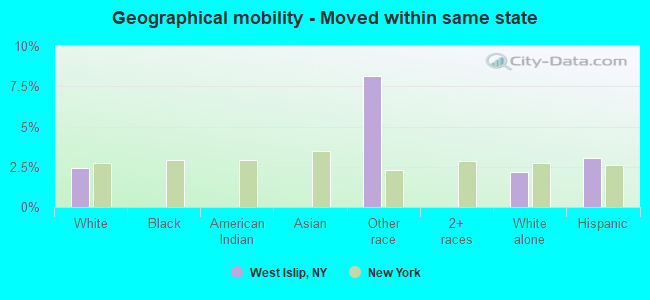
Geographical mobility - Moved within same county (%)
Geographical mobility - Moved within same county (%) - White
Geographical mobility - Moved within same county (%) - Black or African American
Geographical mobility - Moved within same county (%) - Asian
Geographical mobility - Moved within same county (%) - Hispanic or Latino
Geographical mobility - Moved within same county (%) - American Indian and Alaska Native
Geographical mobility - Moved within same county (%) - Multirace
Geographical mobility - Moved within same county (%) - Other Race
Geographical mobility - Moved from different county within same state (%)
Geographical mobility - Moved from different county within same state (%) - White
Geographical mobility - Moved from different county within same state (%) - Black or African American
Geographical mobility - Moved from different county within same state (%) - Asian
Geographical mobility - Moved from different county within same state (%) - Hispanic or Latino
Geographical mobility - Moved from different county within same state (%) - American Indian and Alaska Native
Geographical mobility - Moved from different county within same state (%) - Multirace
Geographical mobility - Moved from different county within same state (%) - Other Race
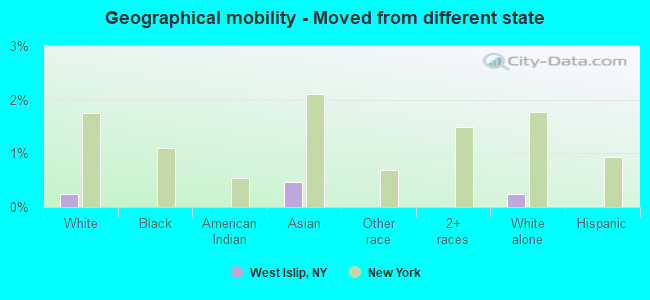
Geographical mobility - Moved from different state (%)
Geographical mobility - Moved from different state (%) - White
Geographical mobility - Moved from different state (%) - Black or African American
Geographical mobility - Moved from different state (%) - Asian
Geographical mobility - Moved from different state (%) - Hispanic or Latino
Geographical mobility - Moved from different state (%) - American Indian and Alaska Native
Geographical mobility - Moved from different state (%) - Multirace
Geographical mobility - Moved from different state (%) - Other Race
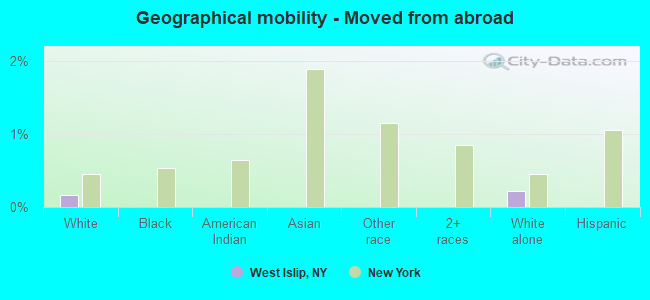
Geographical mobility - Moved from abroad (%)
Geographical mobility - Moved from abroad (%) - White
Geographical mobility - Moved from abroad (%) - Black or African American
Geographical mobility - Moved from abroad (%) - Asian
Geographical mobility - Moved from abroad (%) - Hispanic or Latino
Geographical mobility - Moved from abroad (%) - American Indian and Alaska Native
Geographical mobility - Moved from abroad (%) - Multirace
Geographical mobility - Moved from abroad (%) - Other Race
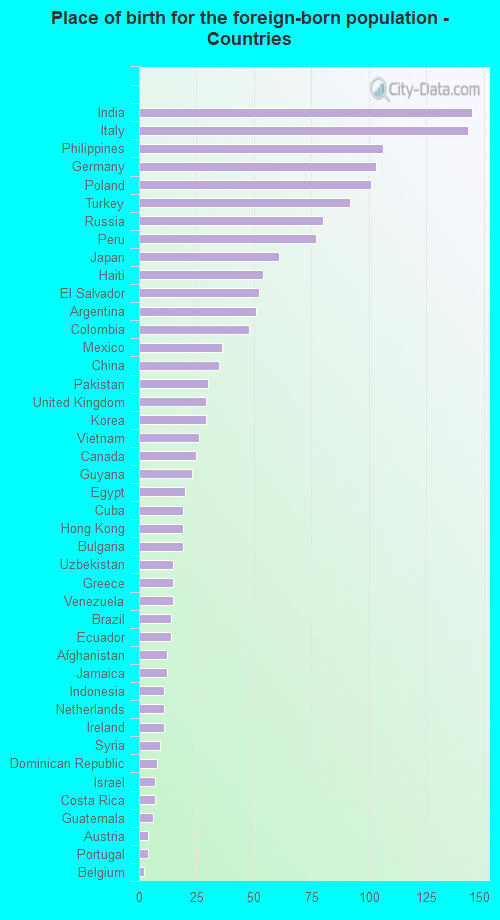
Place of birth for the foreign-born population - Ireland (%)
Place of birth for the foreign-born population - Denmark (%)
Place of birth for the foreign-born population - Norway (%)
Place of birth for the foreign-born population - Sweden (%)
Place of birth for the foreign-born population - United Kingdom (%)
Place of birth for the foreign-born population - England (%)
Place of birth for the foreign-born population - Scotland (%)
Place of birth for the foreign-born population - Other Northern Europe (%)
Place of birth for the foreign-born population - Austria (%)
Place of birth for the foreign-born population - Belgium (%)
Place of birth for the foreign-born population - France (%)
Place of birth for the foreign-born population - Germany (%)
Place of birth for the foreign-born population - Netherlands (%)
Place of birth for the foreign-born population - Switzerland (%)
Place of birth for the foreign-born population - Other Western Europe (%)
Place of birth for the foreign-born population - Greece (%)
Place of birth for the foreign-born population - Italy (%)
Place of birth for the foreign-born population - Portugal (%)
Place of birth for the foreign-born population - Spain (%)
Place of birth for the foreign-born population - Other Southern Europe (%)
Place of birth for the foreign-born population - Albania (%)
Place of birth for the foreign-born population - Belarus (%)
Place of birth for the foreign-born population - Bosnia and Herzegovina (%)
Place of birth for the foreign-born population - Bulgaria (%)
Place of birth for the foreign-born population - Croatia (%)
Place of birth for the foreign-born population - Czechoslovakia (%)
Place of birth for the foreign-born population - Hungary (%)
Place of birth for the foreign-born population - Latvia (%)
Place of birth for the foreign-born population - Lithuania (%)
Place of birth for the foreign-born population - North Macedonia (Macedonia) (%)
Place of birth for the foreign-born population - Moldova (%)
Place of birth for the foreign-born population - Poland (%)
Place of birth for the foreign-born population - Romania (%)
Place of birth for the foreign-born population - Russia (%)
Place of birth for the foreign-born population - Serbia (%)
Place of birth for the foreign-born population - Ukraine (%)
Place of birth for the foreign-born population - Other Eastern Europe (%)
Place of birth for the foreign-born population - China (%)
Place of birth for the foreign-born population - Hong Kong (%)
Place of birth for the foreign-born population - Taiwan (%)
Place of birth for the foreign-born population - Japan (%)
Place of birth for the foreign-born population - Korea (%)
Place of birth for the foreign-born population - Other Eastern Asia (%)
Place of birth for the foreign-born population - Afghanistan (%)
Place of birth for the foreign-born population - Bangladesh (%)
Place of birth for the foreign-born population - India (%)
Place of birth for the foreign-born population - Iran (%)
Place of birth for the foreign-born population - Kazakhstan (%)
Place of birth for the foreign-born population - Nepal (%)
Place of birth for the foreign-born population - Pakistan (%)
Place of birth for the foreign-born population - Sri Lanka (%)
Place of birth for the foreign-born population - Uzbekistan (%)
Place of birth for the foreign-born population - Other South Central Asia (%)
Place of birth for the foreign-born population - Burma (%)
Place of birth for the foreign-born population - Cambodia (%)
Place of birth for the foreign-born population - Indonesia (%)
Place of birth for the foreign-born population - Laos (%)
Place of birth for the foreign-born population - Malaysia (%)
Place of birth for the foreign-born population - Philippines (%)
Place of birth for the foreign-born population - Singapore (%)
Place of birth for the foreign-born population - Thailand (%)
Place of birth for the foreign-born population - Vietnam (%)
Place of birth for the foreign-born population - Other South Eastern Asia (%)
Place of birth for the foreign-born population - Armenia (%)
Place of birth for the foreign-born population - Iraq (%)
Place of birth for the foreign-born population - Israel (%)
Place of birth for the foreign-born population - Jordan (%)
Place of birth for the foreign-born population - Kuwait (%)
Place of birth for the foreign-born population - Lebanon (%)
Place of birth for the foreign-born population - Saudi Arabia (%)
Place of birth for the foreign-born population - Syria (%)
Place of birth for the foreign-born population - Turkey (%)
Place of birth for the foreign-born population - Yemen (%)
Place of birth for the foreign-born population - Other Western Asia (%)
Place of birth for the foreign-born population - Eritrea (%)
Place of birth for the foreign-born population - Ethiopia (%)
Place of birth for the foreign-born population - Kenya (%)
Place of birth for the foreign-born population - Somalia (%)
Place of birth for the foreign-born population - Uganda (%)
Place of birth for the foreign-born population - Zimbabwe (%)
Place of birth for the foreign-born population - Other Eastern Africa (%)
Place of birth for the foreign-born population - Cameroon (%)
Place of birth for the foreign-born population - Congo (%)
Place of birth for the foreign-born population - Democratic Republic of Congo (Zaire) (%)
Place of birth for the foreign-born population - Other Middle Africa (%)
Place of birth for the foreign-born population - Egypt (%)
Place of birth for the foreign-born population - Morocco (%)
Place of birth for the foreign-born population - Sudan (%)
Place of birth for the foreign-born population - Other Northern Africa (%)
Place of birth for the foreign-born population - South Africa (%)
Place of birth for the foreign-born population - Other Southern Africa (%)
Place of birth for the foreign-born population - Cabo Verde (%)
Place of birth for the foreign-born population - Ghana (%)
Place of birth for the foreign-born population - Liberia (%)
Place of birth for the foreign-born population - Nigeria (%)
Place of birth for the foreign-born population - Senegal (%)
Place of birth for the foreign-born population - Sierra Leone (%)
Place of birth for the foreign-born population - Other Western Africa (%)
Place of birth for the foreign-born population - Australia (%)
Place of birth for the foreign-born population - New Zealand (%)
Place of birth for the foreign-born population - Fiji (%)
Place of birth for the foreign-born population - Micronesia (%)
Place of birth for the foreign-born population - Bahamas (%)
Place of birth for the foreign-born population - Barbados (%)
Place of birth for the foreign-born population - Cuba (%)
Place of birth for the foreign-born population - Dominica (%)
Place of birth for the foreign-born population - Dominican Republic (%)
Place of birth for the foreign-born population - Grenada (%)
Place of birth for the foreign-born population - Haiti (%)
Place of birth for the foreign-born population - Jamaica (%)
Place of birth for the foreign-born population - St. Vincent and the Grenadines (%)
Place of birth for the foreign-born population - Trinidad and Tobago (%)
Place of birth for the foreign-born population - West Indies (%)
Place of birth for the foreign-born population - Other Caribbean (%)
Place of birth for the foreign-born population - Belize (%)
Place of birth for the foreign-born population - Costa Rica (%)
Place of birth for the foreign-born population - El Salvador (%)
Place of birth for the foreign-born population - Guatemala (%)
Place of birth for the foreign-born population - Honduras (%)
Place of birth for the foreign-born population - Mexico (%)
Place of birth for the foreign-born population - Nicaragua (%)
Place of birth for the foreign-born population - Panama (%)
Place of birth for the foreign-born population - Other Central America (%)
Place of birth for the foreign-born population - Argentina (%)
Place of birth for the foreign-born population - Bolivia (%)
Place of birth for the foreign-born population - Brazil (%)
Place of birth for the foreign-born population - Chile (%)
Place of birth for the foreign-born population - Colombia (%)
Place of birth for the foreign-born population - Ecuador (%)
Place of birth for the foreign-born population - Guyana (%)
Place of birth for the foreign-born population - Peru (%)
Place of birth for the foreign-born population - Uruguay (%)
Place of birth for the foreign-born population - Venezuela (%)
Place of birth for the foreign-born population - Other South America (%)
Place of birth for the foreign-born population - Canada (%)
Place of birth for the foreign-born population - Other Northern America (%)
Place of birth for the foreign-born population - Other (%)
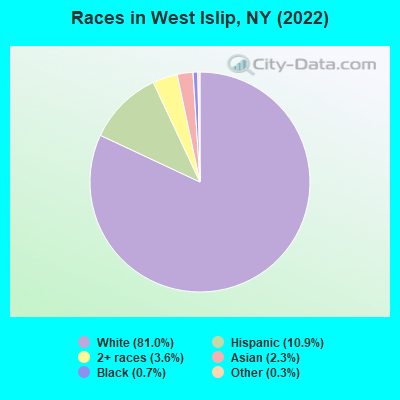
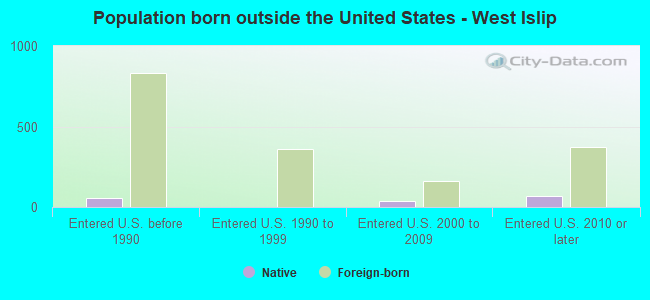
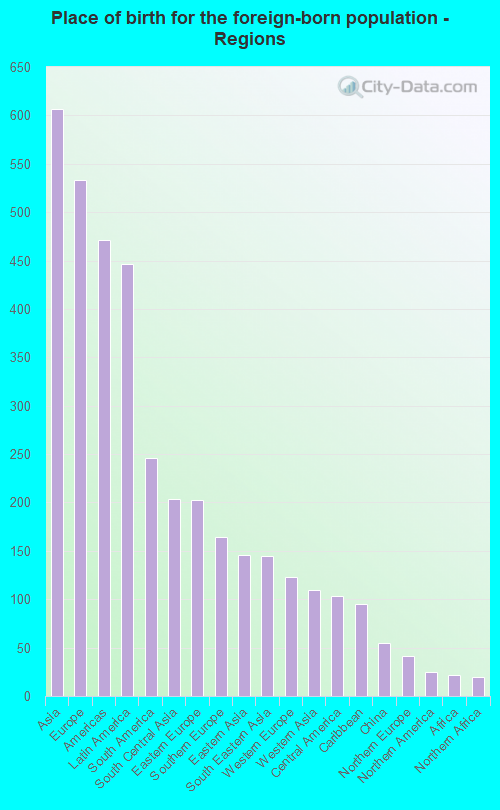
According to 2022 data, the most numerous races in West Islip, NY are White alone (22,027 residents), Hispanic (2,955 residents), and Black alone (187 residents). 88.1% of West Islip residents speak English at home. 6.0% of West Islip, NY residents are foreign-born (2.3% born in Asia, 2.0% born in Europe, 1.7% born in Latin America), which is 266.3% less than the foreign-born rate of 22.0% across the entire state of New York.
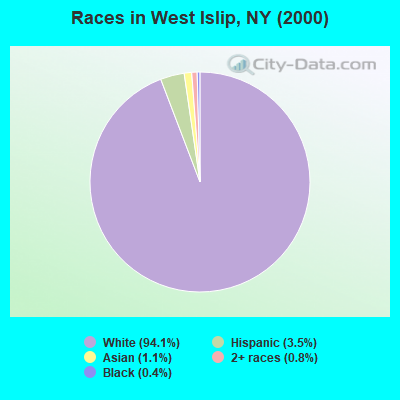
Race distribution in West Islip
2000 2022
11,760,981 62.0% White alone 2,867,583 15.1% Hispanic 2,812,623 14.8% Black alone 1,035,926 5.5% Asian alone 366,116 1.9% Two or more races 75,499 0.4% Other race alone 52,499 0.3% American Indian alone 5,230 0.03% Native Hawaiian and Other
10,408,933 52.9% White alone 3,867,299 19.7% Hispanic 2,633,840 13.4% Black alone 1,776,286 9.0% Asian alone 732,670 3.7% Two or more races 216,110 1.1% Other race alone 35,082 0.2% American Indian alone 6,931 0.04% Native Hawaiian and Other
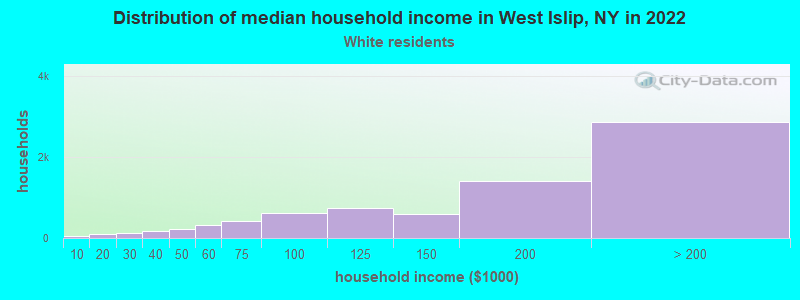
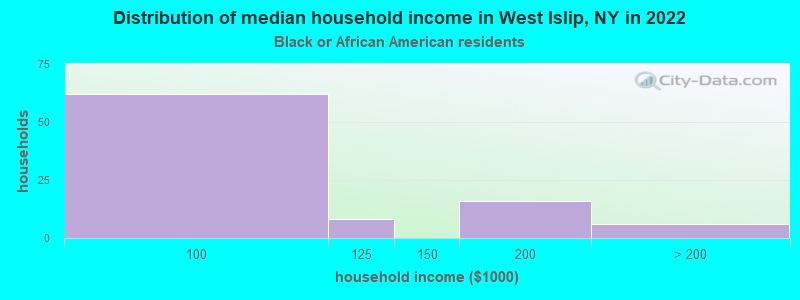
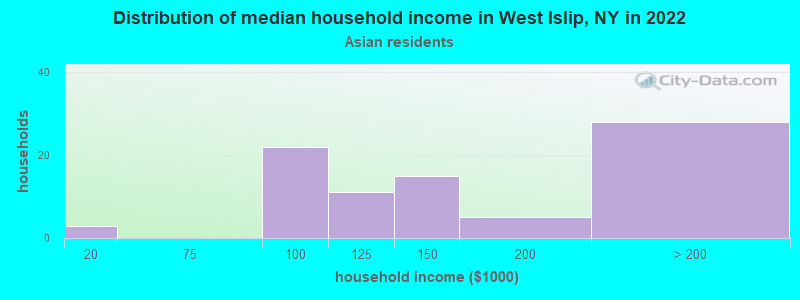
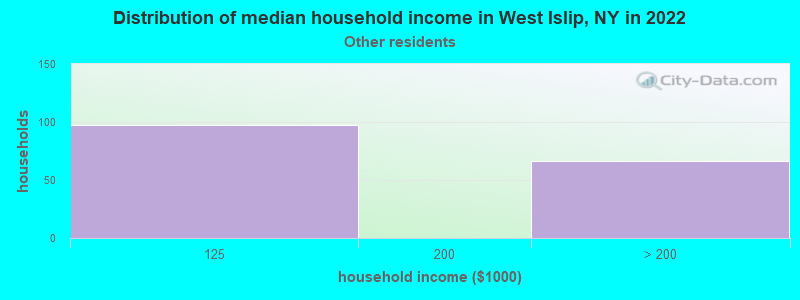
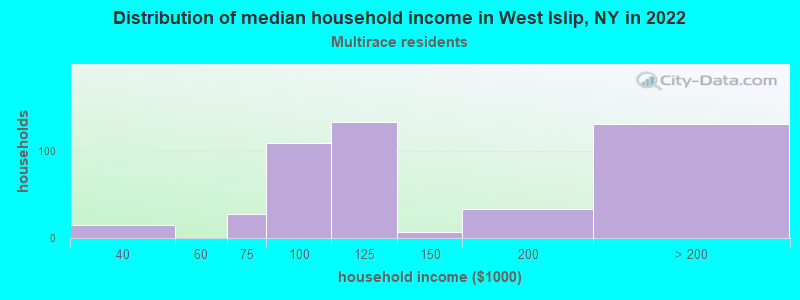
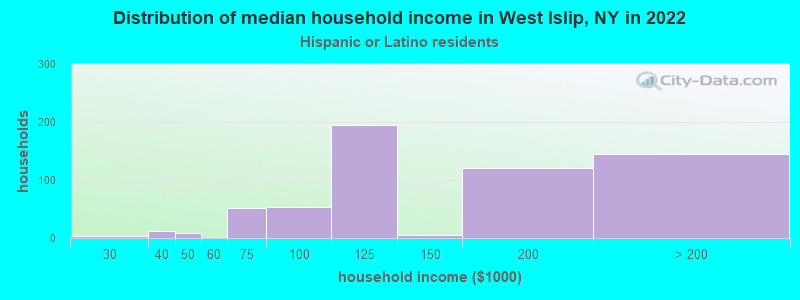
Income and house value in West Islip Median household income in 2022 $159,594 White non-Hispanic householders$88,742 Black householders$135,690 Asian householders$122,730 Two or more races householders$120,697 Hispanic or Latino race householdersMedian 2022 house value $612,358 White Non-Hispanic householders$467,619 Black or African American householders$402,867 American Indian or Alaska Native householders $701,136 Asian householders$659,238 Some other race householders$805,735 Two or more races householders$514,791 Hispanic or Latino householders
Median age by race in West Islip
44.3 Median age for White residents41.8 48.8 44.5 Median age for Black or African American residents46.0 38.2 -748,832,865.7 Median age for American Indian / Alaska Native residents-807,017,543.1 -513,692,161.9 39.5 Median age for Asian residents25.9 43.6 -742,816,091.2 Median age for Native Hawaiian / Pacific Islander residents-831,187,409.8 -771,300,447.7 32.9 Median age for Other race residents30.8 44.0 24.1 Median age for Two or more races residents23.2 25.9 43.7 Median age for White alone residents41.2 48.5 26.5 Median age for Hispanic or Latino residents24.4 29.4
Owner/renter occupied households by race in West Islip
House owners and renters - White residents 7,483 97.0% Owner occupied229 3.0% Renter occupiedHouse owners and renters - Black or African American residents 85 100.0% Owner occupiedHouse owners and renters - Asian residents 96 100.0% Owner occupiedHouse owners and renters - Other race residents 146 100.0% Owner occupiedHouse owners and renters - Two or more races residents 381 92.5% Owner occupied31 7.5% Renter occupiedHouse owners and renters - White alone residents 7,476 97.2% Owner occupied217 2.8% Renter occupiedHouse owners and renters - Hispanic or Latino residents 528 93.6% Owner occupied36 6.4% Renter occupied
Language usage in West Islip
English speakers - Total 88.1% of residents of West Islip speak English at home.
3.6% of residents speak Spanish at home 778 84.7% Speak English very well140 15.3% Speak English less than very well7.1% of residents speak other language at home 1,258 68.6% Speak English very well575 31.4% Speak English less than very well
English speakers - Born in the United States 87.1% of residents of West Islip speak English at home.
3.8% of residents speak Spanish at home 58 100.0% Speak English very well10.4% of residents speak other language at home 105 66.0% Speak English very well54 34.0% Speak English less than very well
English speakers - Native, born elsewhere 82.1% of residents of West Islip speak English at home.
17.9% of residents speak Spanish at home 13 52.0% Speak English very well12 48.0% Speak English less than very well5.7% of residents speak other language at home 8 100.0% Speak English very well
English speakers - Foreign-born 20.6% of residents of West Islip speak English at home.
17.6% of residents speak Spanish at home 218 69.9% Speak English very well94 30.1% Speak English less than very well58.3% of residents speak other language at home 549 53.1% Speak English very well485 46.9% Speak English less than very well
White (Caucasian) - Speak only English Native:
97.8% (19,916)Foreign-born:
25.1% (148)
White (Caucasian) - Speak another language Native:
3.0% (604)Foreign-born:
73.5% (434)
Black or African American - Speak only English Native:
97.0% (107)Foreign-born:
20.6% (16)
American Indian / Alaska Native - Speak another language Native:
100.0% (12)Foreign-born:
100.0% (8)
Asian - Speak only English Native:
62.8% (89)Foreign-born:
19.9% (92)
Asian - Speak another language Native:
34.0% (48)Foreign-born:
74.4% (346)
Other race - Speak only English Native:
50.3% (185)Foreign-born:
15.2% (29)
Other race - Speak another language Native:
51.0% (188)Foreign-born:
83.0% (160)
Two or more races - Speak only English Native:
85.9% (1,941)Foreign-born:
9.4% (16)
Two or more races - Speak another language Native:
14.8% (335)Foreign-born:
91.0% (154)
White alone - Speak only English Native:
96.1% (19,462)Foreign-born:
18.6% (137)
White alone - Speak another language Native:
3.9% (792)Foreign-born:
81.3% (598)
Hispanic or Latino - Speak only English Native:
79.8% (1,718)Foreign-born:
7.3% (25)
Hispanic or Latino - Speak another language Native:
22.1% (477)Foreign-born:
92.6% (322)
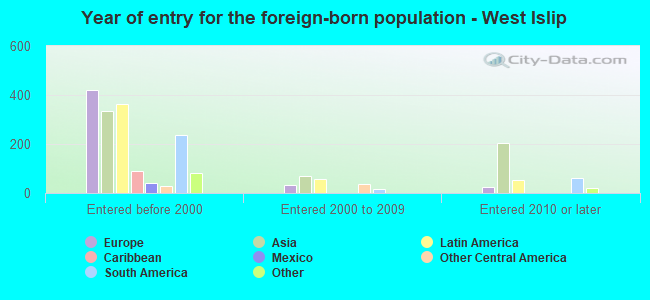
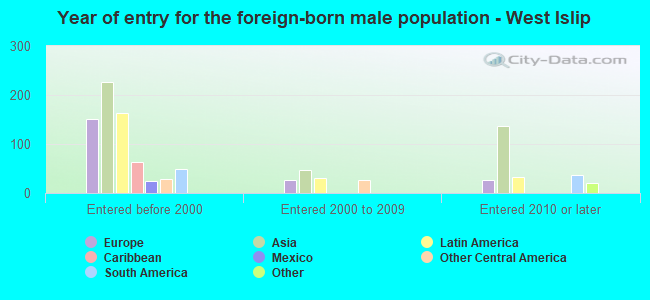
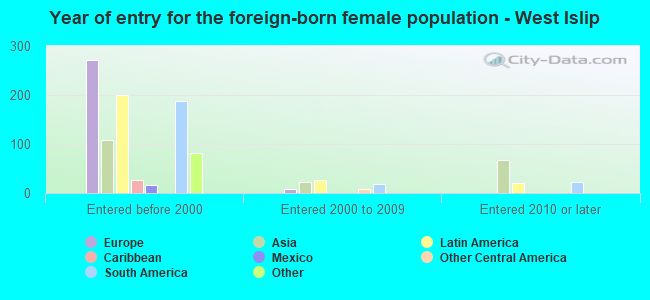
Foreign-born residents in West Islip 1,634 residents are foreign born (2.3% Asia , 2.0% Europe , 1.7% Latin America ).
This city:
6.0%New York:
22.6%
Marital status for residents in West Islip Marital status - White (Caucasian) population 15 years and over
Males 34.1% Never married57.0% Now married0.5% Separated2.4% Widowed6.0% DivorcedFemales 25.9% Never married56.2% Now married1.7% Separated8.5% Widowed7.8% DivorcedWomen who gave birth in the past 12 months Now married:
82.3% (330)Unmarried:
17.7% (71)
Women who did not give birth in the past 12 months Now married:
43.8% (1,715)Unmarried:
56.2% (2,200)
Marital status - Black or African American population 15 years and over
Males 3.4% Never married34.1% Now married0.0% Separated0.0% Widowed62.5% DivorcedFemales 46.0% Never married18.4% Now married18.4% Separated0.0% Widowed17.2% DivorcedWomen who did not give birth in the past 12 months Now married:
24.2% (16)Unmarried:
75.8% (50)
Marital status - Asian population 15 years and over
Males 54.3% Never married45.7% Now married0.0% Separated0.0% Widowed0.0% DivorcedFemales 41.5% Never married55.7% Now married0.0% Separated2.8% Widowed0.0% DivorcedWomen who did not give birth in the past 12 months Now married:
38.7% (48)Unmarried:
61.3% (76)
Marital status - Other race population 15 years and over
Males 16.8% Never married83.2% Now married0.0% Separated0.0% Widowed0.0% DivorcedFemales 27.3% Never married70.9% Now married0.0% Separated0.0% Widowed1.8% DivorcedWomen who did not give birth in the past 12 months Now married:
67.4% (187)Unmarried:
32.6% (90)
Marital status - Two or more races population 15 years and over
Males 55.3% Never married42.2% Now married0.0% Separated0.0% Widowed2.6% DivorcedFemales 41.4% Never married56.9% Now married0.0% Separated1.1% Widowed0.5% DivorcedWomen who gave birth in the past 12 months Now married:
100.0% (351)Unmarried:
0.0% (0)
Women who did not give birth in the past 12 months Now married:
21.2% (129)Unmarried:
78.8% (479)
Marital status - White alone, not Hispanic / Latino population 15 years and over
Males 33.5% Never married57.8% Now married0.5% Separated2.5% Widowed5.8% DivorcedFemales 24.8% Never married57.0% Now married1.8% Separated8.4% Widowed8.0% DivorcedWomen who gave birth in the past 12 months Now married:
81.9% (348)Unmarried:
18.1% (77)
Women who did not give birth in the past 12 months Now married:
45.0% (1,794)Unmarried:
55.0% (2,195)
Marital status - Hispanic or Latino population 15 years and over
Males 42.3% Never married51.5% Now married0.0% Separated0.0% Widowed6.2% DivorcedFemales 40.7% Never married54.1% Now married0.0% Separated3.7% Widowed1.5% DivorcedWomen who gave birth in the past 12 months Now married:
100.0% (258)Unmarried:
0.0% (0)
Women who did not give birth in the past 12 months Now married:
34.3% (262)Unmarried:
65.7% (502)
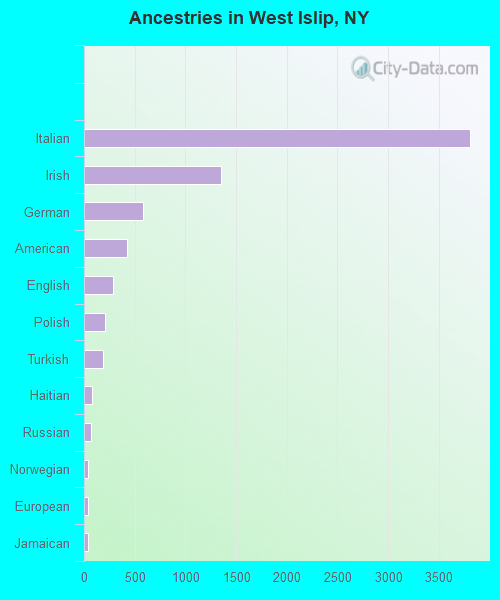
Ancestries in West Islip
3,805 40.5% Italian1,352 14.4% Irish583 6.2% German424 4.5% American284 3.0% English206 2.2% Polish184 2.0% Turkish75 0.8% Haitian69 0.7% Russian43 0.5% Norwegian42 0.4% European38 0.4% Jamaican33 0.4% Hungarian25 0.3% Egyptian25 0.3% Scottish24 0.3% Greek23 0.2% Portuguese22 0.2% Guyanese21 0.2% Brazilian21 0.2% Maltese21 0.2% Eastern European19 0.2% Armenian16 0.2% Czechoslovakian13 0.1% French Canadian12 0.1% Dutch12 0.1% Ukrainian10 0.1% Lithuanian9 0.10% French8 0.09% Bulgarian8 0.09% Croatian8 0.09% Latvian7 0.07% Austrian7 0.07% Estonian5 0.05% Welsh4 0.04% Czech4 0.04% Northern European3 0.03% Danish2 0.02% Nigerian
Children Nativity (place of birth) in West Islip
Children under 6 years - Living with two parents Both parents native 1,317 100.0% NativeBoth parents foreign-born 23 100.0% NativeOne native, one foreign-born parent 123 100.0% NativeChildren under 6 years - Living with one parent Native parent 179 100.0% NativeChildren 6 to 17 years - Living with two parents Both parents native 2,407 99.1% Native21 0.9% Foreign-bornBoth parents foreign-born 50 84.3% Native9 15.7% Foreign-bornOne native, one foreign-born parent 367 100.0% NativeChildren 6 to 17 years - Living with one parent Native parent 616 100.0% Native
Grandparents responsible for own grandchildren in West Islip
Grandparents (30 to 59 years) White / Caucasian 3 8.6% Responsible for grandchildren28 91.4% Not responsible for grandchildrenWhite alone, not Hispanic / Latino 3 7.5% Responsible for grandchildren32 92.5% Not responsible for grandchildrenGrandparents (60 years and over) White / Caucasian 101 33.2% Responsible for grandchildren204 66.8% Not responsible for grandchildrenWhite alone, not Hispanic / Latino 123 35.8% Responsible for grandchildren220 64.2% Not responsible for grandchildren