Races in West Lafayette, Indiana (IN) Detailed Stats
Data:
Races - White alone (%)
Races - White alone (% change since 2000)
Races - Black alone (%)
Races - Black alone (% change since 2000)
Races - American Indian alone (%)
Races - American Indian alone (% change since 2000)
Races - Asian alone (%)
Races - Asian alone (% change since 2000)
Races - Hispanic (%)
Races - Hispanic (% change since 2000)
Races - Native Hawaiian and Other Pacific Islander alone (%)
Races - Native Hawaiian and Other Pacific Islander alone (% change since 2000)
Races - Two or more races(%)
Races - Two or more races(% change since 2000)
Races - Other race alone (%)
Races - Other race alone (% change since 2000)
Racial diversity
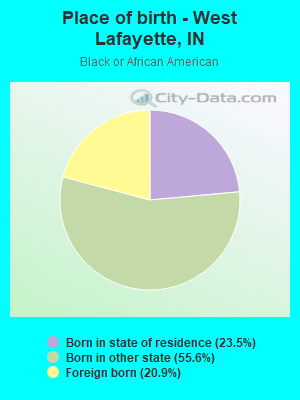
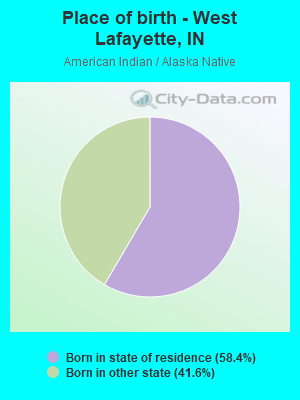
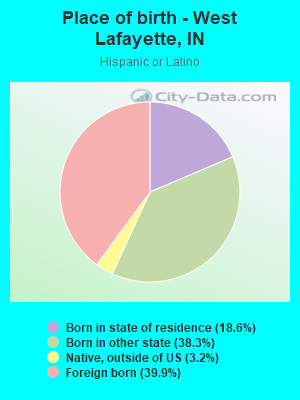
Place of birth - Born in state of residence (%)
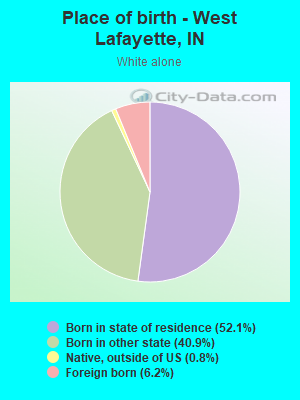
Place of birth - Born in state of residence (%) - White
Place of birth - Born in state of residence (%) - Black or African American
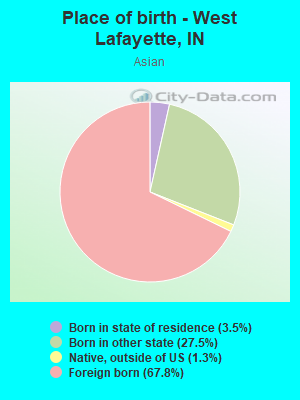
Place of birth - Born in state of residence (%) - Asian
Place of birth - Born in state of residence (%) - Hispanic or Latino
Place of birth - Born in state of residence (%) - American Indian and Alaska Native
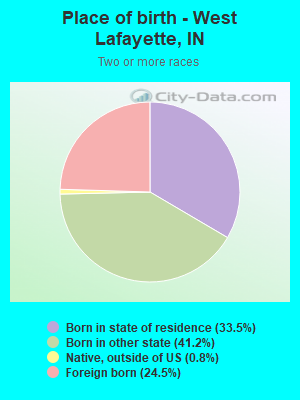
Place of birth - Born in state of residence (%) - Multirace
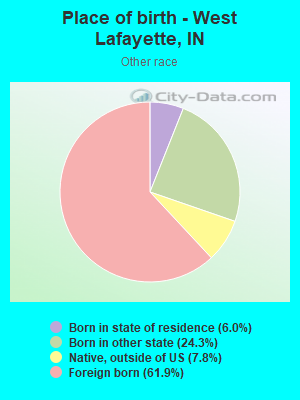
Place of birth - Born in state of residence (%) - Other Race
Place of birth - Born in other state (%)
Place of birth - Born in other state (%) - White
Place of birth - Born in other state (%) - Black or African American
Place of birth - Born in other state (%) - Asian
Place of birth - Born in other state (%) - Hispanic or Latino
Place of birth - Born in other state (%) - American Indian and Alaska Native
Place of birth - Born in other state (%) - Multirace
Place of birth - Born in other state (%) - Other Race
Place of birth - Native, outside of US (%)
Place of birth - Native, outside of US (%) - White
Place of birth - Native, outside of US (%) - Black or African American
Place of birth - Native, outside of US (%) - Asian
Place of birth - Native, outside of US (%) - Hispanic or Latino
Place of birth - Native, outside of US (%) - American Indian and Alaska Native
Place of birth - Native, outside of US (%) - Multirace
Place of birth - Native, outside of US (%) - Other Race
Place of birth - Foreign born (%)
Place of birth - Foreign born (%) - White
Place of birth - Foreign born (%) - Black or African American
Place of birth - Foreign born (%) - Asian
Place of birth - Foreign born (%) - Hispanic or Latino
Place of birth - Foreign born (%) - American Indian and Alaska Native
Place of birth - Foreign born (%) - Multirace
Place of birth - Foreign born (%) - Other Race
Residents speaking English at home (%)
Residents speaking English at home - Born in the United States (%)
Residents speaking English at home - Native, born elsewhere (%)
Residents speaking English at home - Foreign born (%)
Residents speaking Spanish at home (%)
Residents speaking Spanish at home - Born in the United States (%)
Residents speaking Spanish at home - Native, born elsewhere (%)
Residents speaking Spanish at home - Foreign born (%)
Residents speaking other language at home (%)
Residents speaking other language at home - Born in the United States (%)
Residents speaking other language at home - Native, born elsewhere (%)
Residents speaking other language at home - Foreign born (%)
Marital status - Never married (%)
Marital status - Now married (%)
Marital status - Separated (%)
Marital status - Widowed (%)
Marital status - Divorced (%)
Ancestries Reported - Arab (%)
Ancestries Reported - Czech (%)
Ancestries Reported - Danish (%)
Ancestries Reported - Dutch (%)
Ancestries Reported - English (%)
Ancestries Reported - French (%)
Ancestries Reported - French Canadian (%)
Ancestries Reported - German (%)
Ancestries Reported - Greek (%)
Ancestries Reported - Hungarian (%)
Ancestries Reported - Irish (%)
Ancestries Reported - Italian (%)
Ancestries Reported - Lithuanian (%)
Ancestries Reported - Norwegian (%)
Ancestries Reported - Polish (%)
Ancestries Reported - Portuguese (%)
Ancestries Reported - Russian (%)
Ancestries Reported - Scotch-Irish (%)
Ancestries Reported - Scottish (%)
Ancestries Reported - Slovak (%)
Ancestries Reported - Subsaharan African (%)
Ancestries Reported - Swedish (%)
Ancestries Reported - Swiss (%)
Ancestries Reported - Ukrainian (%)
Ancestries Reported - United States (%)
Ancestries Reported - Welsh (%)
Ancestries Reported - West Indian (%)
Ancestries Reported - Other (%)
Geographical mobility - Same house 1 year ago (%)
Geographical mobility - Same house 1 year ago (%) - White
Geographical mobility - Same house 1 year ago (%) - Black or African American
Geographical mobility - Same house 1 year ago (%) - Asian
Geographical mobility - Same house 1 year ago (%) - Hispanic or Latino
Geographical mobility - Same house 1 year ago (%) - American Indian and Alaska Native
Geographical mobility - Same house 1 year ago (%) - Multirace
Geographical mobility - Same house 1 year ago (%) - Other Race
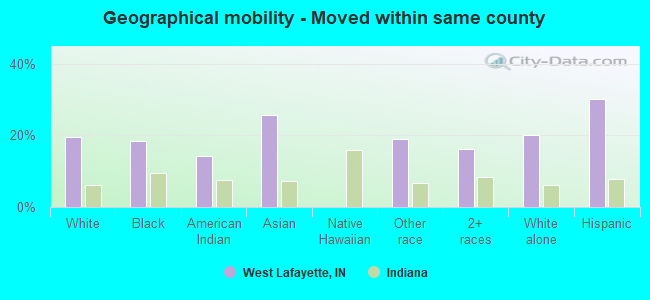
Geographical mobility - Moved within same county (%)
Geographical mobility - Moved within same county (%) - White
Geographical mobility - Moved within same county (%) - Black or African American
Geographical mobility - Moved within same county (%) - Asian
Geographical mobility - Moved within same county (%) - Hispanic or Latino
Geographical mobility - Moved within same county (%) - American Indian and Alaska Native
Geographical mobility - Moved within same county (%) - Multirace
Geographical mobility - Moved within same county (%) - Other Race
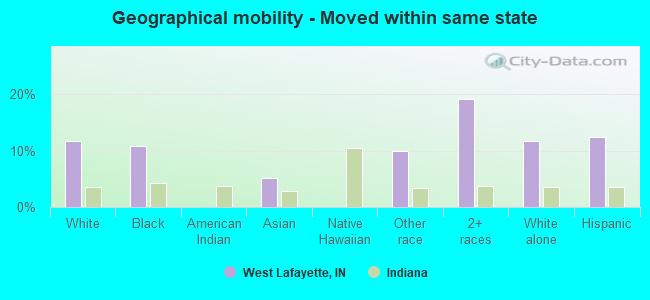
Geographical mobility - Moved from different county within same state (%)
Geographical mobility - Moved from different county within same state (%) - White
Geographical mobility - Moved from different county within same state (%) - Black or African American
Geographical mobility - Moved from different county within same state (%) - Asian
Geographical mobility - Moved from different county within same state (%) - Hispanic or Latino
Geographical mobility - Moved from different county within same state (%) - American Indian and Alaska Native
Geographical mobility - Moved from different county within same state (%) - Multirace
Geographical mobility - Moved from different county within same state (%) - Other Race
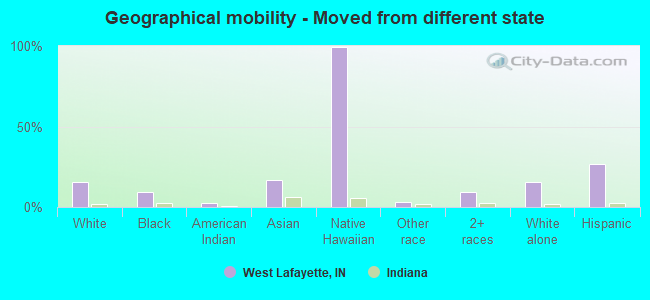
Geographical mobility - Moved from different state (%)
Geographical mobility - Moved from different state (%) - White
Geographical mobility - Moved from different state (%) - Black or African American
Geographical mobility - Moved from different state (%) - Asian
Geographical mobility - Moved from different state (%) - Hispanic or Latino
Geographical mobility - Moved from different state (%) - American Indian and Alaska Native
Geographical mobility - Moved from different state (%) - Multirace
Geographical mobility - Moved from different state (%) - Other Race
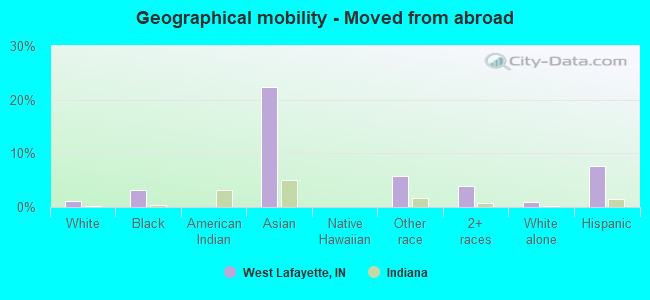
Geographical mobility - Moved from abroad (%)
Geographical mobility - Moved from abroad (%) - White
Geographical mobility - Moved from abroad (%) - Black or African American
Geographical mobility - Moved from abroad (%) - Asian
Geographical mobility - Moved from abroad (%) - Hispanic or Latino
Geographical mobility - Moved from abroad (%) - American Indian and Alaska Native
Geographical mobility - Moved from abroad (%) - Multirace
Geographical mobility - Moved from abroad (%) - Other Race
Place of birth for the foreign-born population - Ireland (%)
Place of birth for the foreign-born population - Denmark (%)
Place of birth for the foreign-born population - Norway (%)
Place of birth for the foreign-born population - Sweden (%)
Place of birth for the foreign-born population - United Kingdom (%)
Place of birth for the foreign-born population - England (%)
Place of birth for the foreign-born population - Scotland (%)
Place of birth for the foreign-born population - Other Northern Europe (%)
Place of birth for the foreign-born population - Austria (%)
Place of birth for the foreign-born population - Belgium (%)
Place of birth for the foreign-born population - France (%)
Place of birth for the foreign-born population - Germany (%)
Place of birth for the foreign-born population - Netherlands (%)
Place of birth for the foreign-born population - Switzerland (%)
Place of birth for the foreign-born population - Other Western Europe (%)
Place of birth for the foreign-born population - Greece (%)
Place of birth for the foreign-born population - Italy (%)
Place of birth for the foreign-born population - Portugal (%)
Place of birth for the foreign-born population - Spain (%)
Place of birth for the foreign-born population - Other Southern Europe (%)
Place of birth for the foreign-born population - Albania (%)
Place of birth for the foreign-born population - Belarus (%)
Place of birth for the foreign-born population - Bosnia and Herzegovina (%)
Place of birth for the foreign-born population - Bulgaria (%)
Place of birth for the foreign-born population - Croatia (%)
Place of birth for the foreign-born population - Czechoslovakia (%)
Place of birth for the foreign-born population - Hungary (%)
Place of birth for the foreign-born population - Latvia (%)
Place of birth for the foreign-born population - Lithuania (%)
Place of birth for the foreign-born population - North Macedonia (Macedonia) (%)
Place of birth for the foreign-born population - Moldova (%)
Place of birth for the foreign-born population - Poland (%)
Place of birth for the foreign-born population - Romania (%)
Place of birth for the foreign-born population - Russia (%)
Place of birth for the foreign-born population - Serbia (%)
Place of birth for the foreign-born population - Ukraine (%)
Place of birth for the foreign-born population - Other Eastern Europe (%)
Place of birth for the foreign-born population - China (%)
Place of birth for the foreign-born population - Hong Kong (%)
Place of birth for the foreign-born population - Taiwan (%)
Place of birth for the foreign-born population - Japan (%)
Place of birth for the foreign-born population - Korea (%)
Place of birth for the foreign-born population - Other Eastern Asia (%)
Place of birth for the foreign-born population - Afghanistan (%)
Place of birth for the foreign-born population - Bangladesh (%)
Place of birth for the foreign-born population - India (%)
Place of birth for the foreign-born population - Iran (%)
Place of birth for the foreign-born population - Kazakhstan (%)
Place of birth for the foreign-born population - Nepal (%)
Place of birth for the foreign-born population - Pakistan (%)
Place of birth for the foreign-born population - Sri Lanka (%)
Place of birth for the foreign-born population - Uzbekistan (%)
Place of birth for the foreign-born population - Other South Central Asia (%)
Place of birth for the foreign-born population - Burma (%)
Place of birth for the foreign-born population - Cambodia (%)
Place of birth for the foreign-born population - Indonesia (%)
Place of birth for the foreign-born population - Laos (%)
Place of birth for the foreign-born population - Malaysia (%)
Place of birth for the foreign-born population - Philippines (%)
Place of birth for the foreign-born population - Singapore (%)
Place of birth for the foreign-born population - Thailand (%)
Place of birth for the foreign-born population - Vietnam (%)
Place of birth for the foreign-born population - Other South Eastern Asia (%)
Place of birth for the foreign-born population - Armenia (%)
Place of birth for the foreign-born population - Iraq (%)
Place of birth for the foreign-born population - Israel (%)
Place of birth for the foreign-born population - Jordan (%)
Place of birth for the foreign-born population - Kuwait (%)
Place of birth for the foreign-born population - Lebanon (%)
Place of birth for the foreign-born population - Saudi Arabia (%)
Place of birth for the foreign-born population - Syria (%)
Place of birth for the foreign-born population - Turkey (%)
Place of birth for the foreign-born population - Yemen (%)
Place of birth for the foreign-born population - Other Western Asia (%)
Place of birth for the foreign-born population - Eritrea (%)
Place of birth for the foreign-born population - Ethiopia (%)
Place of birth for the foreign-born population - Kenya (%)
Place of birth for the foreign-born population - Somalia (%)
Place of birth for the foreign-born population - Uganda (%)
Place of birth for the foreign-born population - Zimbabwe (%)
Place of birth for the foreign-born population - Other Eastern Africa (%)
Place of birth for the foreign-born population - Cameroon (%)
Place of birth for the foreign-born population - Congo (%)
Place of birth for the foreign-born population - Democratic Republic of Congo (Zaire) (%)
Place of birth for the foreign-born population - Other Middle Africa (%)
Place of birth for the foreign-born population - Egypt (%)
Place of birth for the foreign-born population - Morocco (%)
Place of birth for the foreign-born population - Sudan (%)
Place of birth for the foreign-born population - Other Northern Africa (%)
Place of birth for the foreign-born population - South Africa (%)
Place of birth for the foreign-born population - Other Southern Africa (%)
Place of birth for the foreign-born population - Cabo Verde (%)
Place of birth for the foreign-born population - Ghana (%)
Place of birth for the foreign-born population - Liberia (%)
Place of birth for the foreign-born population - Nigeria (%)
Place of birth for the foreign-born population - Senegal (%)
Place of birth for the foreign-born population - Sierra Leone (%)
Place of birth for the foreign-born population - Other Western Africa (%)
Place of birth for the foreign-born population - Australia (%)
Place of birth for the foreign-born population - New Zealand (%)
Place of birth for the foreign-born population - Fiji (%)
Place of birth for the foreign-born population - Micronesia (%)
Place of birth for the foreign-born population - Bahamas (%)
Place of birth for the foreign-born population - Barbados (%)
Place of birth for the foreign-born population - Cuba (%)
Place of birth for the foreign-born population - Dominica (%)
Place of birth for the foreign-born population - Dominican Republic (%)
Place of birth for the foreign-born population - Grenada (%)
Place of birth for the foreign-born population - Haiti (%)
Place of birth for the foreign-born population - Jamaica (%)
Place of birth for the foreign-born population - St. Vincent and the Grenadines (%)
Place of birth for the foreign-born population - Trinidad and Tobago (%)
Place of birth for the foreign-born population - West Indies (%)
Place of birth for the foreign-born population - Other Caribbean (%)
Place of birth for the foreign-born population - Belize (%)
Place of birth for the foreign-born population - Costa Rica (%)
Place of birth for the foreign-born population - El Salvador (%)
Place of birth for the foreign-born population - Guatemala (%)
Place of birth for the foreign-born population - Honduras (%)
Place of birth for the foreign-born population - Mexico (%)
Place of birth for the foreign-born population - Nicaragua (%)
Place of birth for the foreign-born population - Panama (%)
Place of birth for the foreign-born population - Other Central America (%)
Place of birth for the foreign-born population - Argentina (%)
Place of birth for the foreign-born population - Bolivia (%)
Place of birth for the foreign-born population - Brazil (%)
Place of birth for the foreign-born population - Chile (%)
Place of birth for the foreign-born population - Colombia (%)
Place of birth for the foreign-born population - Ecuador (%)
Place of birth for the foreign-born population - Guyana (%)
Place of birth for the foreign-born population - Peru (%)
Place of birth for the foreign-born population - Uruguay (%)
Place of birth for the foreign-born population - Venezuela (%)
Place of birth for the foreign-born population - Other South America (%)
Place of birth for the foreign-born population - Canada (%)
Place of birth for the foreign-born population - Other Northern America (%)
Place of birth for the foreign-born population - Other (%)
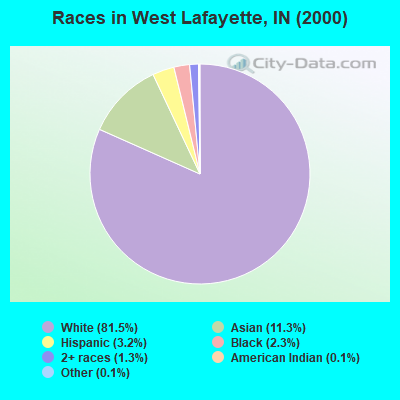
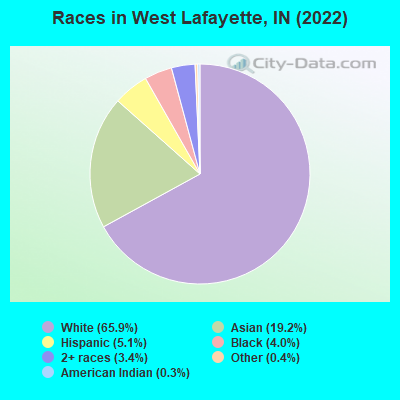
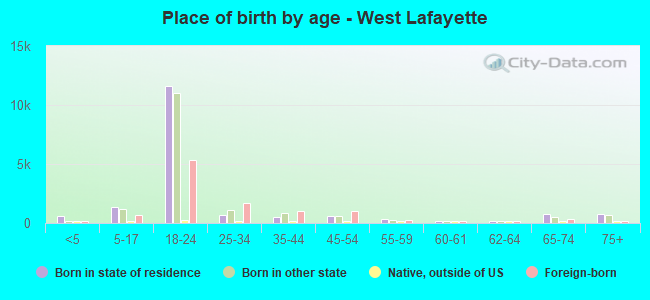
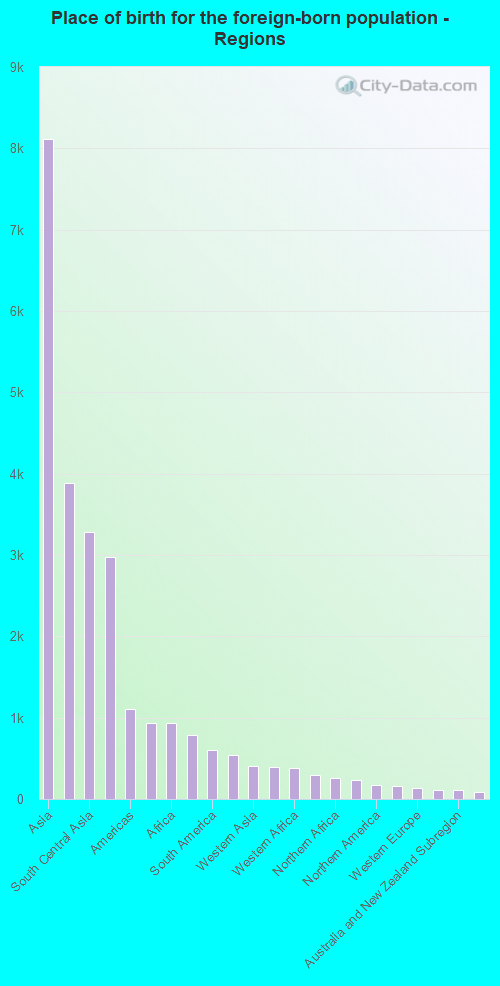
According to 2022 data, the most numerous races in West Lafayette, IN are White alone (29,836 residents), Black alone (1,820 residents), and Hispanic (2,294 residents). 75.6% of West Lafayette residents speak English at home. 24.4% of West Lafayette, IN residents are foreign-born (16.5% born in Asia), which is 75.5% greater than the foreign-born rate of 6.0% across the entire state of Indiana.
Race distribution in West Lafayette
2000 2022
5,219,373 85.8% White alone 505,462 8.3% Black alone 214,536 3.5% Hispanic 61,115 1.0% Two or more races 58,424 1.0% Asian alone 13,654 0.2% American Indian alone 6,348 0.1% Other race alone 1,573 0.03% Native Hawaiian and Other
5,192,455 76.0% White alone 628,054 9.2% Black alone 534,528 7.8% Hispanic 263,242 3.9% Two or more races 172,880 2.5% Asian alone 33,467 0.5% Other race alone 5,866 0.09% American Indian alone 2,545 0.04% Native Hawaiian and Other
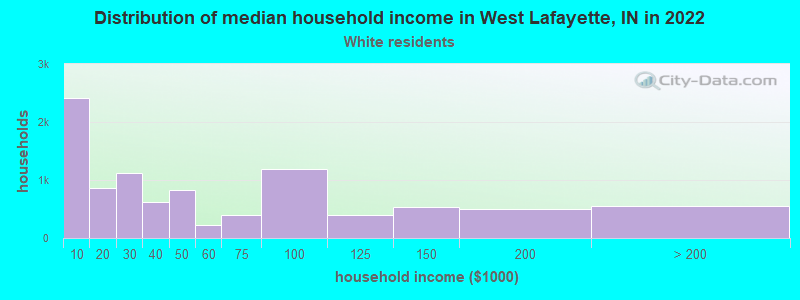
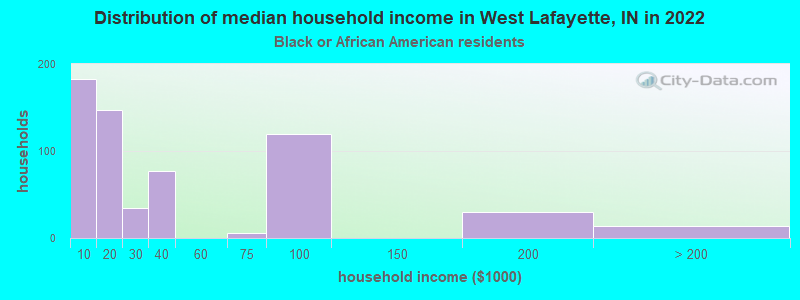
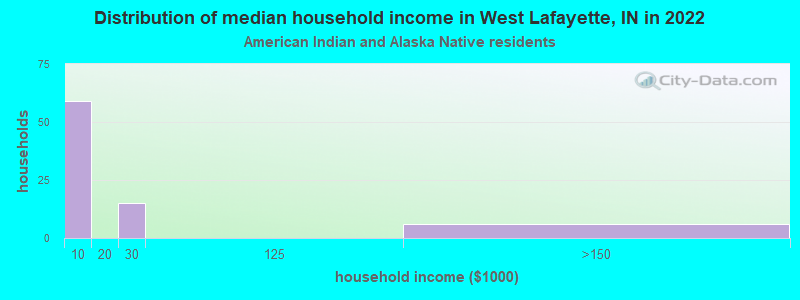
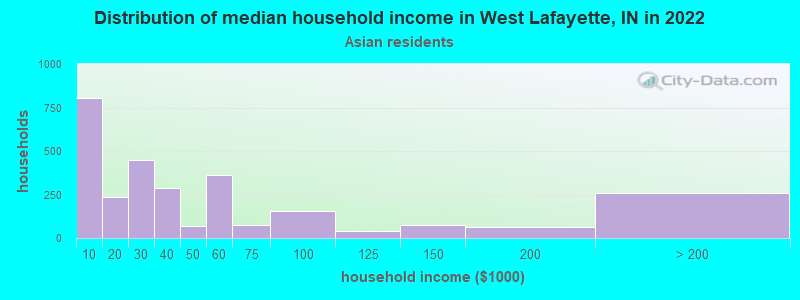
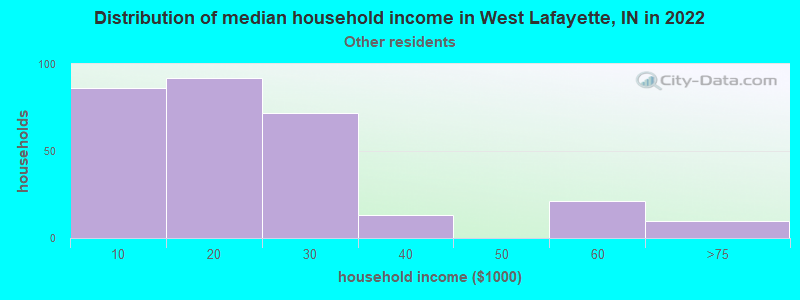
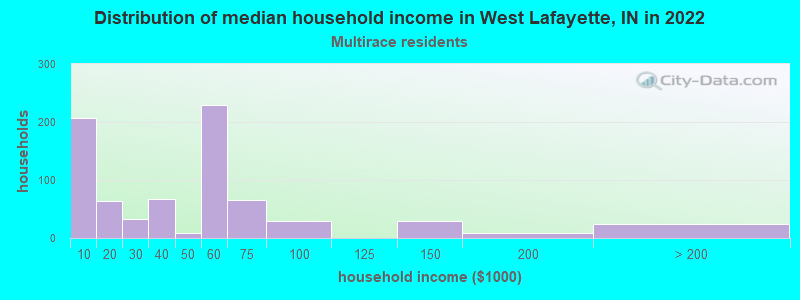
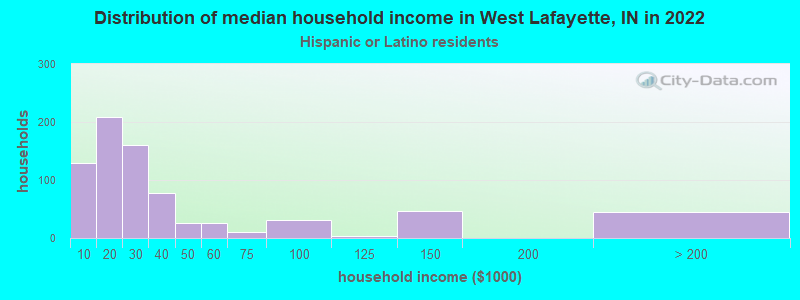
Income and house value in West Lafayette Median household income in 2022 $35,562 White non-Hispanic householders$16,612 Black householders$30,343 Asian householders$50,522 Two or more races householders$21,606 Hispanic or Latino race householdersMedian 2022 house value $337,637 White Non-Hispanic householders$339,961 Black or African American householders$261,419 American Indian or Alaska Native householders $375,979 Asian householders$220,754 Some other race householders$392,245 Two or more races householders$224,472 Hispanic or Latino householders
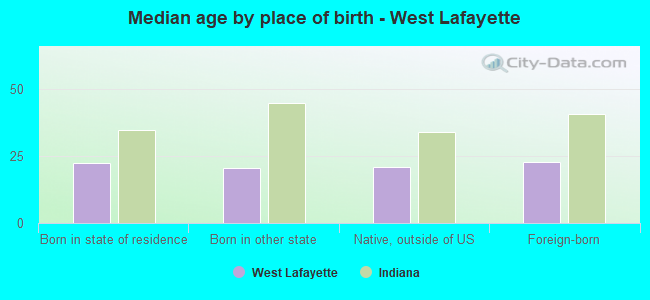
Median age by race in West Lafayette
21.5 Median age for White residents21.7 21.3 22.9 Median age for Black or African American residents23.4 22.8 22.1 Median age for American Indian / Alaska Native residents25.1 39.5 21.4 Median age for Asian residents20.9 21.1 -666,666,666.0 Median age for Native Hawaiian / Pacific Islander residents-666,666,666.0 -666,666,666.0 24.6 Median age for Other race residents22.2 25.1 22.0 Median age for Two or more races residents23.0 22.2 21.2 Median age for White alone residents21.4 21.1 20.8 Median age for Hispanic or Latino residents21.6 19.4
Owner/renter occupied households by race in West Lafayette
House owners and renters - White residents 3,367 37.0% Owner occupied5,733 63.0% Renter occupiedHouse owners and renters - Black or African American residents 212 27.4% Owner occupied563 72.6% Renter occupiedHouse owners and renters - American Indian / Alaska Native residents 9 13.7% Owner occupied58 86.3% Renter occupiedHouse owners and renters - Asian residents 566 18.7% Owner occupied2,461 81.3% Renter occupiedHouse owners and renters - Other race residents 268 100.0% Renter occupiedHouse owners and renters - Two or more races residents 108 11.0% Owner occupied878 89.0% Renter occupiedHouse owners and renters - White alone residents 3,381 37.5% Owner occupied5,625 62.5% Renter occupiedHouse owners and renters - Hispanic or Latino residents 79 9.8% Owner occupied726 90.2% Renter occupied
Language usage in West Lafayette
English speakers - Total 75.6% of residents of West Lafayette speak English at home.
2.6% of residents speak Spanish at home 935 81.3% Speak English very well215 18.7% Speak English less than very well19.7% of residents speak other language at home 6,040 69.0% Speak English very well2,711 31.0% Speak English less than very well
English speakers - Born in the United States 87.5% of residents of West Lafayette speak English at home.
2.0% of residents speak Spanish at home 282 82.5% Speak English very well60 17.5% Speak English less than very well9.7% of residents speak other language at home 1,426 87.9% Speak English very well197 12.1% Speak English less than very well
English speakers - Native, born elsewhere 65.3% of residents of West Lafayette speak English at home.
29.3% of residents speak Spanish at home 100 97.1% Speak English very well3 2.9% Speak English less than very well56.0% of residents speak other language at home 188 95.4% Speak English very well9 4.6% Speak English less than very well
English speakers - Foreign-born 26.5% of residents of West Lafayette speak English at home.
5.8% of residents speak Spanish at home 487 80.1% Speak English very well121 19.9% Speak English less than very well60.1% of residents speak other language at home 3,941 62.0% Speak English very well2,411 38.0% Speak English less than very well
White (Caucasian) - Speak only English Native:
96.2% (26,754)Foreign-born:
26.2% (524)
White (Caucasian) - Speak another language Native:
3.5% (975)Foreign-born:
74.5% (1,492)
Black or African American - Speak only English Native:
83.4% (811)Foreign-born:
9.1% (90)
Black or African American - Speak another language Native:
20.1% (195)Foreign-born:
98.7% (973)
Asian - Speak only English Native:
59.7% (1,603)Foreign-born:
19.3% (1,132)
Asian - Speak another language Native:
39.4% (1,058)Foreign-born:
80.7% (4,721)
Other race - Speak only English Native:
34.2% (81)Foreign-born:
50.8% (193)
Other race - Speak another language Native:
82.4% (194)Foreign-born:
41.5% (158)
Two or more races - Speak only English Native:
78.1% (1,674)Foreign-born:
46.2% (373)
Two or more races - Speak another language Native:
23.6% (505)Foreign-born:
57.1% (461)
White alone - Speak only English Native:
96.1% (26,647)Foreign-born:
32.5% (597)
White alone - Speak another language Native:
4.2% (1,158)Foreign-born:
67.4% (1,239)
Hispanic or Latino - Speak only English Native:
57.7% (711)Foreign-born:
17.8% (158)
Hispanic or Latino - Speak another language Native:
42.4% (523)Foreign-born:
76.3% (678)
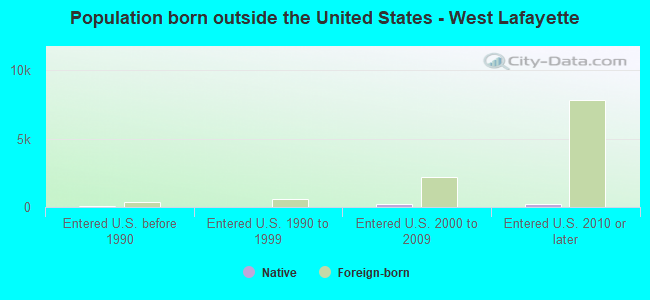
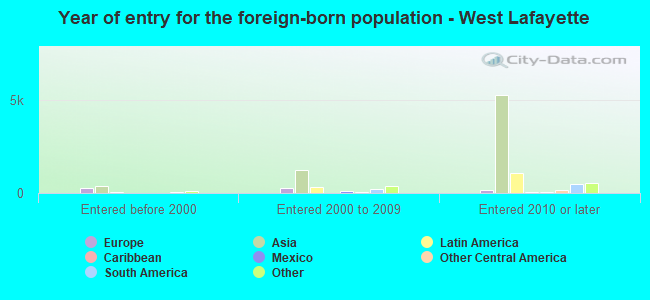
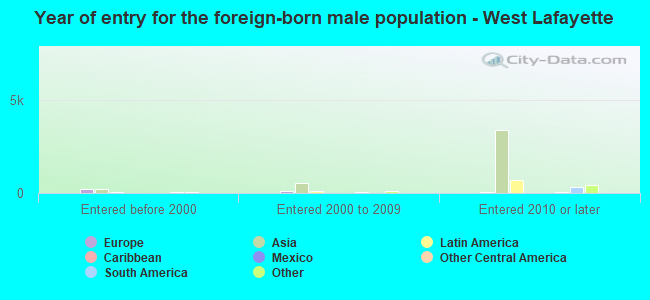
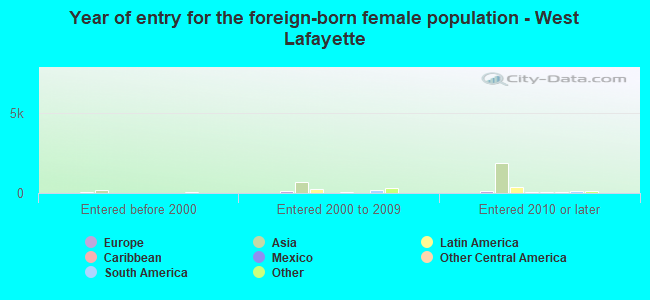
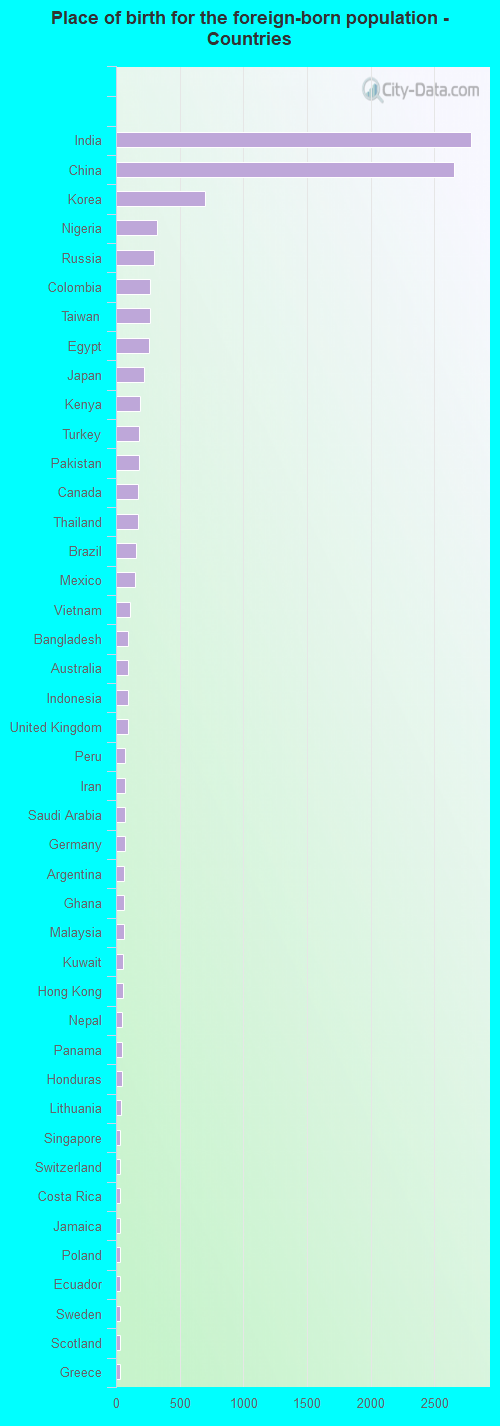
Foreign-born residents in West Lafayette 11,069 residents are foreign born (16.5% Asia ).
This city:
24.4%Indiana:
5.6%
Marital status for residents in West Lafayette Marital status - White (Caucasian) population 15 years and over
Males 77.9% Never married17.5% Now married0.2% Separated2.4% Widowed2.1% DivorcedFemales 68.3% Never married21.4% Now married0.7% Separated5.7% Widowed3.8% DivorcedWomen who gave birth in the past 12 months Now married:
100.0% (69)Unmarried:
0.0% (0)
Women who did not give birth in the past 12 months Now married:
13.4% (1,383)Unmarried:
86.6% (8,912)
Marital status - Black or African American population 15 years and over
Males 71.2% Never married24.0% Now married3.8% Separated0.0% Widowed1.0% DivorcedFemales 70.2% Never married21.2% Now married0.0% Separated2.4% Widowed6.1% DivorcedWomen who did not give birth in the past 12 months Now married:
14.2% (94)Unmarried:
85.8% (568)
Marital status - American Indian / Alaska Native population 15 years and over
Males 64.3% Never married35.7% Now married0.0% Separated0.0% Widowed0.0% DivorcedFemales 47.2% Never married44.4% Now married0.0% Separated0.0% Widowed8.3% DivorcedWomen who did not give birth in the past 12 months Now married:
44.4% (75)Unmarried:
55.6% (94)
Marital status - Asian population 15 years and over
Males 81.2% Never married18.0% Now married0.0% Separated0.0% Widowed0.8% DivorcedFemales 66.7% Never married29.9% Now married1.0% Separated0.8% Widowed1.6% DivorcedWomen who gave birth in the past 12 months Now married:
100.0% (49)Unmarried:
0.0% (0)
Women who did not give birth in the past 12 months Now married:
24.5% (669)Unmarried:
75.5% (2,066)
Marital status - Other race population 15 years and over
Males 64.3% Never married35.7% Now married0.0% Separated0.0% Widowed0.0% DivorcedFemales 96.0% Never married4.0% Now married0.0% Separated0.0% Widowed0.0% DivorcedWomen who did not give birth in the past 12 months Now married:
4.0% (8)Unmarried:
96.0% (205)
Marital status - Two or more races population 15 years and over
Males 80.4% Never married18.8% Now married0.0% Separated0.8% Widowed0.0% DivorcedFemales 86.5% Never married13.5% Now married0.0% Separated0.0% Widowed0.0% DivorcedWomen who gave birth in the past 12 months Now married:
100.0% (7)Unmarried:
0.0% (0)
Women who did not give birth in the past 12 months Now married:
8.0% (74)Unmarried:
92.0% (851)
Marital status - White alone, not Hispanic / Latino population 15 years and over
Males 77.5% Never married17.7% Now married0.2% Separated2.5% Widowed2.1% DivorcedFemales 68.3% Never married21.0% Now married0.7% Separated6.0% Widowed4.0% DivorcedWomen who gave birth in the past 12 months Now married:
100.0% (65)Unmarried:
0.0% (0)
Women who did not give birth in the past 12 months Now married:
12.6% (1,265)Unmarried:
87.4% (8,754)
Marital status - Hispanic or Latino population 15 years and over
Males 78.0% Never married22.0% Now married0.0% Separated0.0% Widowed0.0% DivorcedFemales 77.0% Never married22.3% Now married0.7% Separated0.0% Widowed0.0% DivorcedWomen who gave birth in the past 12 months Now married:
100.0% (6)Unmarried:
0.0% (0)
Women who did not give birth in the past 12 months Now married:
19.2% (233)Unmarried:
80.8% (978)
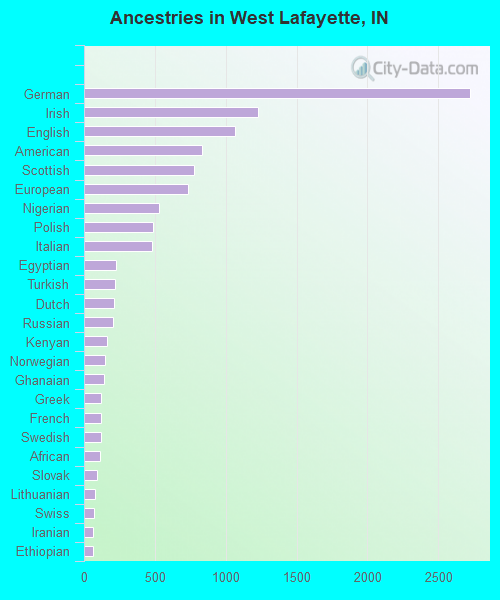
Ancestries in West Lafayette
2,722 11.9% German1,227 5.3% Irish1,068 4.7% English835 3.6% American775 3.4% Scottish731 3.2% European526 2.3% Nigerian487 2.1% Polish479 2.1% Italian227 1.0% Egyptian222 1.0% Turkish209 0.9% Dutch202 0.9% Russian161 0.7% Kenyan145 0.6% Norwegian142 0.6% Ghanaian123 0.5% Greek118 0.5% French118 0.5% Swedish115 0.5% African91 0.4% Slovak77 0.3% Lithuanian69 0.3% Swiss64 0.3% Iranian63 0.3% Ethiopian61 0.3% Scotch-Irish55 0.2% Scandinavian52 0.2% Brazilian51 0.2% French Canadian47 0.2% Jamaican47 0.2% Czech36 0.2% Zimbabwean35 0.2% Serbian33 0.1% Croatian32 0.1% Lebanese32 0.1% Danish31 0.1% Armenian30 0.1% Jordanian26 0.1% Hungarian26 0.1% Romanian22 0.10% Icelander21 0.09% Portuguese19 0.08% Belgian18 0.08% British18 0.08% Australian15 0.07% Haitian14 0.06% Ukrainian13 0.06% Austrian12 0.05% Eastern European11 0.05% Moroccan11 0.05% Albanian10 0.04% Estonian7 0.03% Palestinian6 0.03% Finnish6 0.03% Welsh2 0.01% Canadian
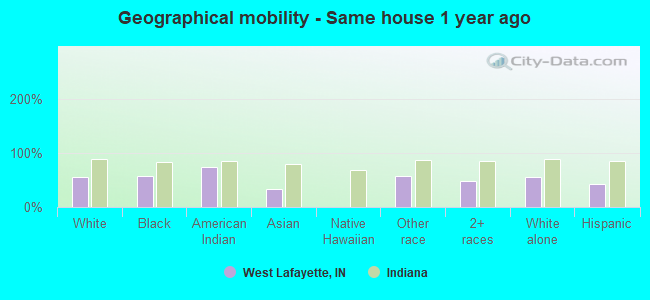
Geographical mobility in West Lafayette Same house 1 year ago 16,508 55.0% White (Caucasian)1,054 56.6% Black or African American138 74.1% American Indian / Alaska Native2,858 33.3% Asian454 57.9% Other race1,528 47.3% Two or more races16,404 55.0% White alone, not Hispanic / Latino980 42.7% Hispanic or LatinoMoved within same county 5,918 19.7% White / Caucasian341 18.3% Black or African American26 14.2% American Indian / Alaska Native2,207 25.7% Asian149 19.0% Other race528 16.3% Two or more races5,986 20.1% White alone, not Hispanic / Latino694 30.2% Hispanic or LatinoMoved within same state 3,493 11.6% White / Caucasian201 10.8% Black or African American435 5.1% Asian77 9.8% Other race618 19.1% Two or more races3,464 11.6% White alone, not Hispanic / Latino283 12.3% Hispanic or LatinoMoved from different state 4,612 15.4% White / Caucasian168 9.0% Black or African American5 2.6% American Indian / Alaska Native1,420 16.6% Asian15 99.3% Native Hawaiian / Pacific Islander24 3.0% Other race292 9.0% Two or more races4,671 15.7% White alone, not Hispanic / Latino608 26.5% Hispanic or LatinoMoved from abroad 309 1.0% White59 3.2% Black or African American1,917 22.3% Asian45 5.7% Other race124 3.8% Two or more races252 0.8% White alone, not Hispanic / Latino173 7.6% Hispanic or Latino
Children Nativity (place of birth) in West Lafayette
Children under 6 years - Living with two parents Both parents native 338 100.0% NativeBoth parents foreign-born 234 71.4% Native94 28.6% Foreign-bornOne native, one foreign-born parent 213 97.3% Native6 2.7% Foreign-bornChildren under 6 years - Living with one parent Native parent 107 100.0% NativeForeign-born parent 6 13.0% Native40 87.0% Foreign-bornChildren 6 to 17 years - Living with two parents Both parents native 868 91.2% Native83 8.8% Foreign-bornBoth parents foreign-born 671 68.4% Native310 31.6% Foreign-bornOne native, one foreign-born parent 291 97.2% Native8 2.8% Foreign-bornChildren 6 to 17 years - Living with one parent Native parent 214 100.0% NativeForeign-born parent 175 50.6% Native170 49.4% Foreign-born
Grandparents responsible for own grandchildren in West Lafayette
Grandparents (30 to 59 years) White / Caucasian 2 18.9% Responsible for grandchildren10 81.1% Not responsible for grandchildrenBlack or African American 12 100.0% Not responsible for grandchildrenAsian 5 100.0% Not responsible for grandchildrenTwo or more races 10 100.0% Not responsible for grandchildrenWhite alone, not Hispanic / Latino 11 100.0% Not responsible for grandchildrenHispanic or Latino 3 100.0% Responsible for grandchildren
Grandparents (60 years and over) White / Caucasian 63 100.0% Not responsible for grandchildrenAsian 19 100.0% Not responsible for grandchildrenWhite alone, not Hispanic / Latino 64 100.0% Not responsible for grandchildren