Races in West Lake Sammamish, Washington (WA) Detailed Stats
Ancestries, Foreign-born residents, place of birth

Recent posts about races in West Lake Sammamish, Washington on our local forum with over 2,400,000 registered users:

14.2% of West Lake Sammamish, WA residents are foreign-born (7.5% born in Asia, 3.2% born in North America, 1.8% born in Europe), which is 5.4% less than the foreign-born rate of 15.0% across the entire state of Washington.
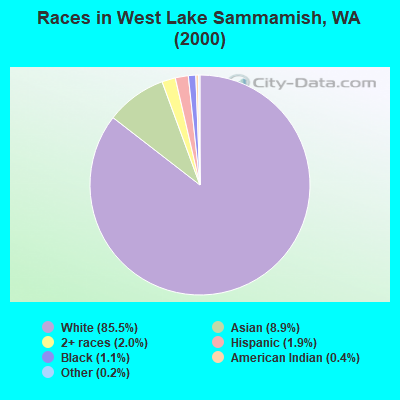
Race distribution in West Lake Sammamish

- 5,07485.5%White alone
- 5298.9%Asian alone
- 1182.0%Two or more races
- 1131.9%Hispanic
- 641.1%Black alone
- 250.4%American Indian alone
- 100.2%Other race alone
- 40.07%Native Hawaiian and Other
Pacific Islander alone
2000
2022
-
- 4,652,49078.9%White alone
- 441,5097.5%Hispanic
- 319,4015.4%Asian alone
- 184,6313.1%Black alone
- 175,9263.0%Two or more races
- 85,3961.4%American Indian alone
- 22,7790.4%Native Hawaiian and Other
Pacific Islander alone - 11,9890.2%Other race alone

-
- 4,941,45663.5%White alone
- 1,093,31314.0%Hispanic
- 755,8329.7%Asian alone
- 523,4486.7%Two or more races
- 299,5373.8%Black alone
- 69,0240.9%American Indian alone
- 52,2310.7%Native Hawaiian and Other
Pacific Islander alone - 50,9450.7%Other race alone

Income and house value in West Lake Sammamish
- Median household income in 2022
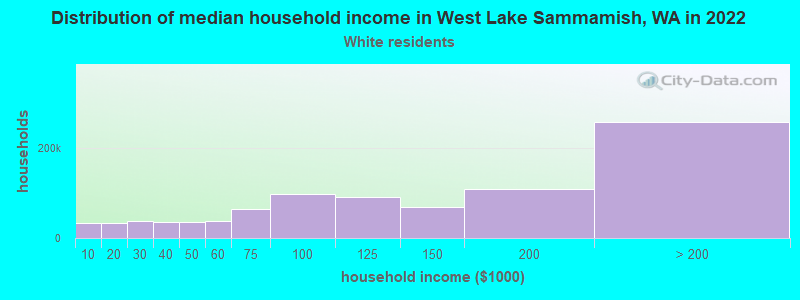
- $187,876White non-Hispanic householders
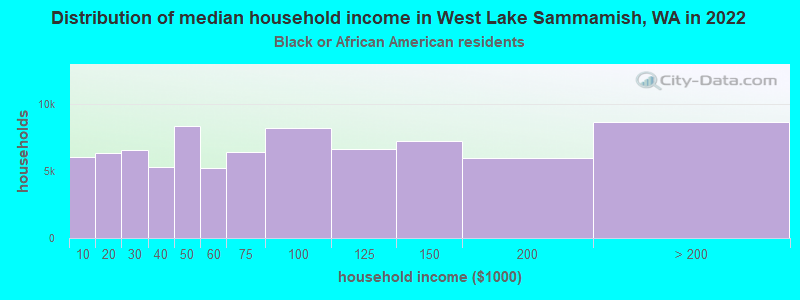
- $96,081Black householders
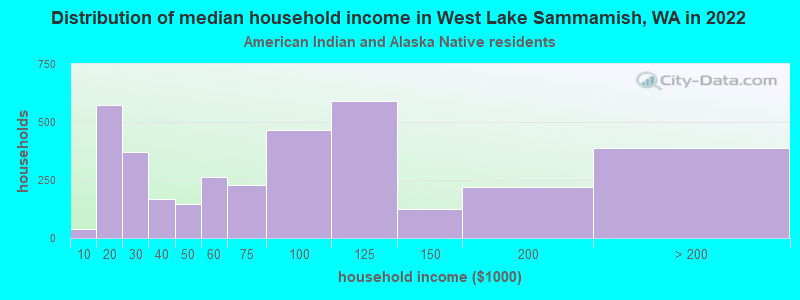
- $55,551American Indian and Alaska Native householders
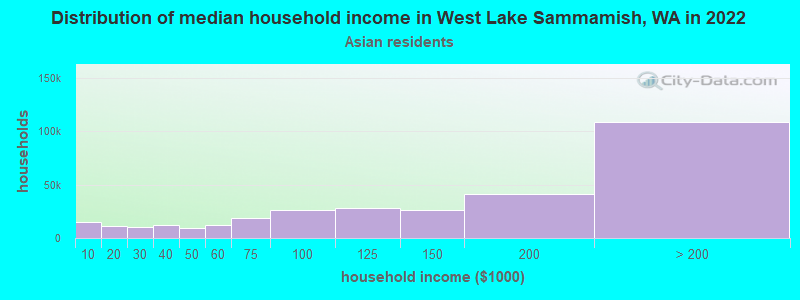
- over $200,000Asian householders
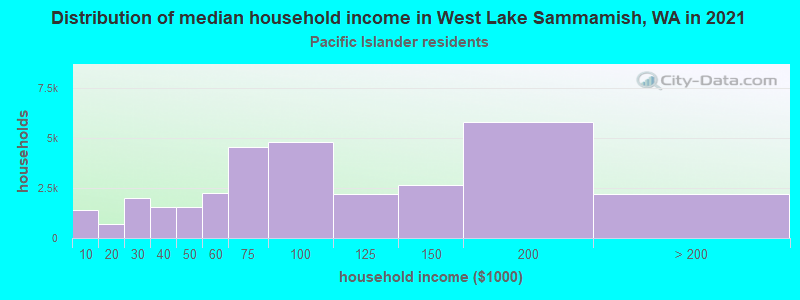
- $169,031Native Hawaiian and other Pacific Islander householders
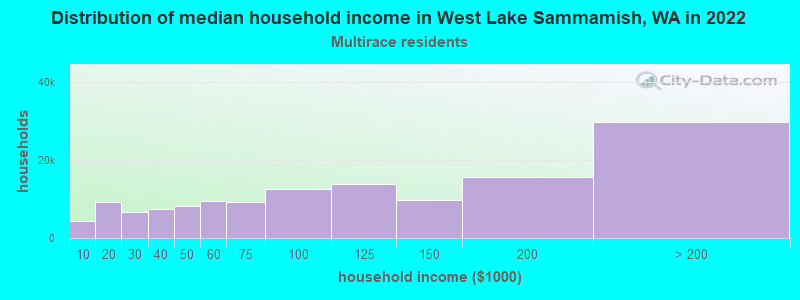
- $176,115Two or more races householders
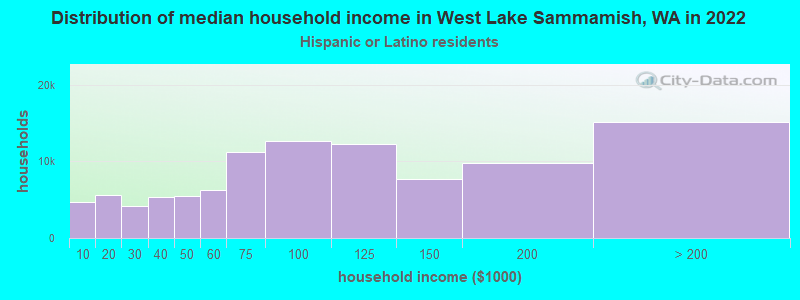
- $121,255Hispanic or Latino race householders
- Median 2022 house value
- over $1,000,000White Non-Hispanic householders
- $523,641American Indian or Alaska Native householders
- over $1,000,000Asian householders
- $714,056Native Hawaiian and other Pacific Islander householders
- $938,366Two or more races householders
- over $1,000,000Hispanic or Latino householders
Household income for White non-Hispanic householders
Household income for Black householders
Household income for American Indian and Alaska Native householders
Household income for Asian householders
Household income for Native Hawaiian and other Pacific Islander householders
Household income for Two or more races householders
Household income for Hispanic or Latino race householders
Foreign-born residents in West Lake Sammamish
845 residents are foreign born (7.5% Asia, 3.2% North America, 1.8% Europe).
| This city: | 14.2% |
| Washington: | 10.4% |
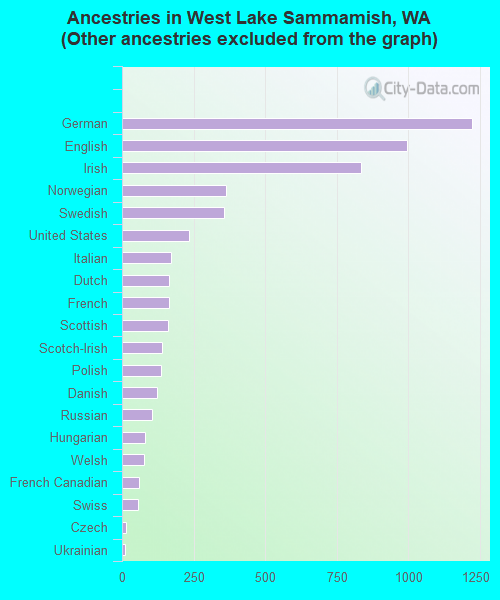
Ancestries in West Lake Sammamish

- 1,57722.4%Other
- 1,22017.3%German
- 99614.1%English
- 83411.8%Irish
- 3645.2%Norwegian
- 3555.0%Swedish
- 2353.3%United States
- 1712.4%Italian
- 1642.3%Dutch
- 1632.3%French
- 1602.3%Scottish
- 1382.0%Scotch-Irish
- 1351.9%Polish
- 1231.7%Danish
- 1041.5%Russian
- 791.1%Hungarian
- 781.1%Welsh
- 590.8%French Canadian
- 560.8%Swiss
- 130.2%Czech
- 120.2%Ukrainian
- 90.1%Subsaharan African
Zip codes: 98027.