Races in West Paterson, New Jersey (NJ) Detailed Stats
Ancestries, Foreign-born residents, place of birth

Recent posts about races in West Paterson, New Jersey on our local forum with over 2,400,000 registered users:
 | Did you move to NJ and love it? (71 replies) |
| Italian-American Towns in New Jersey (116 replies) |
| Paterson??? (104 replies) |
| Had the worst expeirence ever at Pathmark on Route 46 in West Paterson (91 replies) |
| Hawthorne vs. Fair Lawn (42 replies) |
| That Old New Jersey (9 replies) |
21.0% of West Paterson, NJ residents are foreign-born (10.9% born in Europe, 4.7% born in Asia, 4.6% born in Latin America), which is 9.3% less than the foreign-born rate of 23.0% across the entire state of New Jersey.
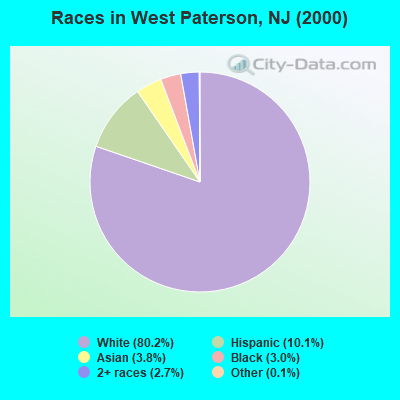
Race distribution in West Paterson

- 8,81480.2%White alone
- 1,10510.1%Hispanic
- 4193.8%Asian alone
- 3273.0%Black alone
- 2972.7%Two or more races
- 160.1%Other race alone
- 90.08%American Indian alone
2000
2022
-
- 5,557,20966.0%White alone
- 1,117,19113.3%Hispanic
- 1,096,17113.0%Black alone
- 477,0125.7%Asian alone
- 133,6891.6%Two or more races
- 19,5650.2%Other race alone
- 11,3380.1%American Indian alone
- 2,1750.03%Native Hawaiian and Other
Pacific Islander alone

-
- 4,766,47651.5%White alone
- 2,028,47021.9%Hispanic
- 1,111,63212.0%Black alone
- 923,54610.0%Asian alone
- 332,2373.6%Two or more races
- 89,8471.0%Other race alone
- 8,5570.09%American Indian alone
- 9340.01%Native Hawaiian and Other
Pacific Islander alone

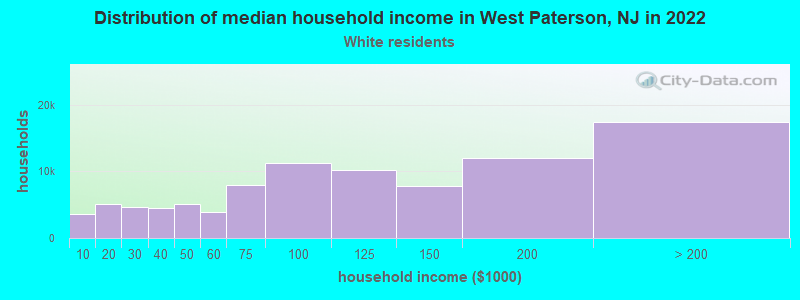
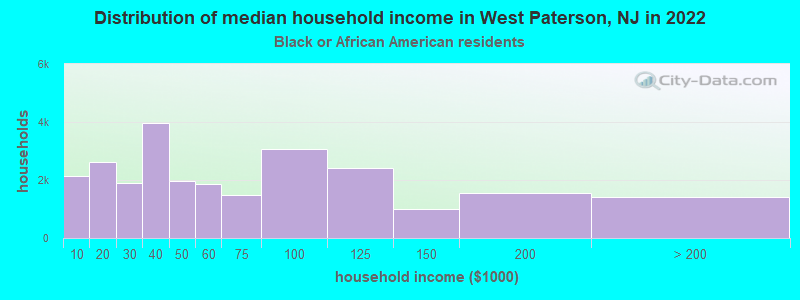
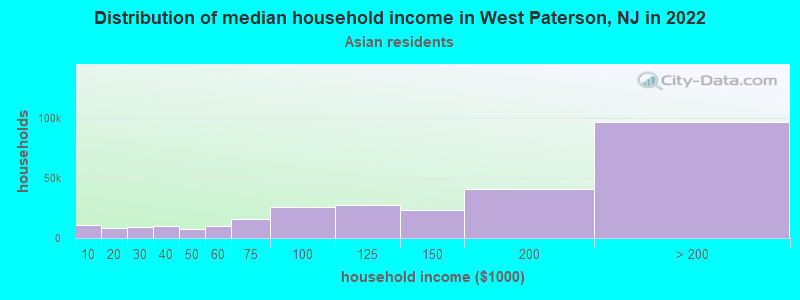
Income and house value in West Paterson
- Median household income in 2022
- $112,147White non-Hispanic householders
- $67,099Black householders
- $125,028Asian householders
- $104,789Some other race householders
- $69,647Two or more races householders
- $77,612Hispanic or Latino race householders
- Median 2022 house value
- $457,584White Non-Hispanic householders
- $381,125Black or African American householders
- $527,711Asian householders
- $405,048Some other race householders
- $382,532Two or more races householders
- $497,221Hispanic or Latino householders
Household income for White non-Hispanic householders
Household income for Black householders
Household income for Asian householders
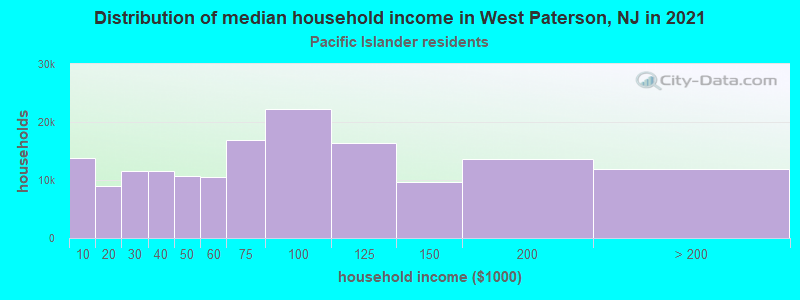
Household income for Native Hawaiian and other Pacific Islander householders
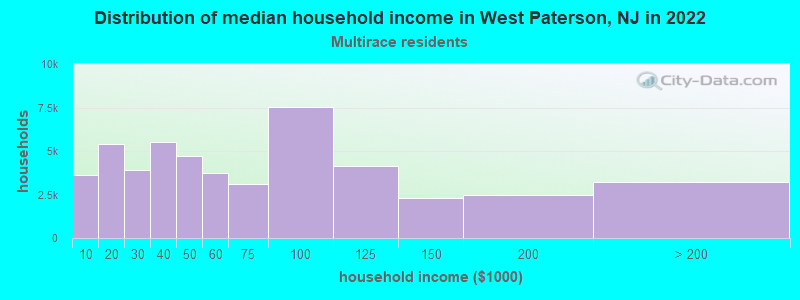
Household income for Two or more races householders
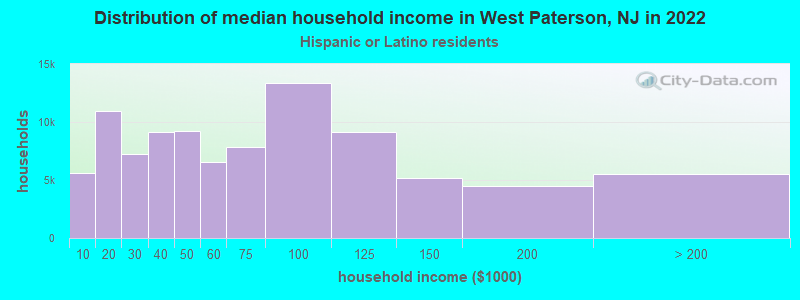
Household income for Hispanic or Latino race householders
Foreign-born residents in West Paterson
2,312 residents are foreign born (10.9% Europe, 4.7% Asia, 4.6% Latin America).
| This city: | 21.0% |
| New Jersey: | 17.5% |
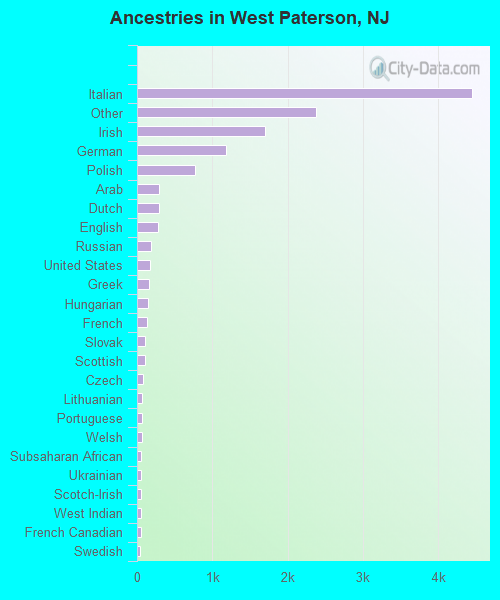
Ancestries in West Paterson

- 4,45234.3%Italian
- 2,37218.3%Other
- 1,69513.1%Irish
- 1,1839.1%German
- 7675.9%Polish
- 2982.3%Arab
- 2922.3%Dutch
- 2792.2%English
- 1851.4%Russian
- 1671.3%United States
- 1531.2%Greek
- 1441.1%Hungarian
- 1391.1%French
- 1060.8%Slovak
- 1050.8%Scottish
- 800.6%Czech
- 700.5%Lithuanian
- 690.5%Portuguese
- 610.5%Welsh
- 580.4%Subsaharan African
- 580.4%Ukrainian
- 540.4%Scotch-Irish
- 540.4%West Indian
- 470.4%French Canadian
- 460.4%Swedish
- 420.3%Swiss
Zip codes: 07424.