Races in West Perrine, Florida (FL) Detailed Stats
Data:
Races - White alone (%)
Races - White alone (% change since 2000)
Races - Black alone (%)
Races - Black alone (% change since 2000)
Races - American Indian alone (%)
Races - American Indian alone (% change since 2000)
Races - Asian alone (%)
Races - Asian alone (% change since 2000)
Races - Hispanic (%)
Races - Hispanic (% change since 2000)
Races - Native Hawaiian and Other Pacific Islander alone (%)
Races - Native Hawaiian and Other Pacific Islander alone (% change since 2000)
Races - Two or more races(%)
Races - Two or more races(% change since 2000)
Races - Other race alone (%)
Races - Other race alone (% change since 2000)
Racial diversity
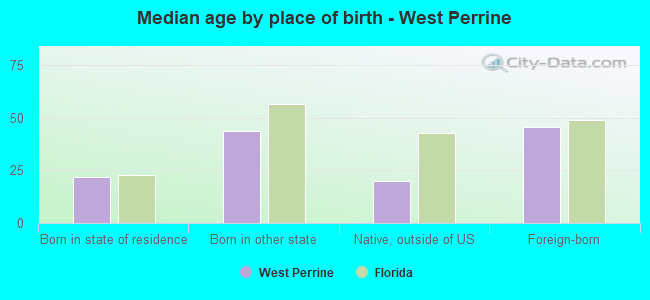
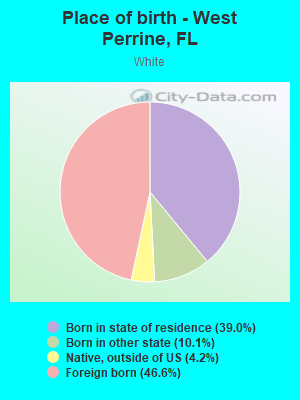
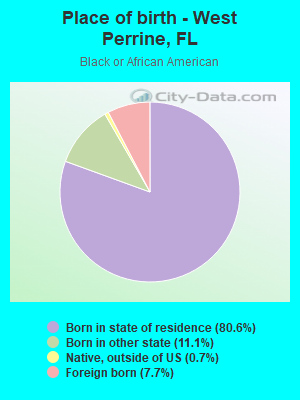
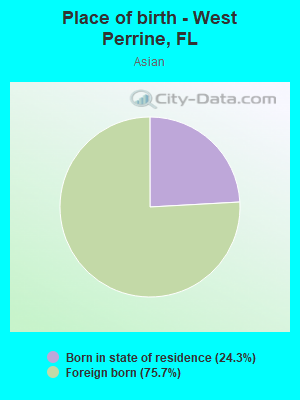
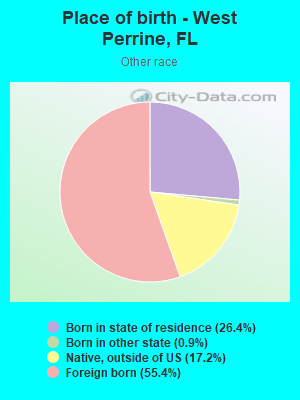
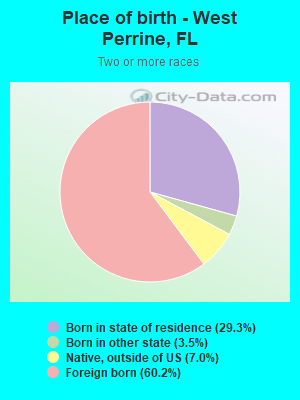
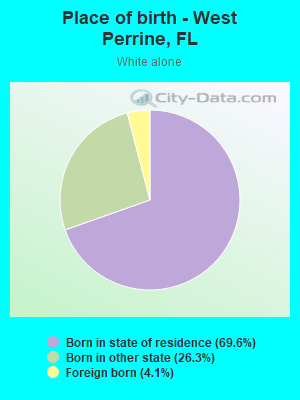
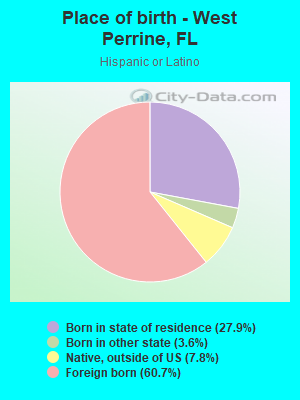
Place of birth - Born in state of residence (%)
Place of birth - Born in state of residence (%) - White
Place of birth - Born in state of residence (%) - Black or African American
Place of birth - Born in state of residence (%) - Asian
Place of birth - Born in state of residence (%) - Hispanic or Latino
Place of birth - Born in state of residence (%) - American Indian and Alaska Native
Place of birth - Born in state of residence (%) - Multirace
Place of birth - Born in state of residence (%) - Other Race
Place of birth - Born in other state (%)
Place of birth - Born in other state (%) - White
Place of birth - Born in other state (%) - Black or African American
Place of birth - Born in other state (%) - Asian
Place of birth - Born in other state (%) - Hispanic or Latino
Place of birth - Born in other state (%) - American Indian and Alaska Native
Place of birth - Born in other state (%) - Multirace
Place of birth - Born in other state (%) - Other Race
Place of birth - Native, outside of US (%)
Place of birth - Native, outside of US (%) - White
Place of birth - Native, outside of US (%) - Black or African American
Place of birth - Native, outside of US (%) - Asian
Place of birth - Native, outside of US (%) - Hispanic or Latino
Place of birth - Native, outside of US (%) - American Indian and Alaska Native
Place of birth - Native, outside of US (%) - Multirace
Place of birth - Native, outside of US (%) - Other Race
Place of birth - Foreign born (%)
Place of birth - Foreign born (%) - White
Place of birth - Foreign born (%) - Black or African American
Place of birth - Foreign born (%) - Asian
Place of birth - Foreign born (%) - Hispanic or Latino
Place of birth - Foreign born (%) - American Indian and Alaska Native
Place of birth - Foreign born (%) - Multirace
Place of birth - Foreign born (%) - Other Race
Residents speaking English at home (%)
Residents speaking English at home - Born in the United States (%)
Residents speaking English at home - Native, born elsewhere (%)
Residents speaking English at home - Foreign born (%)
Residents speaking Spanish at home (%)
Residents speaking Spanish at home - Born in the United States (%)
Residents speaking Spanish at home - Native, born elsewhere (%)
Residents speaking Spanish at home - Foreign born (%)
Residents speaking other language at home (%)
Residents speaking other language at home - Born in the United States (%)
Residents speaking other language at home - Native, born elsewhere (%)
Residents speaking other language at home - Foreign born (%)
Marital status - Never married (%)
Marital status - Now married (%)
Marital status - Separated (%)
Marital status - Widowed (%)
Marital status - Divorced (%)
Ancestries Reported - Arab (%)
Ancestries Reported - Czech (%)
Ancestries Reported - Danish (%)
Ancestries Reported - Dutch (%)
Ancestries Reported - English (%)
Ancestries Reported - French (%)
Ancestries Reported - French Canadian (%)
Ancestries Reported - German (%)
Ancestries Reported - Greek (%)
Ancestries Reported - Hungarian (%)
Ancestries Reported - Irish (%)
Ancestries Reported - Italian (%)
Ancestries Reported - Lithuanian (%)
Ancestries Reported - Norwegian (%)
Ancestries Reported - Polish (%)
Ancestries Reported - Portuguese (%)
Ancestries Reported - Russian (%)
Ancestries Reported - Scotch-Irish (%)
Ancestries Reported - Scottish (%)
Ancestries Reported - Slovak (%)
Ancestries Reported - Subsaharan African (%)
Ancestries Reported - Swedish (%)
Ancestries Reported - Swiss (%)
Ancestries Reported - Ukrainian (%)
Ancestries Reported - United States (%)
Ancestries Reported - Welsh (%)
Ancestries Reported - West Indian (%)
Ancestries Reported - Other (%)
Geographical mobility - Same house 1 year ago (%)
Geographical mobility - Same house 1 year ago (%) - White
Geographical mobility - Same house 1 year ago (%) - Black or African American
Geographical mobility - Same house 1 year ago (%) - Asian
Geographical mobility - Same house 1 year ago (%) - Hispanic or Latino
Geographical mobility - Same house 1 year ago (%) - American Indian and Alaska Native
Geographical mobility - Same house 1 year ago (%) - Multirace
Geographical mobility - Same house 1 year ago (%) - Other Race
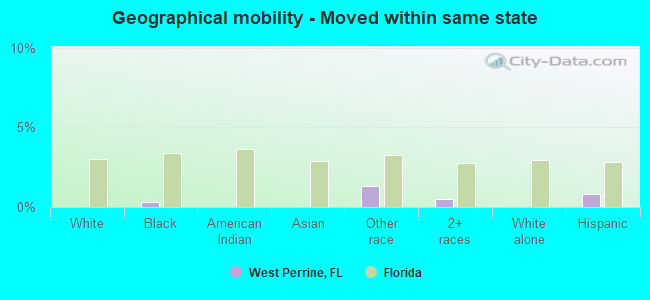
Geographical mobility - Moved within same county (%)
Geographical mobility - Moved within same county (%) - White
Geographical mobility - Moved within same county (%) - Black or African American
Geographical mobility - Moved within same county (%) - Asian
Geographical mobility - Moved within same county (%) - Hispanic or Latino
Geographical mobility - Moved within same county (%) - American Indian and Alaska Native
Geographical mobility - Moved within same county (%) - Multirace
Geographical mobility - Moved within same county (%) - Other Race
Geographical mobility - Moved from different county within same state (%)
Geographical mobility - Moved from different county within same state (%) - White
Geographical mobility - Moved from different county within same state (%) - Black or African American
Geographical mobility - Moved from different county within same state (%) - Asian
Geographical mobility - Moved from different county within same state (%) - Hispanic or Latino
Geographical mobility - Moved from different county within same state (%) - American Indian and Alaska Native
Geographical mobility - Moved from different county within same state (%) - Multirace
Geographical mobility - Moved from different county within same state (%) - Other Race
Geographical mobility - Moved from different state (%)
Geographical mobility - Moved from different state (%) - White
Geographical mobility - Moved from different state (%) - Black or African American
Geographical mobility - Moved from different state (%) - Asian
Geographical mobility - Moved from different state (%) - Hispanic or Latino
Geographical mobility - Moved from different state (%) - American Indian and Alaska Native
Geographical mobility - Moved from different state (%) - Multirace
Geographical mobility - Moved from different state (%) - Other Race
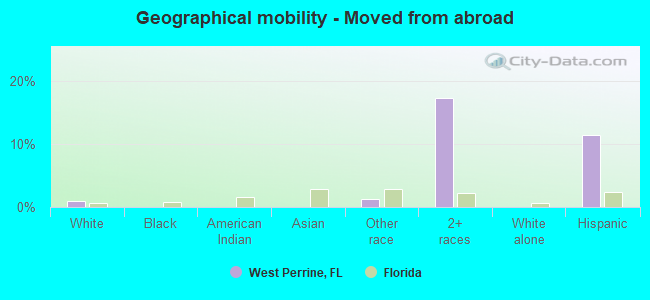
Geographical mobility - Moved from abroad (%)
Geographical mobility - Moved from abroad (%) - White
Geographical mobility - Moved from abroad (%) - Black or African American
Geographical mobility - Moved from abroad (%) - Asian
Geographical mobility - Moved from abroad (%) - Hispanic or Latino
Geographical mobility - Moved from abroad (%) - American Indian and Alaska Native
Geographical mobility - Moved from abroad (%) - Multirace
Geographical mobility - Moved from abroad (%) - Other Race
Place of birth for the foreign-born population - Ireland (%)
Place of birth for the foreign-born population - Denmark (%)
Place of birth for the foreign-born population - Norway (%)
Place of birth for the foreign-born population - Sweden (%)
Place of birth for the foreign-born population - United Kingdom (%)
Place of birth for the foreign-born population - England (%)
Place of birth for the foreign-born population - Scotland (%)
Place of birth for the foreign-born population - Other Northern Europe (%)
Place of birth for the foreign-born population - Austria (%)
Place of birth for the foreign-born population - Belgium (%)
Place of birth for the foreign-born population - France (%)
Place of birth for the foreign-born population - Germany (%)
Place of birth for the foreign-born population - Netherlands (%)
Place of birth for the foreign-born population - Switzerland (%)
Place of birth for the foreign-born population - Other Western Europe (%)
Place of birth for the foreign-born population - Greece (%)
Place of birth for the foreign-born population - Italy (%)
Place of birth for the foreign-born population - Portugal (%)
Place of birth for the foreign-born population - Spain (%)
Place of birth for the foreign-born population - Other Southern Europe (%)
Place of birth for the foreign-born population - Albania (%)
Place of birth for the foreign-born population - Belarus (%)
Place of birth for the foreign-born population - Bosnia and Herzegovina (%)
Place of birth for the foreign-born population - Bulgaria (%)
Place of birth for the foreign-born population - Croatia (%)
Place of birth for the foreign-born population - Czechoslovakia (%)
Place of birth for the foreign-born population - Hungary (%)
Place of birth for the foreign-born population - Latvia (%)
Place of birth for the foreign-born population - Lithuania (%)
Place of birth for the foreign-born population - North Macedonia (Macedonia) (%)
Place of birth for the foreign-born population - Moldova (%)
Place of birth for the foreign-born population - Poland (%)
Place of birth for the foreign-born population - Romania (%)
Place of birth for the foreign-born population - Russia (%)
Place of birth for the foreign-born population - Serbia (%)
Place of birth for the foreign-born population - Ukraine (%)
Place of birth for the foreign-born population - Other Eastern Europe (%)
Place of birth for the foreign-born population - China (%)
Place of birth for the foreign-born population - Hong Kong (%)
Place of birth for the foreign-born population - Taiwan (%)
Place of birth for the foreign-born population - Japan (%)
Place of birth for the foreign-born population - Korea (%)
Place of birth for the foreign-born population - Other Eastern Asia (%)
Place of birth for the foreign-born population - Afghanistan (%)
Place of birth for the foreign-born population - Bangladesh (%)
Place of birth for the foreign-born population - India (%)
Place of birth for the foreign-born population - Iran (%)
Place of birth for the foreign-born population - Kazakhstan (%)
Place of birth for the foreign-born population - Nepal (%)
Place of birth for the foreign-born population - Pakistan (%)
Place of birth for the foreign-born population - Sri Lanka (%)
Place of birth for the foreign-born population - Uzbekistan (%)
Place of birth for the foreign-born population - Other South Central Asia (%)
Place of birth for the foreign-born population - Burma (%)
Place of birth for the foreign-born population - Cambodia (%)
Place of birth for the foreign-born population - Indonesia (%)
Place of birth for the foreign-born population - Laos (%)
Place of birth for the foreign-born population - Malaysia (%)
Place of birth for the foreign-born population - Philippines (%)
Place of birth for the foreign-born population - Singapore (%)
Place of birth for the foreign-born population - Thailand (%)
Place of birth for the foreign-born population - Vietnam (%)
Place of birth for the foreign-born population - Other South Eastern Asia (%)
Place of birth for the foreign-born population - Armenia (%)
Place of birth for the foreign-born population - Iraq (%)
Place of birth for the foreign-born population - Israel (%)
Place of birth for the foreign-born population - Jordan (%)
Place of birth for the foreign-born population - Kuwait (%)
Place of birth for the foreign-born population - Lebanon (%)
Place of birth for the foreign-born population - Saudi Arabia (%)
Place of birth for the foreign-born population - Syria (%)
Place of birth for the foreign-born population - Turkey (%)
Place of birth for the foreign-born population - Yemen (%)
Place of birth for the foreign-born population - Other Western Asia (%)
Place of birth for the foreign-born population - Eritrea (%)
Place of birth for the foreign-born population - Ethiopia (%)
Place of birth for the foreign-born population - Kenya (%)
Place of birth for the foreign-born population - Somalia (%)
Place of birth for the foreign-born population - Uganda (%)
Place of birth for the foreign-born population - Zimbabwe (%)
Place of birth for the foreign-born population - Other Eastern Africa (%)
Place of birth for the foreign-born population - Cameroon (%)
Place of birth for the foreign-born population - Congo (%)
Place of birth for the foreign-born population - Democratic Republic of Congo (Zaire) (%)
Place of birth for the foreign-born population - Other Middle Africa (%)
Place of birth for the foreign-born population - Egypt (%)
Place of birth for the foreign-born population - Morocco (%)
Place of birth for the foreign-born population - Sudan (%)
Place of birth for the foreign-born population - Other Northern Africa (%)
Place of birth for the foreign-born population - South Africa (%)
Place of birth for the foreign-born population - Other Southern Africa (%)
Place of birth for the foreign-born population - Cabo Verde (%)
Place of birth for the foreign-born population - Ghana (%)
Place of birth for the foreign-born population - Liberia (%)
Place of birth for the foreign-born population - Nigeria (%)
Place of birth for the foreign-born population - Senegal (%)
Place of birth for the foreign-born population - Sierra Leone (%)
Place of birth for the foreign-born population - Other Western Africa (%)
Place of birth for the foreign-born population - Australia (%)
Place of birth for the foreign-born population - New Zealand (%)
Place of birth for the foreign-born population - Fiji (%)
Place of birth for the foreign-born population - Micronesia (%)
Place of birth for the foreign-born population - Bahamas (%)
Place of birth for the foreign-born population - Barbados (%)
Place of birth for the foreign-born population - Cuba (%)
Place of birth for the foreign-born population - Dominica (%)
Place of birth for the foreign-born population - Dominican Republic (%)
Place of birth for the foreign-born population - Grenada (%)
Place of birth for the foreign-born population - Haiti (%)
Place of birth for the foreign-born population - Jamaica (%)
Place of birth for the foreign-born population - St. Vincent and the Grenadines (%)
Place of birth for the foreign-born population - Trinidad and Tobago (%)
Place of birth for the foreign-born population - West Indies (%)
Place of birth for the foreign-born population - Other Caribbean (%)
Place of birth for the foreign-born population - Belize (%)
Place of birth for the foreign-born population - Costa Rica (%)
Place of birth for the foreign-born population - El Salvador (%)
Place of birth for the foreign-born population - Guatemala (%)
Place of birth for the foreign-born population - Honduras (%)
Place of birth for the foreign-born population - Mexico (%)
Place of birth for the foreign-born population - Nicaragua (%)
Place of birth for the foreign-born population - Panama (%)
Place of birth for the foreign-born population - Other Central America (%)
Place of birth for the foreign-born population - Argentina (%)
Place of birth for the foreign-born population - Bolivia (%)
Place of birth for the foreign-born population - Brazil (%)
Place of birth for the foreign-born population - Chile (%)
Place of birth for the foreign-born population - Colombia (%)
Place of birth for the foreign-born population - Ecuador (%)
Place of birth for the foreign-born population - Guyana (%)
Place of birth for the foreign-born population - Peru (%)
Place of birth for the foreign-born population - Uruguay (%)
Place of birth for the foreign-born population - Venezuela (%)
Place of birth for the foreign-born population - Other South America (%)
Place of birth for the foreign-born population - Canada (%)
Place of birth for the foreign-born population - Other Northern America (%)
Place of birth for the foreign-born population - Other (%)
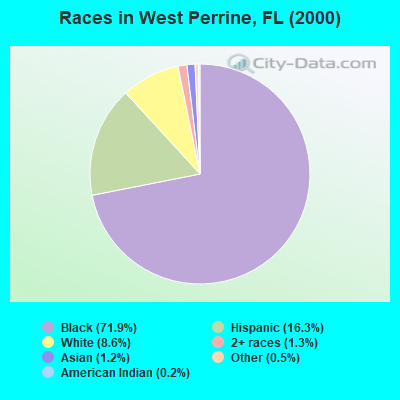
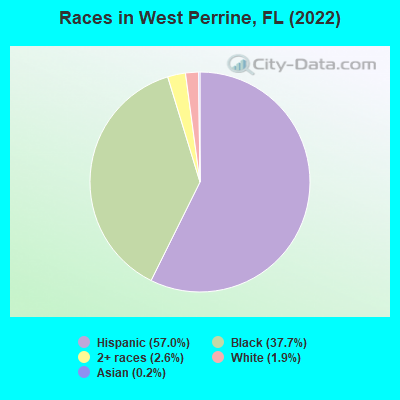
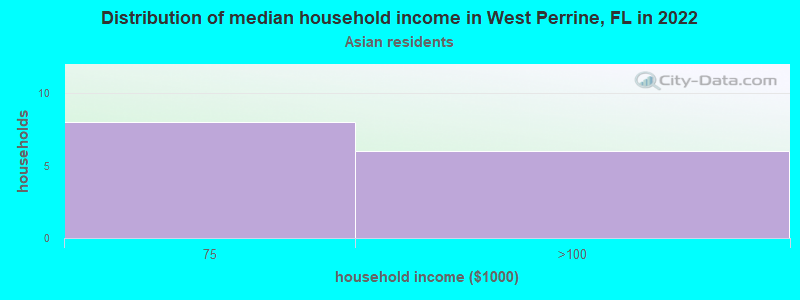
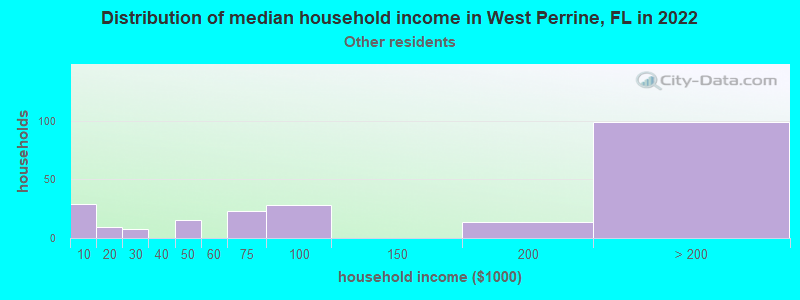
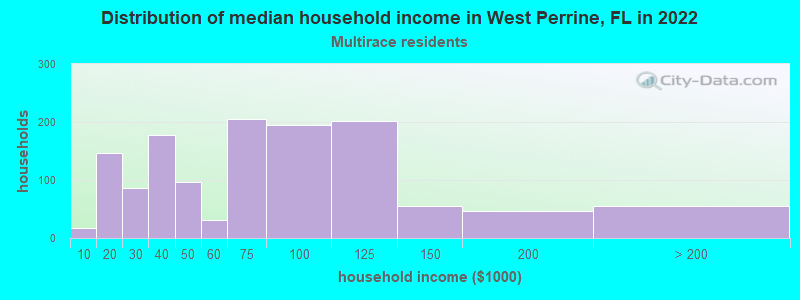
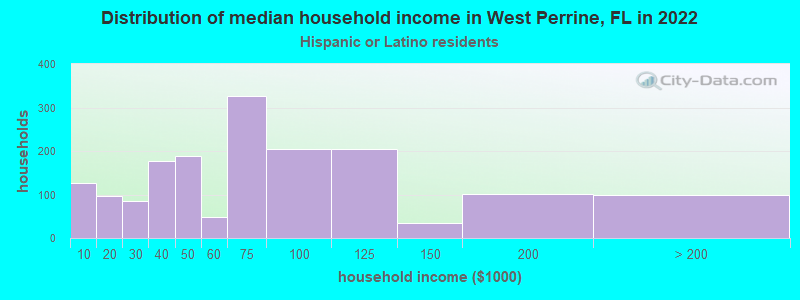
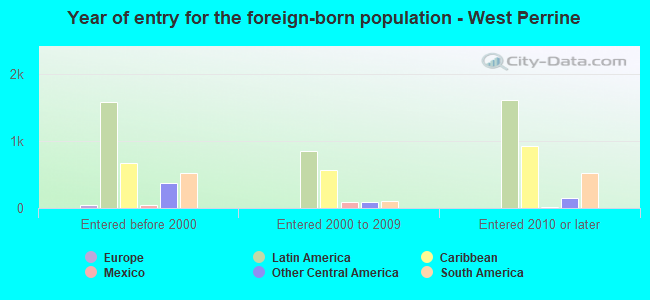
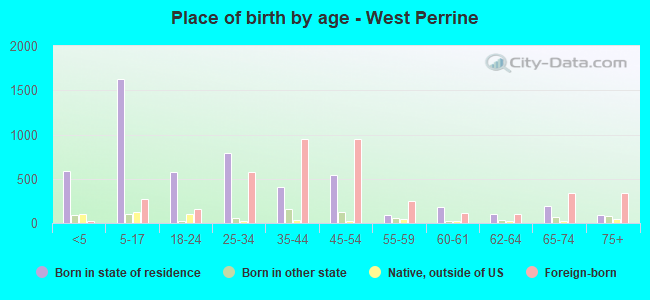
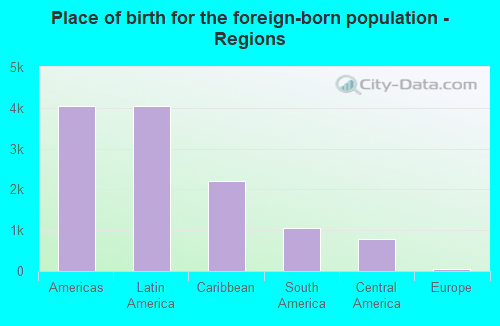
According to 2022 data, the most numerous races in West Perrine, FL are White alone (196 residents), Hispanic (6,009 residents), and Black alone (3,978 residents). 43.8% of West Perrine residents speak English at home. 38.8% of West Perrine, FL residents are foreign-born (38.1% born in Latin America), which is 45.9% greater than the foreign-born rate of 21.0% across the entire state of Florida.
Race distribution in West Perrine
2000 2022
10,458,509 65.4% White alone 2,682,715 16.8% Hispanic 2,264,268 14.2% Black alone 261,693 1.6% Asian alone 236,954 1.5% Two or more races 42,358 0.3% American Indian alone 28,994 0.2% Other race alone 6,887 0.04% Native Hawaiian and Other
11,309,403 50.8% White alone 6,025,039 27.1% Hispanic 3,241,015 14.6% Black alone 861,630 3.9% Two or more races 623,692 2.8% Asian alone 152,054 0.7% Other race alone 22,504 0.1% American Indian alone 9,486 0.04% Native Hawaiian and Other
Income and house value in West Perrine Median household income in 2022 $44,176 Black householders$65,730 Two or more races householders$71,943 Hispanic or Latino race householdersMedian 2022 house value $388,571 White Non-Hispanic householders$389,845 Black or African American householders $487,519 Asian householders$222,950 Some other race householders$384,324 Two or more races householders$387,722 Hispanic or Latino householders
Median age by race in West Perrine
28.5 Median age for White residents28.5 28.5 32.0 Median age for Black or African American residents28.6 32.3 -653,446,647.1 Median age for American Indian / Alaska Native residents-543,352,600.6 -762,696,213.5 61.9 Median age for Asian residents-697,674,417.9 60.6 -679,849,340.2 Median age for Native Hawaiian / Pacific Islander residents-858,307,848.3 -443,298,968.6 33.0 Median age for Other race residents32.9 44.6 37.9 Median age for Two or more races residents36.9 39.4 45.9 Median age for White alone residents19.9 69.8 35.6 Median age for Hispanic or Latino residents32.6 36.4
Owner/renter occupied households by race in West Perrine
House owners and renters - White residents 243 49.6% Owner occupied247 50.4% Renter occupiedHouse owners and renters - Black or African American residents 559 44.0% Owner occupied712 56.0% Renter occupiedHouse owners and renters - Asian residents 4 36.8% Owner occupied7 63.2% Renter occupiedHouse owners and renters - Other race residents 141 68.8% Owner occupied64 31.2% Renter occupiedHouse owners and renters - Two or more races residents 681 51.6% Owner occupied639 48.4% Renter occupiedHouse owners and renters - White alone residents 55 78.5% Owner occupied15 21.5% Renter occupiedHouse owners and renters - Hispanic or Latino residents 791 47.1% Owner occupied888 52.9% Renter occupied
Language usage in West Perrine
English speakers - Total 43.8% of residents of West Perrine speak English at home.
55.1% of residents speak Spanish at home 2,723 50.7% Speak English very well2,653 49.3% Speak English less than very well1.2% of residents speak other language at home 69 61.1% Speak English very well44 38.9% Speak English less than very well
English speakers - Born in the United States 71.7% of residents of West Perrine speak English at home.
26.8% of residents speak Spanish at home 176 95.1% Speak English very well9 4.9% Speak English less than very well0.9% of residents speak other language at home 6 100.0% Speak English very well
English speakers - Native, born elsewhere 0.0% of residents of West Perrine speak English at home.
94.5% of residents speak Spanish at home 249 69.0% Speak English very well112 31.0% Speak English less than very well
English speakers - Foreign-born 12.6% of residents of West Perrine speak English at home.
85.8% of residents speak Spanish at home 1,030 29.4% Speak English very well2,474 70.6% Speak English less than very well2.0% of residents speak other language at home 40 48.2% Speak English very well43 51.8% Speak English less than very well
White (Caucasian) - Speak only English Native:
21.2% (156)Foreign-born:
2.6% (18)
White (Caucasian) - Speak another language Native:
67.0% (492)Foreign-born:
94.8% (661)
Black or African American - Speak only English Native:
95.6% (3,124)Foreign-born:
73.0% (216)
Black or African American - Speak another language Native:
4.4% (143)Foreign-born:
31.6% (94)
Asian - Speak only English Native:
100.0% (6)Foreign-born:
86.8% (13)
Other race - Speak only English Native:
45.8% (174)Foreign-born:
27.3% (157)
Other race - Speak another language Native:
54.5% (207)Foreign-born:
72.2% (415)
Two or more races - Speak only English Native:
14.9% (221)Foreign-born:
8.3% (222)
Two or more races - Speak another language Native:
85.2% (1,264)Foreign-born:
92.2% (2,468)
White alone - Speak another language Native:
31.3% (48)Foreign-born:
93.5% (7)
Hispanic or Latino - Speak only English Native:
14.9% (300)Foreign-born:
5.9% (215)
Hispanic or Latino - Speak another language Native:
85.0% (1,714)Foreign-born:
94.2% (3,437)
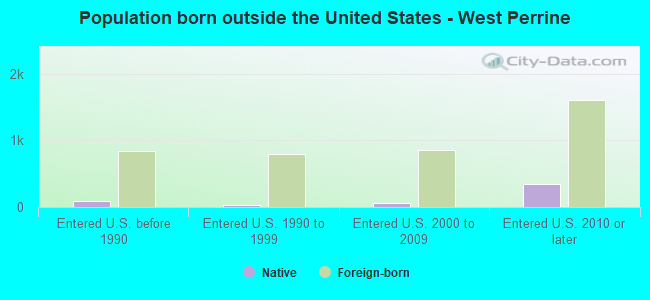
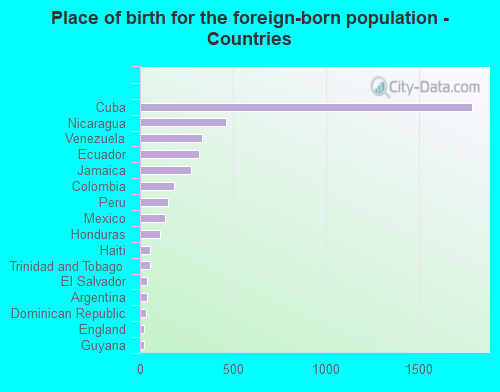
Foreign-born residents in West Perrine 4,089 residents are foreign born (38.1% Latin America ).
This city:
38.8%Florida:
21.1%
Marital status for residents in West Perrine Marital status - White (Caucasian) population 15 years and over
Males 34.5% Never married54.6% Now married1.3% Separated2.8% Widowed6.7% DivorcedFemales 54.1% Never married30.1% Now married0.6% Separated4.4% Widowed10.7% DivorcedWomen who gave birth in the past 12 months Now married:
100.0% (4)Unmarried:
0.0% (0)
Women who did not give birth in the past 12 months Now married:
27.3% (169)Unmarried:
72.7% (450)
Marital status - Black or African American population 15 years and over
Males 46.6% Never married37.1% Now married0.2% Separated0.5% Widowed15.6% DivorcedFemales 60.3% Never married15.5% Now married1.3% Separated9.5% Widowed13.4% DivorcedWomen who gave birth in the past 12 months Now married:
0.0% (0)Unmarried:
100.0% (27)
Women who did not give birth in the past 12 months Now married:
11.4% (115)Unmarried:
88.6% (897)
Marital status - Asian population 15 years and over
Males 0.0% Never married100.0% Now married0.0% Separated0.0% Widowed0.0% DivorcedFemales 75.0% Never married25.0% Now married0.0% Separated0.0% Widowed0.0% DivorcedWomen who did not give birth in the past 12 months Now married:
0.0% (0)Unmarried:
100.0% (5)
Marital status - Other race population 15 years and over
Males 25.1% Never married53.2% Now married0.0% Separated0.0% Widowed21.7% DivorcedFemales 46.9% Never married28.5% Now married0.0% Separated19.5% Widowed5.1% DivorcedWomen who did not give birth in the past 12 months Now married:
39.3% (125)Unmarried:
60.7% (194)
Marital status - Two or more races population 15 years and over
Males 44.9% Never married44.1% Now married5.7% Separated0.7% Widowed4.7% DivorcedFemales 39.4% Never married37.6% Now married2.3% Separated8.9% Widowed11.8% DivorcedWomen who did not give birth in the past 12 months Now married:
40.1% (414)Unmarried:
59.9% (619)
Marital status - White alone, not Hispanic / Latino population 15 years and over
Males 38.0% Never married50.0% Now married0.0% Separated0.0% Widowed12.0% DivorcedFemales 3.4% Never married50.0% Now married0.0% Separated46.6% Widowed0.0% DivorcedWomen who did not give birth in the past 12 months Now married:
100.0% (4)Unmarried:
0.0% (0)
Marital status - Hispanic or Latino population 15 years and over
Males 40.2% Never married48.3% Now married3.5% Separated1.5% Widowed6.6% DivorcedFemales 49.6% Never married32.3% Now married1.2% Separated6.4% Widowed10.5% DivorcedWomen who gave birth in the past 12 months Now married:
100.0% (8)Unmarried:
0.0% (0)
Women who did not give birth in the past 12 months Now married:
33.0% (636)Unmarried:
67.0% (1,292)
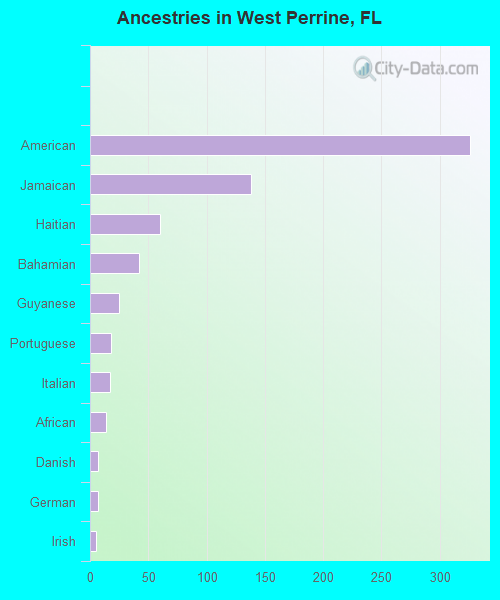
Ancestries in West Perrine
326 4.5% American138 1.9% Jamaican60 0.8% Haitian42 0.6% Bahamian25 0.3% Guyanese18 0.3% Portuguese17 0.2% Italian14 0.2% African7 0.10% Danish7 0.10% German5 0.07% Irish
Children Nativity (place of birth) in West Perrine
Children under 6 years - Living with two parents Both parents foreign-born 50 50.8% Native49 49.2% Foreign-bornOne native, one foreign-born parent 79 100.0% NativeChildren under 6 years - Living with one parent Native parent 484 100.0% NativeForeign-born parent 177 100.0% NativeChildren 6 to 17 years - Living with two parents Both parents native 295 98.9% Native3 1.1% Foreign-bornBoth parents foreign-born 151 52.5% Native137 47.5% Foreign-bornOne native, one foreign-born parent 25 100.0% NativeChildren 6 to 17 years - Living with one parent Native parent 828 100.0% NativeForeign-born parent 464 55.1% Native378 44.9% Foreign-born
Grandparents responsible for own grandchildren in West Perrine
Grandparents (30 to 59 years) Black or African American 49 48.5% Responsible for grandchildren52 51.5% Not responsible for grandchildrenOther race 151 100.0% Not responsible for grandchildrenTwo or more races 32 100.0% Not responsible for grandchildrenHispanic or Latino 123 100.0% Not responsible for grandchildrenGrandparents (60 years and over) Black or African American 47 100.0% Not responsible for grandchildrenTwo or more races 69 100.0% Not responsible for grandchildrenHispanic or Latino 10 22.2% Responsible for grandchildren36 77.8% Not responsible for grandchildren