Races in West Reading, Pennsylvania (PA) Detailed Stats
Ancestries, Foreign-born residents, place of birth
Settings
X


Recent posts about races in West Reading, Pennsylvania on our local forum with over 2,400,000 registered users:
 | Other than Pittsburgh and Philadelphia what is your favorite smaller city in Pennsylvania? (44 replies) |
| Living in West Reading? (Single, 30s F) (12 replies) |
| Berks County (Reading) (13 replies) |
| Help narrowing down housing search for garden-friendly home <1hr from NW Philly (8 replies) |
| Where to live halfway between Philly and Reading (24 replies) |
| Moving to Reading (21 replies) |
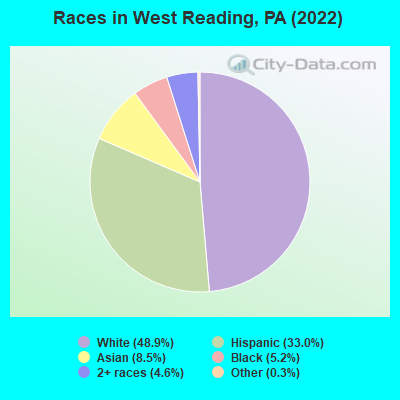
According to 2022 data, the most numerous races in West Reading, PA are White alone (2,228 residents), Black alone (235 residents), and Hispanic (1,501 residents). 66.7% of West Reading residents speak English at home. 7.3% of West Reading, PA residents are foreign-born (3.9% born in Asia, 2.7% born in Latin America), which is 4.6% greater than the foreign-born rate of 7.0% across the entire state of Pennsylvania.
Race distribution in West Reading
2000
2022

- 3,46385.5%White alone
- 3157.8%Hispanic
- 1553.8%Black alone
- 621.5%Asian alone
- 441.1%Two or more races
- 50.1%Other race alone
- 40.10%American Indian alone
- 10.02%Native Hawaiian and Other
Pacific Islander alone

-
- 2,22848.9%White alone
- 1,50133.0%Hispanic
- 3878.5%Asian alone
- 2355.2%Black alone
- 2084.6%Two or more races
- 140.3%Other race alone
2000
2022
-
- 10,322,45584.1%White alone
- 1,202,4379.8%Black alone
- 394,0883.2%Hispanic
- 218,2961.8%Asian alone
- 113,0970.9%Two or more races
- 13,0860.1%Other race alone
- 14,9040.1%American Indian alone
- 2,6910.02%Native Hawaiian and Other
Pacific Islander alone

-
- 9,487,22873.1%White alone
- 1,311,58110.1%Black alone
- 1,115,9978.6%Hispanic
- 493,9423.8%Two or more races
- 487,1243.8%Asian alone
- 63,5820.5%Other race alone
- 10,1300.08%American Indian alone
- 2,4240.02%Native Hawaiian and Other
Pacific Islander alone

Income and house value in West Reading
- Median household income in 2022
- $57,789White non-Hispanic householders
- $53,780Asian householders
- $89,185Some other race householders
- $79,907Hispanic or Latino race householders
- Median 2022 house value
- $168,094White Non-Hispanic householders
- $150,705Black or African American householders
- $260,836American Indian or Alaska Native householders
- $173,891Some other race householders
- $318,800Two or more races householders
- $161,139Hispanic or Latino householders
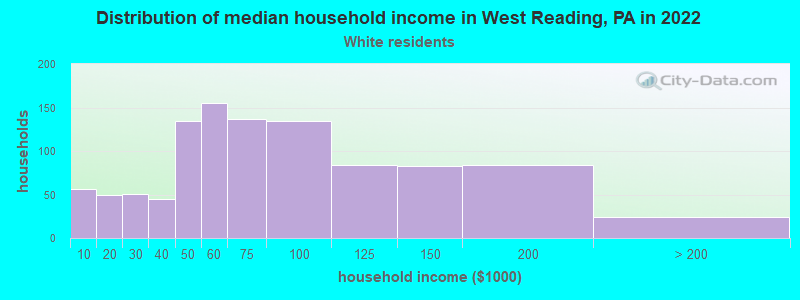
Household income for White non-Hispanic householders
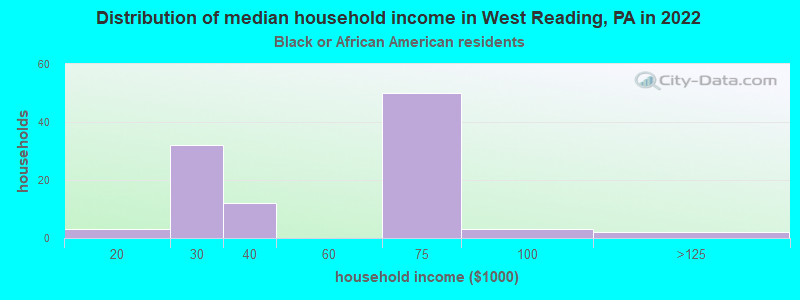
Household income for Black householders
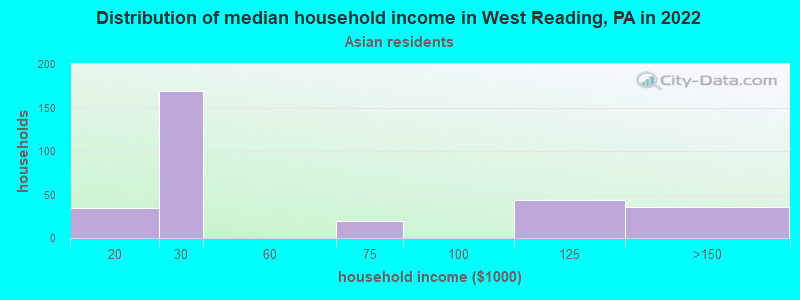
Household income for Asian householders
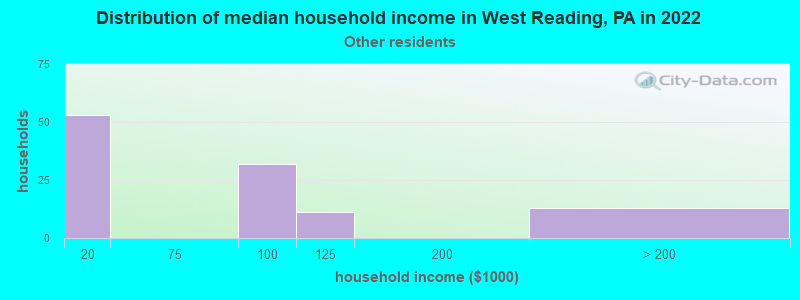
Household income for Some other race householders
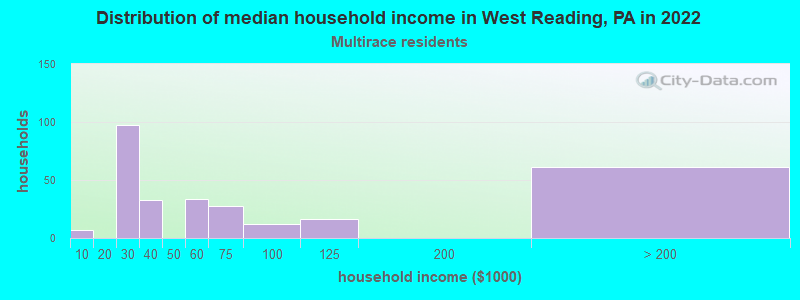
Household income for Two or more races householders
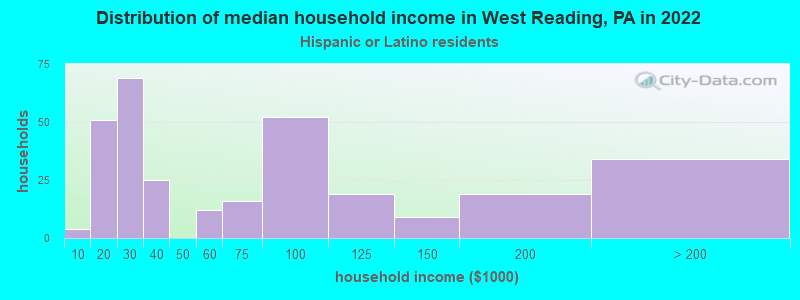
Household income for Hispanic or Latino race householders
Median age by race in West Reading
- 36.7Median age for White residents
- 41.3Males
- 36.0Females
- 55.1Median age for Black or African American residents
- 48.2Males
- 63.3Females
- -773,162,938.5Median age for American Indian / Alaska Native residents
- -720,909,885.5Males
- -663,507,108.3Females
- 43.3Median age for Asian residents
- 53.3Males
- 42.9Females
- -680,432,644.4Median age for Native Hawaiian / Pacific Islander residents
- -649,523,808.9Males
- -747,474,746.7Females
- 26.1Median age for Other race residents
- 32.2Males
- 22.2Females
- 19.8Median age for Two or more races residents
- 15.7Males
- 26.2Females
- 39.7Median age for White alone residents
- 39.6Males
- 39.7Females
- 22.7Median age for Hispanic or Latino residents
- 31.9Males
- 22.6Females
Owner/renter occupied households by race in West Reading
- House owners and renters - White residents
- 64563.4%Owner occupied
- 37236.6%Renter occupied
- House owners and renters - Black or African American residents
- 4045.5%Owner occupied
- 4854.5%Renter occupied
- House owners and renters - American Indian / Alaska Native residents
- 17100.0%Owner occupied
- House owners and renters - Asian residents
- 7523.2%Owner occupied
- 24776.8%Renter occupied
- House owners and renters - Other race residents
- 5168.5%Owner occupied
- 2331.5%Renter occupied
- House owners and renters - Two or more races residents
- 5919.3%Owner occupied
- 24780.7%Renter occupied
- House owners and renters - White alone residents
- 62562.7%Owner occupied
- 37237.3%Renter occupied
- House owners and renters - Hispanic or Latino residents
- 13242.4%Owner occupied
- 17957.6%Renter occupied
Language usage in West Reading
- English speakers - Total
- 66.7% of residents of West Reading speak English at home.
- 22.6% of residents speak Spanish at home
- 74976.4%Speak English very well
- 23123.6%Speak English less than very well
- 11.6% of residents speak other language at home
- 44288.0%Speak English very well
- 6012.0%Speak English less than very well
- English speakers - Born in the United States
- 59.4% of residents of West Reading speak English at home.
- 19.0% of residents speak Spanish at home
- 166100.0%Speak English very well
- 17.8% of residents speak other language at home
- 156100.0%Speak English very well
- English speakers - Native, born elsewhere
- 13.8% of residents of West Reading speak English at home.
- 88.7% of residents speak Spanish at home
- 6033.3%Speak English very well
- 12066.7%Speak English less than very well
- English speakers - Foreign-born
- 19.7% of residents of West Reading speak English at home.
- 38.3% of residents speak Spanish at home
- 5741.3%Speak English very well
- 8158.7%Speak English less than very well
- 32.8% of residents speak other language at home
- 6857.6%Speak English very well
- 5042.4%Speak English less than very well
White (Caucasian) - Speak only English
| Native: | 82.9% (2,194) |
| Foreign-born: | 100.0% (15) |
White (Caucasian) - Speak another language
| Native: | 14.2% (375) |
| Foreign-born: | 29.8% (4) |
Black or African American - Speak another language
| Native: | 2.4% (6) |
| Foreign-born: | 90.4% (8) |
Asian - Speak only English
| Native: | 0.9% (2) |
| Foreign-born: | 19.9% (40) |
Asian - Speak another language
| Native: | 100.0% (275) |
| Foreign-born: | 72.4% (145) |
Other race - Speak another language
| Native: | 51.4% (75) |
| Foreign-born: | 100.0% (51) |
Two or more races - Speak another language
| Native: | 59.6% (494) |
| Foreign-born: | 100.0% (75) |
White alone - Speak only English
| Native: | 95.6% (2,035) |
| Foreign-born: | 97.4% (17) |
White alone - Speak another language
| Native: | 4.9% (105) |
| Foreign-born: | 18.7% (3) |
Hispanic or Latino - Speak another language
| Native: | 67.9% (851) |
| Foreign-born: | 100.0% (132) |
Foreign-born residents in West Reading
334 residents are foreign born (3.9% Asia, 2.7% Latin America).
| This city: | 7.3% |
| Pennsylvania: | 7.3% |


Marital status for residents in West Reading
Marital status - White (Caucasian) population 15 years and over
- Males
- 45.6%Never married
- 25.0%Now married
- 4.9%Separated
- 5.0%Widowed
- 19.5%Divorced
- Females
- 38.4%Never married
- 39.0%Now married
- 1.2%Separated
- 7.3%Widowed
- 14.2%Divorced
Women who gave birth in the past 12 months
| Now married: | 24.4% (20) |
| Unmarried: | 75.6% (61) |
Women who did not give birth in the past 12 months
| Now married: | 51.9% (445) |
| Unmarried: | 48.1% (413) |
Marital status - Black or African American population 15 years and over
- Males
- 52.9%Never married
- 14.0%Now married
- 0.0%Separated
- 4.1%Widowed
- 28.9%Divorced
- Females
- 81.0%Never married
- 0.0%Now married
- 6.7%Separated
- 3.8%Widowed
- 8.6%Divorced
Women who did not give birth in the past 12 months
| Now married: | 15.9% (7) |
| Unmarried: | 84.1% (36) |
Marital status - Asian population 15 years and over
- Males
- 53.0%Never married
- 10.2%Now married
- 0.0%Separated
- 0.0%Widowed
- 36.7%Divorced
- Females
- 15.0%Never married
- 85.0%Now married
- 0.0%Separated
- 0.0%Widowed
- 0.0%Divorced
Women who did not give birth in the past 12 months
| Now married: | 89.6% (203) |
| Unmarried: | 10.4% (24) |
Marital status - Other race population 15 years and over
- Males
- 70.6%Never married
- 29.4%Now married
- 0.0%Separated
- 0.0%Widowed
- 0.0%Divorced
- Females
- 66.1%Never married
- 0.0%Now married
- 0.0%Separated
- 0.0%Widowed
- 33.9%Divorced
Women who did not give birth in the past 12 months
| Now married: | 0.0% (0) |
| Unmarried: | 100.0% (55) |
Marital status - Two or more races population 15 years and over
- Males
- 47.2%Never married
- 35.2%Now married
- 0.0%Separated
- 0.0%Widowed
- 17.6%Divorced
- Females
- 33.5%Never married
- 38.9%Now married
- 10.8%Separated
- 4.9%Widowed
- 11.8%Divorced
Women who did not give birth in the past 12 months
| Now married: | 26.6% (48) |
| Unmarried: | 73.4% (133) |
Marital status - White alone, not Hispanic / Latino population 15 years and over
- Males
- 44.1%Never married
- 24.7%Now married
- 5.5%Separated
- 5.6%Widowed
- 20.1%Divorced
- Females
- 47.5%Never married
- 25.1%Now married
- 1.6%Separated
- 9.0%Widowed
- 16.6%Divorced
Women who gave birth in the past 12 months
| Now married: | 24.4% (21) |
| Unmarried: | 75.6% (65) |
Women who did not give birth in the past 12 months
| Now married: | 32.0% (180) |
| Unmarried: | 68.0% (383) |
Marital status - Hispanic or Latino population 15 years and over
- Males
- 51.7%Never married
- 36.1%Now married
- 0.0%Separated
- 1.2%Widowed
- 11.0%Divorced
- Females
- 23.7%Never married
- 61.3%Now married
- 3.4%Separated
- 1.7%Widowed
- 9.9%Divorced
Women who did not give birth in the past 12 months
| Now married: | 66.2% (354) |
| Unmarried: | 33.8% (180) |
Ancestries in West Reading

- 31416.9%German
- 1417.6%Italian
- 914.9%Irish
- 834.5%American
- 804.3%Pennsylvania German
- 271.5%Polish
- 271.5%Scottish
- 170.9%European
- 160.9%Haitian
- 130.7%Austrian
- 130.7%English
- 60.3%Lithuanian
- 40.2%West Indian

Geographical mobility in West Reading

- Same house 1 year ago
- 2,27786.1%White (Caucasian)
- 257100.0%Black or African American
- 1899.6%American Indian / Alaska Native
- 40192.0%Asian
- 19596.7%Other race
- 1,04890.7%Two or more races
- 1,82784.6%White alone, not Hispanic / Latino
- 1,41895.4%Hispanic or Latino

-
- Moved within same county
- 2288.6%White / Caucasian
- 41.7%Black or African American
- 184.1%Asian
- 443.8%Two or more races
- 22110.2%White alone, not Hispanic / Latino
- 231.5%Hispanic or Latino

-
- Moved within same state
- 1174.4%White / Caucasian
- 83.2%Black or African American
- 40.9%Asian
- 199.2%Other race
- 121.0%Two or more races
- 833.8%White alone, not Hispanic / Latino
- 432.9%Hispanic or Latino

-
- Moved from different state
- 10.0%White / Caucasian
- 153.3%Asian
- 151.3%Two or more races
- 10.0%White alone, not Hispanic / Latino

Children Nativity (place of birth) in West Reading
Place of birth for residents in West Reading
![Place of birth for the foreign-born population - Regions]()
- 183Asia
- 128Americas
- 128Latin America
- 83Eastern Asia
- 83China
- 82South Eastern Asia
- 52Central America
- 41South America
- 34Caribbean
- 21Europe
- 21Western Europe
- 18South Central Asia

![Place of birth for the foreign-born population - Countries]()
- 83China
- 55Vietnam
- 48Mexico
- 22Colombia
- 21Dominican Republic
- 18India
- 18Ecuador
- 16France
- 15Thailand
- 12Trinidad and Tobago
- 11Philippines
- 5Germany
- 4Panama

Zip codes: 19611.