Races in West St. Paul, Minnesota (MN) Detailed Stats
Data:
Races - White alone (%)
Races - White alone (% change since 2000)
Races - Black alone (%)
Races - Black alone (% change since 2000)
Races - American Indian alone (%)
Races - American Indian alone (% change since 2000)
Races - Asian alone (%)
Races - Asian alone (% change since 2000)
Races - Hispanic (%)
Races - Hispanic (% change since 2000)
Races - Native Hawaiian and Other Pacific Islander alone (%)
Races - Native Hawaiian and Other Pacific Islander alone (% change since 2000)
Races - Two or more races(%)
Races - Two or more races(% change since 2000)
Races - Other race alone (%)
Races - Other race alone (% change since 2000)
Racial diversity
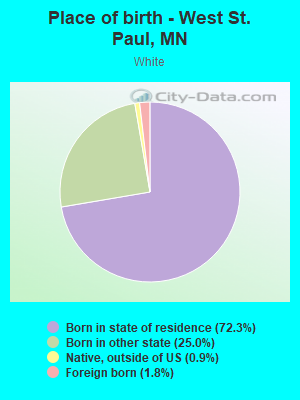
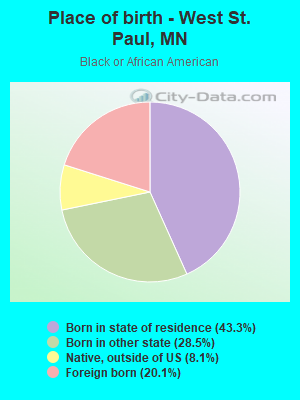
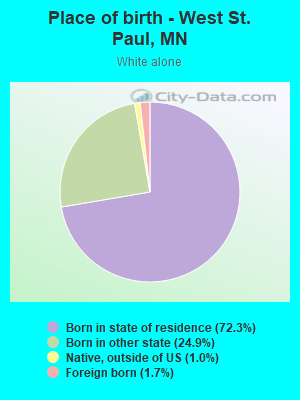
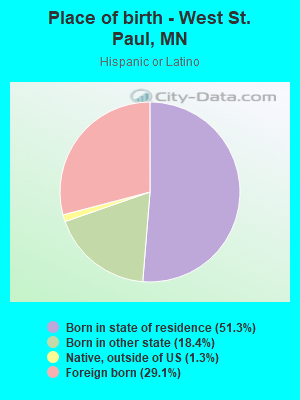
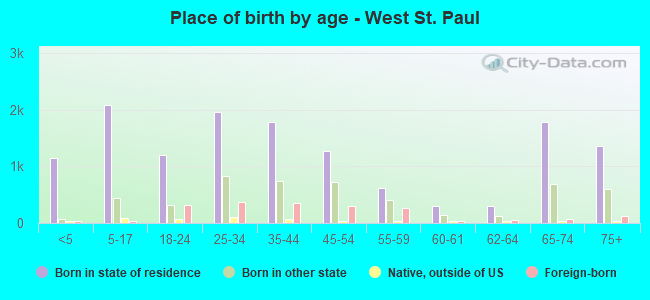
Place of birth - Born in state of residence (%)
Place of birth - Born in state of residence (%) - White
Place of birth - Born in state of residence (%) - Black or African American
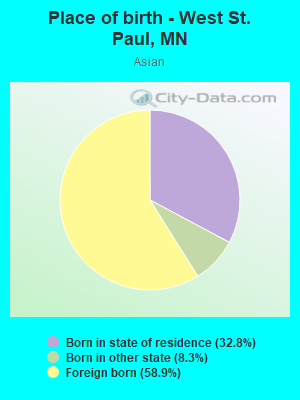
Place of birth - Born in state of residence (%) - Asian
Place of birth - Born in state of residence (%) - Hispanic or Latino
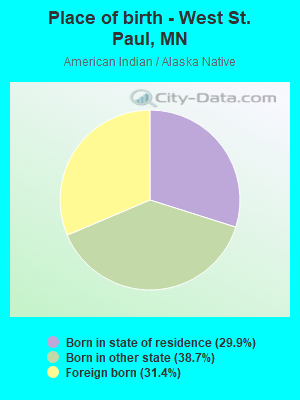
Place of birth - Born in state of residence (%) - American Indian and Alaska Native
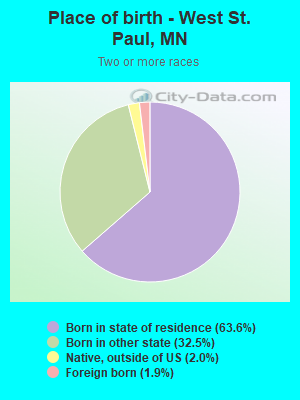
Place of birth - Born in state of residence (%) - Multirace
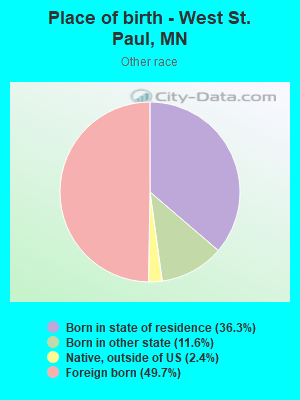
Place of birth - Born in state of residence (%) - Other Race
Place of birth - Born in other state (%)
Place of birth - Born in other state (%) - White
Place of birth - Born in other state (%) - Black or African American
Place of birth - Born in other state (%) - Asian
Place of birth - Born in other state (%) - Hispanic or Latino
Place of birth - Born in other state (%) - American Indian and Alaska Native
Place of birth - Born in other state (%) - Multirace
Place of birth - Born in other state (%) - Other Race
Place of birth - Native, outside of US (%)
Place of birth - Native, outside of US (%) - White
Place of birth - Native, outside of US (%) - Black or African American
Place of birth - Native, outside of US (%) - Asian
Place of birth - Native, outside of US (%) - Hispanic or Latino
Place of birth - Native, outside of US (%) - American Indian and Alaska Native
Place of birth - Native, outside of US (%) - Multirace
Place of birth - Native, outside of US (%) - Other Race
Place of birth - Foreign born (%)
Place of birth - Foreign born (%) - White
Place of birth - Foreign born (%) - Black or African American
Place of birth - Foreign born (%) - Asian
Place of birth - Foreign born (%) - Hispanic or Latino
Place of birth - Foreign born (%) - American Indian and Alaska Native
Place of birth - Foreign born (%) - Multirace
Place of birth - Foreign born (%) - Other Race
Residents speaking English at home (%)
Residents speaking English at home - Born in the United States (%)
Residents speaking English at home - Native, born elsewhere (%)
Residents speaking English at home - Foreign born (%)
Residents speaking Spanish at home (%)
Residents speaking Spanish at home - Born in the United States (%)
Residents speaking Spanish at home - Native, born elsewhere (%)
Residents speaking Spanish at home - Foreign born (%)
Residents speaking other language at home (%)
Residents speaking other language at home - Born in the United States (%)
Residents speaking other language at home - Native, born elsewhere (%)
Residents speaking other language at home - Foreign born (%)
Marital status - Never married (%)
Marital status - Now married (%)
Marital status - Separated (%)
Marital status - Widowed (%)
Marital status - Divorced (%)
Ancestries Reported - Arab (%)
Ancestries Reported - Czech (%)
Ancestries Reported - Danish (%)
Ancestries Reported - Dutch (%)
Ancestries Reported - English (%)
Ancestries Reported - French (%)
Ancestries Reported - French Canadian (%)
Ancestries Reported - German (%)
Ancestries Reported - Greek (%)
Ancestries Reported - Hungarian (%)
Ancestries Reported - Irish (%)
Ancestries Reported - Italian (%)
Ancestries Reported - Lithuanian (%)
Ancestries Reported - Norwegian (%)
Ancestries Reported - Polish (%)
Ancestries Reported - Portuguese (%)
Ancestries Reported - Russian (%)
Ancestries Reported - Scotch-Irish (%)
Ancestries Reported - Scottish (%)
Ancestries Reported - Slovak (%)
Ancestries Reported - Subsaharan African (%)
Ancestries Reported - Swedish (%)
Ancestries Reported - Swiss (%)
Ancestries Reported - Ukrainian (%)
Ancestries Reported - United States (%)
Ancestries Reported - Welsh (%)
Ancestries Reported - West Indian (%)
Ancestries Reported - Other (%)
Geographical mobility - Same house 1 year ago (%)
Geographical mobility - Same house 1 year ago (%) - White
Geographical mobility - Same house 1 year ago (%) - Black or African American
Geographical mobility - Same house 1 year ago (%) - Asian
Geographical mobility - Same house 1 year ago (%) - Hispanic or Latino
Geographical mobility - Same house 1 year ago (%) - American Indian and Alaska Native
Geographical mobility - Same house 1 year ago (%) - Multirace
Geographical mobility - Same house 1 year ago (%) - Other Race
Geographical mobility - Moved within same county (%)
Geographical mobility - Moved within same county (%) - White
Geographical mobility - Moved within same county (%) - Black or African American
Geographical mobility - Moved within same county (%) - Asian
Geographical mobility - Moved within same county (%) - Hispanic or Latino
Geographical mobility - Moved within same county (%) - American Indian and Alaska Native
Geographical mobility - Moved within same county (%) - Multirace
Geographical mobility - Moved within same county (%) - Other Race
Geographical mobility - Moved from different county within same state (%)
Geographical mobility - Moved from different county within same state (%) - White
Geographical mobility - Moved from different county within same state (%) - Black or African American
Geographical mobility - Moved from different county within same state (%) - Asian
Geographical mobility - Moved from different county within same state (%) - Hispanic or Latino
Geographical mobility - Moved from different county within same state (%) - American Indian and Alaska Native
Geographical mobility - Moved from different county within same state (%) - Multirace
Geographical mobility - Moved from different county within same state (%) - Other Race
Geographical mobility - Moved from different state (%)
Geographical mobility - Moved from different state (%) - White
Geographical mobility - Moved from different state (%) - Black or African American
Geographical mobility - Moved from different state (%) - Asian
Geographical mobility - Moved from different state (%) - Hispanic or Latino
Geographical mobility - Moved from different state (%) - American Indian and Alaska Native
Geographical mobility - Moved from different state (%) - Multirace
Geographical mobility - Moved from different state (%) - Other Race
Geographical mobility - Moved from abroad (%)
Geographical mobility - Moved from abroad (%) - White
Geographical mobility - Moved from abroad (%) - Black or African American
Geographical mobility - Moved from abroad (%) - Asian
Geographical mobility - Moved from abroad (%) - Hispanic or Latino
Geographical mobility - Moved from abroad (%) - American Indian and Alaska Native
Geographical mobility - Moved from abroad (%) - Multirace
Geographical mobility - Moved from abroad (%) - Other Race
Place of birth for the foreign-born population - Ireland (%)
Place of birth for the foreign-born population - Denmark (%)
Place of birth for the foreign-born population - Norway (%)
Place of birth for the foreign-born population - Sweden (%)
Place of birth for the foreign-born population - United Kingdom (%)
Place of birth for the foreign-born population - England (%)
Place of birth for the foreign-born population - Scotland (%)
Place of birth for the foreign-born population - Other Northern Europe (%)
Place of birth for the foreign-born population - Austria (%)
Place of birth for the foreign-born population - Belgium (%)
Place of birth for the foreign-born population - France (%)
Place of birth for the foreign-born population - Germany (%)
Place of birth for the foreign-born population - Netherlands (%)
Place of birth for the foreign-born population - Switzerland (%)
Place of birth for the foreign-born population - Other Western Europe (%)
Place of birth for the foreign-born population - Greece (%)
Place of birth for the foreign-born population - Italy (%)
Place of birth for the foreign-born population - Portugal (%)
Place of birth for the foreign-born population - Spain (%)
Place of birth for the foreign-born population - Other Southern Europe (%)
Place of birth for the foreign-born population - Albania (%)
Place of birth for the foreign-born population - Belarus (%)
Place of birth for the foreign-born population - Bosnia and Herzegovina (%)
Place of birth for the foreign-born population - Bulgaria (%)
Place of birth for the foreign-born population - Croatia (%)
Place of birth for the foreign-born population - Czechoslovakia (%)
Place of birth for the foreign-born population - Hungary (%)
Place of birth for the foreign-born population - Latvia (%)
Place of birth for the foreign-born population - Lithuania (%)
Place of birth for the foreign-born population - North Macedonia (Macedonia) (%)
Place of birth for the foreign-born population - Moldova (%)
Place of birth for the foreign-born population - Poland (%)
Place of birth for the foreign-born population - Romania (%)
Place of birth for the foreign-born population - Russia (%)
Place of birth for the foreign-born population - Serbia (%)
Place of birth for the foreign-born population - Ukraine (%)
Place of birth for the foreign-born population - Other Eastern Europe (%)
Place of birth for the foreign-born population - China (%)
Place of birth for the foreign-born population - Hong Kong (%)
Place of birth for the foreign-born population - Taiwan (%)
Place of birth for the foreign-born population - Japan (%)
Place of birth for the foreign-born population - Korea (%)
Place of birth for the foreign-born population - Other Eastern Asia (%)
Place of birth for the foreign-born population - Afghanistan (%)
Place of birth for the foreign-born population - Bangladesh (%)
Place of birth for the foreign-born population - India (%)
Place of birth for the foreign-born population - Iran (%)
Place of birth for the foreign-born population - Kazakhstan (%)
Place of birth for the foreign-born population - Nepal (%)
Place of birth for the foreign-born population - Pakistan (%)
Place of birth for the foreign-born population - Sri Lanka (%)
Place of birth for the foreign-born population - Uzbekistan (%)
Place of birth for the foreign-born population - Other South Central Asia (%)
Place of birth for the foreign-born population - Burma (%)
Place of birth for the foreign-born population - Cambodia (%)
Place of birth for the foreign-born population - Indonesia (%)
Place of birth for the foreign-born population - Laos (%)
Place of birth for the foreign-born population - Malaysia (%)
Place of birth for the foreign-born population - Philippines (%)
Place of birth for the foreign-born population - Singapore (%)
Place of birth for the foreign-born population - Thailand (%)
Place of birth for the foreign-born population - Vietnam (%)
Place of birth for the foreign-born population - Other South Eastern Asia (%)
Place of birth for the foreign-born population - Armenia (%)
Place of birth for the foreign-born population - Iraq (%)
Place of birth for the foreign-born population - Israel (%)
Place of birth for the foreign-born population - Jordan (%)
Place of birth for the foreign-born population - Kuwait (%)
Place of birth for the foreign-born population - Lebanon (%)
Place of birth for the foreign-born population - Saudi Arabia (%)
Place of birth for the foreign-born population - Syria (%)
Place of birth for the foreign-born population - Turkey (%)
Place of birth for the foreign-born population - Yemen (%)
Place of birth for the foreign-born population - Other Western Asia (%)
Place of birth for the foreign-born population - Eritrea (%)
Place of birth for the foreign-born population - Ethiopia (%)
Place of birth for the foreign-born population - Kenya (%)
Place of birth for the foreign-born population - Somalia (%)
Place of birth for the foreign-born population - Uganda (%)
Place of birth for the foreign-born population - Zimbabwe (%)
Place of birth for the foreign-born population - Other Eastern Africa (%)
Place of birth for the foreign-born population - Cameroon (%)
Place of birth for the foreign-born population - Congo (%)
Place of birth for the foreign-born population - Democratic Republic of Congo (Zaire) (%)
Place of birth for the foreign-born population - Other Middle Africa (%)
Place of birth for the foreign-born population - Egypt (%)
Place of birth for the foreign-born population - Morocco (%)
Place of birth for the foreign-born population - Sudan (%)
Place of birth for the foreign-born population - Other Northern Africa (%)
Place of birth for the foreign-born population - South Africa (%)
Place of birth for the foreign-born population - Other Southern Africa (%)
Place of birth for the foreign-born population - Cabo Verde (%)
Place of birth for the foreign-born population - Ghana (%)
Place of birth for the foreign-born population - Liberia (%)
Place of birth for the foreign-born population - Nigeria (%)
Place of birth for the foreign-born population - Senegal (%)
Place of birth for the foreign-born population - Sierra Leone (%)
Place of birth for the foreign-born population - Other Western Africa (%)
Place of birth for the foreign-born population - Australia (%)
Place of birth for the foreign-born population - New Zealand (%)
Place of birth for the foreign-born population - Fiji (%)
Place of birth for the foreign-born population - Micronesia (%)
Place of birth for the foreign-born population - Bahamas (%)
Place of birth for the foreign-born population - Barbados (%)
Place of birth for the foreign-born population - Cuba (%)
Place of birth for the foreign-born population - Dominica (%)
Place of birth for the foreign-born population - Dominican Republic (%)
Place of birth for the foreign-born population - Grenada (%)
Place of birth for the foreign-born population - Haiti (%)
Place of birth for the foreign-born population - Jamaica (%)
Place of birth for the foreign-born population - St. Vincent and the Grenadines (%)
Place of birth for the foreign-born population - Trinidad and Tobago (%)
Place of birth for the foreign-born population - West Indies (%)
Place of birth for the foreign-born population - Other Caribbean (%)
Place of birth for the foreign-born population - Belize (%)
Place of birth for the foreign-born population - Costa Rica (%)
Place of birth for the foreign-born population - El Salvador (%)
Place of birth for the foreign-born population - Guatemala (%)
Place of birth for the foreign-born population - Honduras (%)
Place of birth for the foreign-born population - Mexico (%)
Place of birth for the foreign-born population - Nicaragua (%)
Place of birth for the foreign-born population - Panama (%)
Place of birth for the foreign-born population - Other Central America (%)
Place of birth for the foreign-born population - Argentina (%)
Place of birth for the foreign-born population - Bolivia (%)
Place of birth for the foreign-born population - Brazil (%)
Place of birth for the foreign-born population - Chile (%)
Place of birth for the foreign-born population - Colombia (%)
Place of birth for the foreign-born population - Ecuador (%)
Place of birth for the foreign-born population - Guyana (%)
Place of birth for the foreign-born population - Peru (%)
Place of birth for the foreign-born population - Uruguay (%)
Place of birth for the foreign-born population - Venezuela (%)
Place of birth for the foreign-born population - Other South America (%)
Place of birth for the foreign-born population - Canada (%)
Place of birth for the foreign-born population - Other Northern America (%)
Place of birth for the foreign-born population - Other (%)
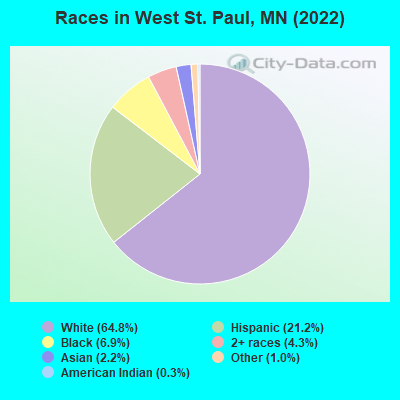
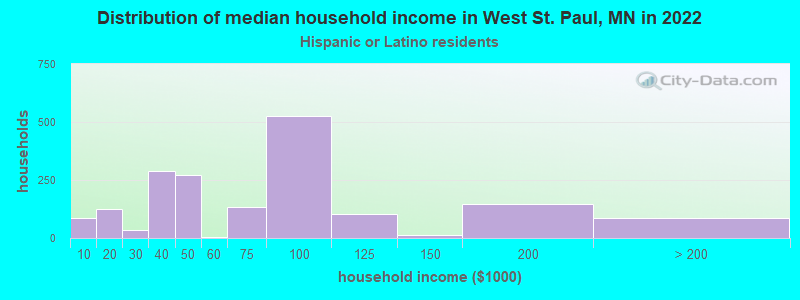
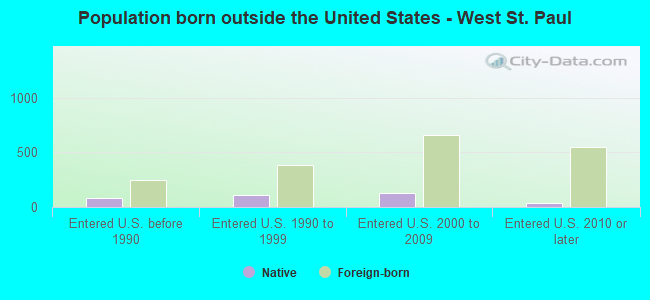
According to 2022 data, the most numerous races in West St. Paul, MN are White alone (13,619 residents), Black alone (1,442 residents), and Hispanic (4,456 residents). 84.7% of West St. Paul residents speak English at home. 8.8% of West St. Paul, MN residents are foreign-born (4.6% born in Latin America, 1.4% born in Europe, 1.3% born in Asia, 1.2% born in Africa), which is 8.7% greater than the foreign-born rate of 8.0% across the entire state of Minnesota.
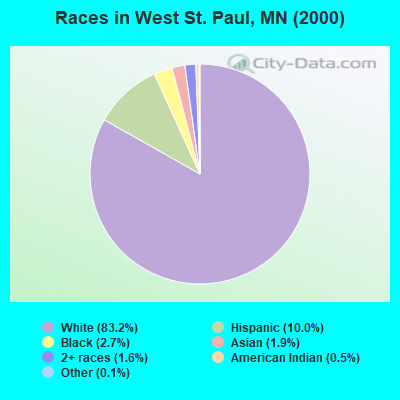
Race distribution in West St. Paul
2000 2022
4,337,143 88.2% White alone 168,813 3.4% Black alone 143,382 2.9% Hispanic 141,083 2.9% Asian alone 70,304 1.4% Two or more races 52,009 1.1% American Indian alone 5,031 0.1% Other race alone 1,714 0.03% Native Hawaiian and Other
4,356,347 76.2% White alone 395,179 6.9% Black alone 333,830 5.8% Hispanic 294,800 5.2% Asian alone 259,649 4.5% Two or more races 42,125 0.7% American Indian alone 32,976 0.6% Other race alone 2,278 0.04% Native Hawaiian and Other
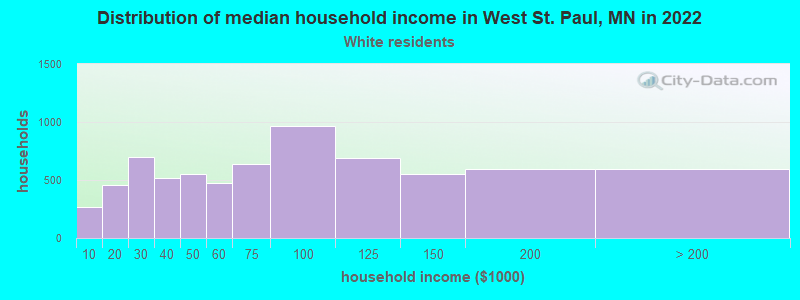
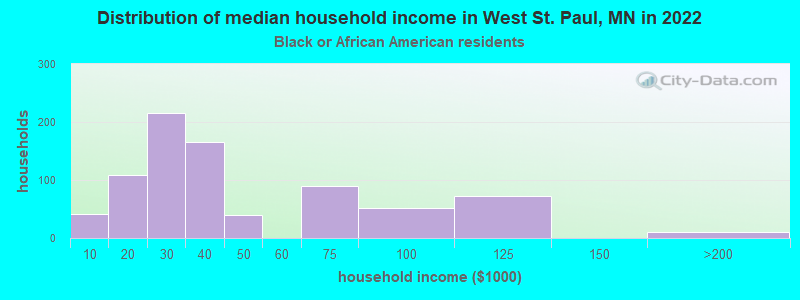
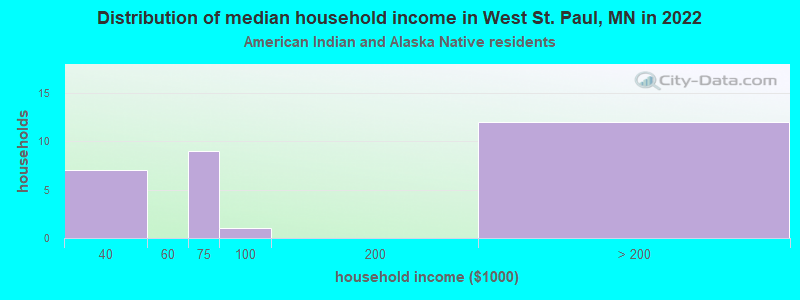
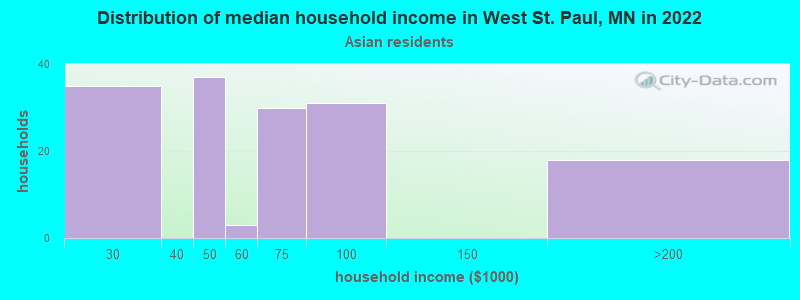
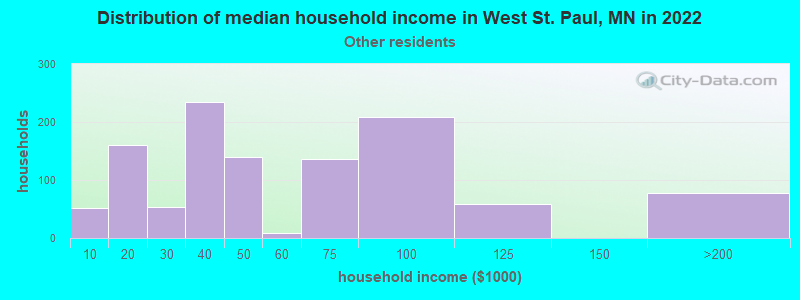
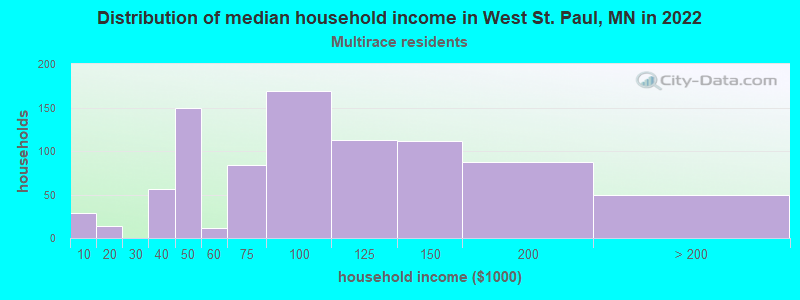
Income and house value in West St. Paul Median household income in 2022 $68,291 White non-Hispanic householders$34,714 Black householders$60,565 Asian householders$54,290 Some other race householders$96,749 Two or more races householders$71,949 Hispanic or Latino race householdersMedian 2022 house value $292,675 White Non-Hispanic householders$322,458 Black or African American householders$360,215 American Indian or Alaska Native householders $335,357 Asian householders$255,387 Some other race householders$224,665 Two or more races householders$257,029 Hispanic or Latino householders
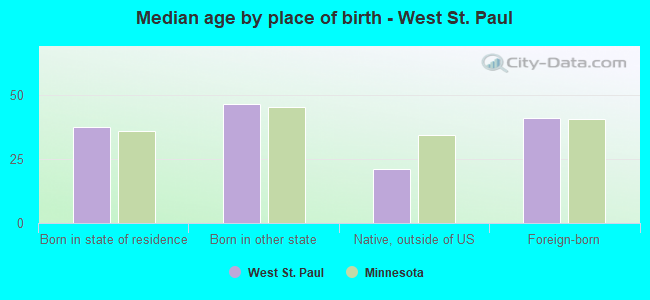
Median age by race in West St. Paul
45.2 Median age for White residents40.3 49.8 35.3 Median age for Black or African American residents30.3 35.9 25.5 Median age for American Indian / Alaska Native residents20.9 25.8 36.7 Median age for Asian residents36.0 36.5 -744,336,568.8 Median age for Native Hawaiian / Pacific Islander residents-856,799,036.4 -534,959,349.1 30.1 Median age for Other race residents35.0 28.0 34.4 Median age for Two or more races residents30.8 43.2 47.8 Median age for White alone residents41.1 51.8 27.1 Median age for Hispanic or Latino residents29.1 26.1
Owner/renter occupied households by race in West St. Paul
House owners and renters - White residents 4,529 63.7% Owner occupied2,580 36.3% Renter occupiedHouse owners and renters - Black or African American residents 340 41.9% Owner occupied472 58.1% Renter occupiedHouse owners and renters - American Indian / Alaska Native residents 21 72.1% Owner occupied8 27.9% Renter occupiedHouse owners and renters - Asian residents 83 76.7% Owner occupied25 23.3% Renter occupiedHouse owners and renters - Other race residents 344 32.7% Owner occupied708 67.3% Renter occupiedHouse owners and renters - Two or more races residents 723 78.1% Owner occupied203 21.9% Renter occupiedHouse owners and renters - White alone residents 4,203 62.8% Owner occupied2,491 37.2% Renter occupiedHouse owners and renters - Hispanic or Latino residents 838 50.7% Owner occupied814 49.3% Renter occupied
Language usage in West St. Paul
English speakers - Total 84.7% of residents of West St. Paul speak English at home.
11.8% of residents speak Spanish at home 1,094 46.7% Speak English very well1,251 53.3% Speak English less than very well4.2% of residents speak other language at home 726 87.8% Speak English very well101 12.2% Speak English less than very well
English speakers - Born in the United States 88.8% of residents of West St. Paul speak English at home.
7.6% of residents speak Spanish at home 339 89.7% Speak English very well39 10.3% Speak English less than very well1.1% of residents speak other language at home 51 94.4% Speak English very well3 5.6% Speak English less than very well
English speakers - Native, born elsewhere 66.1% of residents of West St. Paul speak English at home.
26.8% of residents speak Spanish at home 49 54.4% Speak English very well41 45.6% Speak English less than very well17.6% of residents speak other language at home 59 100.0% Speak English very well
English speakers - Foreign-born 24.3% of residents of West St. Paul speak English at home.
67.6% of residents speak Spanish at home 189 14.7% Speak English very well1,093 85.3% Speak English less than very well24.6% of residents speak other language at home 374 80.3% Speak English very well92 19.7% Speak English less than very well
White (Caucasian) - Speak only English Native:
96.8% (13,596)Foreign-born:
57.2% (159)
White (Caucasian) - Speak another language Native:
2.6% (365)Foreign-born:
46.7% (129)
Black or African American - Speak only English Native:
76.7% (839)Foreign-born:
39.6% (117)
Black or African American - Speak another language Native:
25.3% (276)Foreign-born:
59.5% (175)
American Indian / Alaska Native - Speak only English Native:
63.1% (59)Foreign-born:
15.0% (6)
American Indian / Alaska Native - Speak another language Native:
36.4% (34)Foreign-born:
93.2% (39)
Asian - Speak only English Native:
82.1% (116)Foreign-born:
29.3% (80)
Asian - Speak another language Native:
23.5% (33)Foreign-born:
70.8% (192)
Other race - Speak only English Native:
31.2% (370)Foreign-born:
11.4% (146)
Other race - Speak another language Native:
69.5% (824)Foreign-born:
88.2% (1,129)
Two or more races - Speak another language Native:
7.2% (102)Foreign-born:
100.0% (34)
White alone - Speak only English Native:
99.3% (12,780)Foreign-born:
71.6% (169)
White alone - Speak another language Native:
0.8% (107)Foreign-born:
31.6% (75)
Hispanic or Latino - Speak only English Native:
56.6% (1,424)Foreign-born:
6.3% (80)
Hispanic or Latino - Speak another language Native:
43.4% (1,092)Foreign-born:
94.4% (1,199)
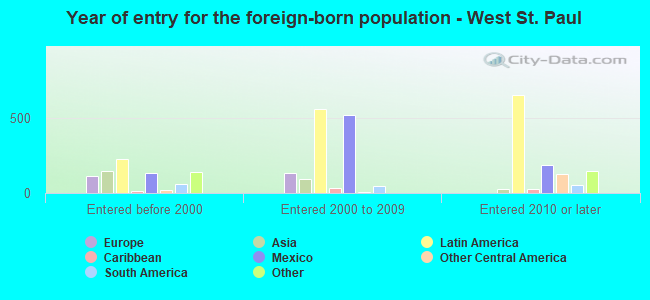
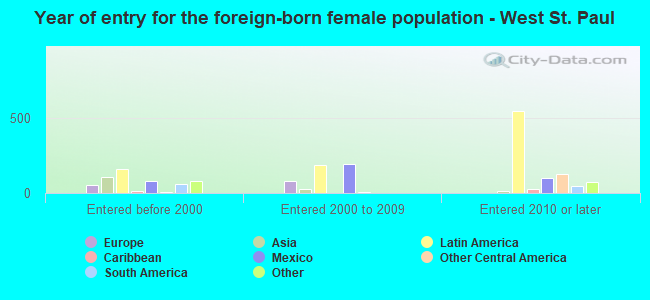
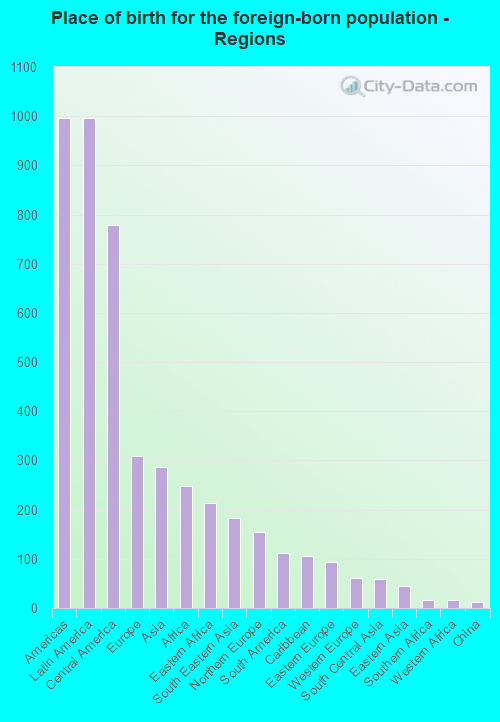
Foreign-born residents in West St. Paul 1,842 residents are foreign born (4.6% Latin America , 1.4% Europe , 1.3% Asia , 1.2% Africa ).
This city:
8.8%Minnesota:
8.5%
Marital status for residents in West St. Paul Marital status - White (Caucasian) population 15 years and over
Males 38.3% Never married51.5% Now married0.8% Separated1.5% Widowed8.0% DivorcedFemales 31.8% Never married39.7% Now married0.8% Separated15.8% Widowed11.8% DivorcedWomen who gave birth in the past 12 months Now married:
68.1% (90)Unmarried:
31.9% (42)
Women who did not give birth in the past 12 months Now married:
37.6% (1,119)Unmarried:
62.4% (1,855)
Marital status - Black or African American population 15 years and over
Males 55.9% Never married42.0% Now married0.3% Separated0.0% Widowed1.7% DivorcedFemales 42.6% Never married35.7% Now married7.0% Separated0.9% Widowed13.8% DivorcedWomen who did not give birth in the past 12 months Now married:
42.2% (283)Unmarried:
57.8% (387)
Marital status - American Indian / Alaska Native population 15 years and over
Males 70.3% Never married29.7% Now married0.0% Separated0.0% Widowed0.0% DivorcedFemales 38.9% Never married46.3% Now married0.0% Separated0.0% Widowed14.8% DivorcedWomen who did not give birth in the past 12 months Now married:
43.2% (17)Unmarried:
56.8% (22)
Marital status - Asian population 15 years and over
Males 37.1% Never married41.3% Now married0.0% Separated0.0% Widowed21.7% DivorcedFemales 11.4% Never married46.3% Now married0.0% Separated32.3% Widowed10.0% DivorcedWomen who did not give birth in the past 12 months Now married:
75.2% (79)Unmarried:
24.8% (26)
Marital status - Other race population 15 years and over
Males 53.4% Never married39.0% Now married0.0% Separated0.0% Widowed7.6% DivorcedFemales 53.4% Never married26.6% Now married4.4% Separated6.4% Widowed9.1% DivorcedWomen who gave birth in the past 12 months Now married:
0.0% (0)Unmarried:
100.0% (26)
Women who did not give birth in the past 12 months Now married:
37.9% (371)Unmarried:
62.1% (606)
Marital status - Two or more races population 15 years and over
Males 60.6% Never married27.7% Now married0.0% Separated5.5% Widowed6.1% DivorcedFemales 44.1% Never married36.1% Now married0.0% Separated0.0% Widowed19.8% DivorcedWomen who gave birth in the past 12 months Now married:
0.0% (0)Unmarried:
100.0% (5)
Women who did not give birth in the past 12 months Now married:
10.2% (40)Unmarried:
89.8% (352)
Marital status - White alone, not Hispanic / Latino population 15 years and over
Males 39.0% Never married51.7% Now married0.9% Separated1.3% Widowed7.1% DivorcedFemales 29.1% Never married42.4% Now married0.9% Separated17.0% Widowed10.6% DivorcedWomen who gave birth in the past 12 months Now married:
74.4% (92)Unmarried:
25.6% (32)
Women who did not give birth in the past 12 months Now married:
40.8% (1,064)Unmarried:
59.2% (1,546)
Marital status - Hispanic or Latino population 15 years and over
Males 43.6% Never married41.8% Now married0.0% Separated3.0% Widowed11.6% DivorcedFemales 53.8% Never married20.1% Now married2.4% Separated5.4% Widowed18.3% DivorcedWomen who gave birth in the past 12 months Now married:
0.0% (0)Unmarried:
100.0% (36)
Women who did not give birth in the past 12 months Now married:
26.3% (316)Unmarried:
73.7% (887)
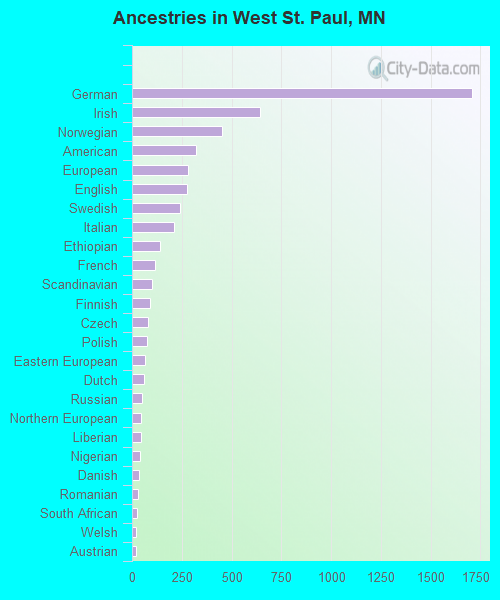
Ancestries in West St. Paul
1,708 18.5% German643 7.0% Irish450 4.9% Norwegian320 3.5% American283 3.1% European275 3.0% English242 2.6% Swedish209 2.3% Italian140 1.5% Ethiopian116 1.3% French101 1.1% Scandinavian89 1.0% Finnish79 0.9% Czech75 0.8% Polish64 0.7% Eastern European58 0.6% Dutch48 0.5% Russian46 0.5% Northern European44 0.5% Liberian41 0.4% Nigerian36 0.4% Danish31 0.3% Romanian25 0.3% South African20 0.2% Welsh19 0.2% Austrian19 0.2% French Canadian18 0.2% African16 0.2% British12 0.1% Afghan12 0.1% Haitian10 0.1% Slavic8 0.09% Lithuanian7 0.08% Brazilian6 0.07% German Russian5 0.05% Luxembourger5 0.05% Hungarian
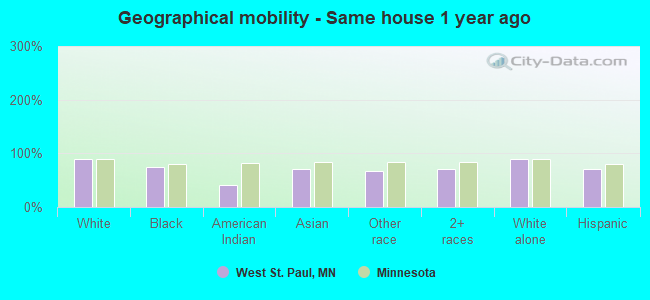
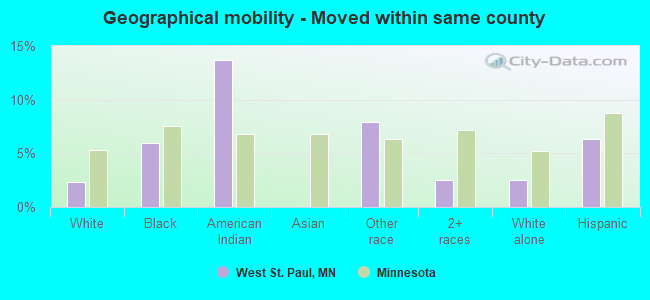
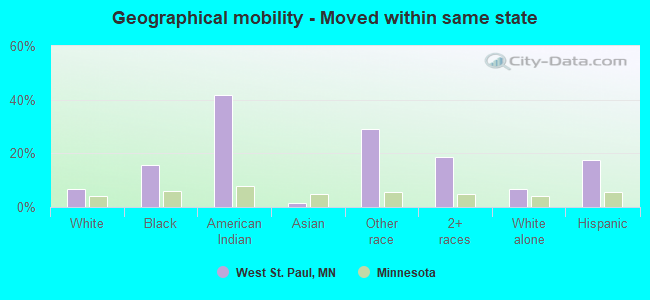
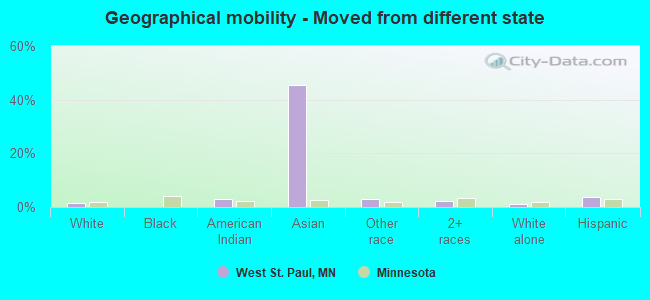
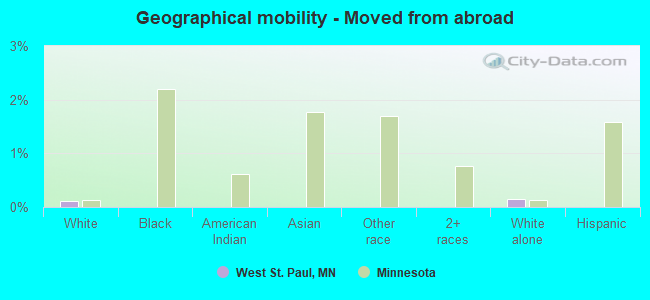
Geographical mobility in West St. Paul Same house 1 year ago 13,281 89.3% White (Caucasian)1,069 75.5% Black or African American51 40.6% American Indian / Alaska Native320 71.0% Asian1,748 67.4% Other race1,326 71.0% Two or more races12,173 89.7% White alone, not Hispanic / Latino3,157 71.3% Hispanic or LatinoMoved within same county 344 2.3% White / Caucasian85 6.0% Black or African American17 13.7% American Indian / Alaska Native205 7.9% Other race47 2.5% Two or more races339 2.5% White alone, not Hispanic / Latino279 6.3% Hispanic or LatinoMoved within same state 1,023 6.9% White / Caucasian223 15.8% Black or African American52 41.6% American Indian / Alaska Native6 1.3% Asian758 29.2% Other race347 18.6% Two or more races925 6.8% White alone, not Hispanic / Latino774 17.5% Hispanic or LatinoMoved from different state 224 1.5% White / Caucasian4 2.9% American Indian / Alaska Native205 45.6% Asian73 2.8% Other race45 2.4% Two or more races140 1.0% White alone, not Hispanic / Latino157 3.6% Hispanic or LatinoMoved from abroad 17 0.1% White20 0.1% White alone, not Hispanic / Latino
Children Nativity (place of birth) in West St. Paul
Children under 6 years - Living with two parents Both parents native 747 100.0% NativeBoth parents foreign-born 170 100.0% NativeOne native, one foreign-born parent 86 100.0% NativeChildren under 6 years - Living with one parent Native parent 269 100.0% NativeForeign-born parent 78 100.0% NativeChildren 6 to 17 years - Living with two parents Both parents native 1,758 100.0% NativeBoth parents foreign-born 103 82.8% Native22 17.2% Foreign-bornOne native, one foreign-born parent 89 100.0% NativeChildren 6 to 17 years - Living with one parent Native parent 391 100.0% NativeForeign-born parent 60 48.3% Native65 51.7% Foreign-born
Grandparents responsible for own grandchildren in West St. Paul
Grandparents (30 to 59 years) White / Caucasian 27 37.7% Responsible for grandchildren45 62.3% Not responsible for grandchildrenOther race 27 100.0% Responsible for grandchildrenWhite alone, not Hispanic / Latino 28 82.3% Responsible for grandchildren6 17.7% Not responsible for grandchildrenHispanic or Latino 16 29.1% Responsible for grandchildren39 70.9% Not responsible for grandchildrenGrandparents (60 years and over) White / Caucasian 66 36.9% Responsible for grandchildren113 63.1% Not responsible for grandchildrenWhite alone, not Hispanic / Latino 66 36.2% Responsible for grandchildren116 63.8% Not responsible for grandchildren