Races in West Valley City, Utah (UT) Detailed Stats
Data:
Races - White alone (%)
Races - White alone (% change since 2000)
Races - Black alone (%)
Races - Black alone (% change since 2000)
Races - American Indian alone (%)
Races - American Indian alone (% change since 2000)
Races - Asian alone (%)
Races - Asian alone (% change since 2000)
Races - Hispanic (%)
Races - Hispanic (% change since 2000)
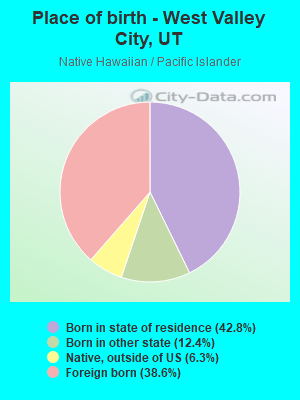
Races - Native Hawaiian and Other Pacific Islander alone (%)
Races - Native Hawaiian and Other Pacific Islander alone (% change since 2000)
Races - Two or more races(%)
Races - Two or more races(% change since 2000)
Races - Other race alone (%)
Races - Other race alone (% change since 2000)
Racial diversity
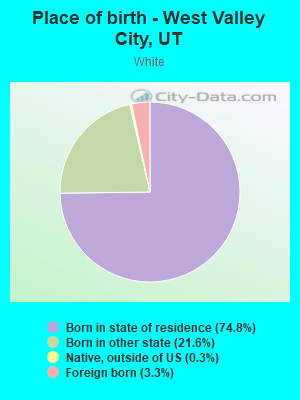
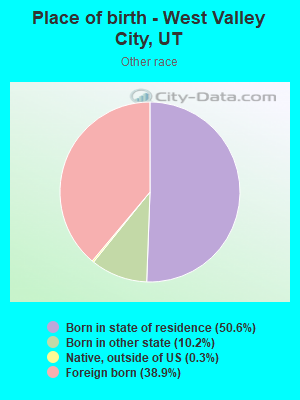
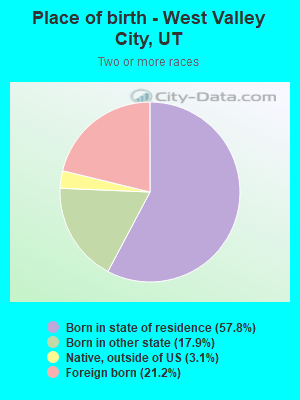
Place of birth - Born in state of residence (%)
Place of birth - Born in state of residence (%) - White
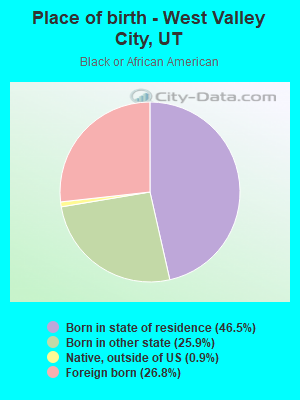
Place of birth - Born in state of residence (%) - Black or African American
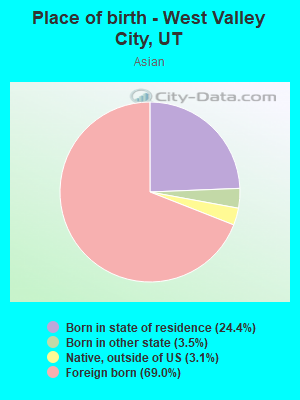
Place of birth - Born in state of residence (%) - Asian
Place of birth - Born in state of residence (%) - Hispanic or Latino
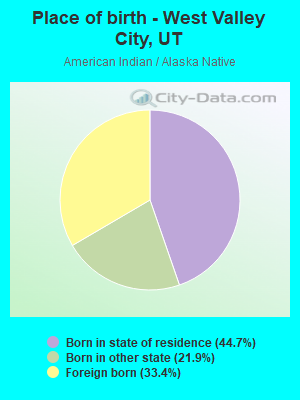
Place of birth - Born in state of residence (%) - American Indian and Alaska Native
Place of birth - Born in state of residence (%) - Multirace
Place of birth - Born in state of residence (%) - Other Race
Place of birth - Born in other state (%)
Place of birth - Born in other state (%) - White
Place of birth - Born in other state (%) - Black or African American
Place of birth - Born in other state (%) - Asian
Place of birth - Born in other state (%) - Hispanic or Latino
Place of birth - Born in other state (%) - American Indian and Alaska Native
Place of birth - Born in other state (%) - Multirace
Place of birth - Born in other state (%) - Other Race
Place of birth - Native, outside of US (%)
Place of birth - Native, outside of US (%) - White
Place of birth - Native, outside of US (%) - Black or African American
Place of birth - Native, outside of US (%) - Asian
Place of birth - Native, outside of US (%) - Hispanic or Latino
Place of birth - Native, outside of US (%) - American Indian and Alaska Native
Place of birth - Native, outside of US (%) - Multirace
Place of birth - Native, outside of US (%) - Other Race
Place of birth - Foreign born (%)
Place of birth - Foreign born (%) - White
Place of birth - Foreign born (%) - Black or African American
Place of birth - Foreign born (%) - Asian
Place of birth - Foreign born (%) - Hispanic or Latino
Place of birth - Foreign born (%) - American Indian and Alaska Native
Place of birth - Foreign born (%) - Multirace
Place of birth - Foreign born (%) - Other Race
Residents speaking English at home (%)
Residents speaking English at home - Born in the United States (%)
Residents speaking English at home - Native, born elsewhere (%)
Residents speaking English at home - Foreign born (%)
Residents speaking Spanish at home (%)
Residents speaking Spanish at home - Born in the United States (%)
Residents speaking Spanish at home - Native, born elsewhere (%)
Residents speaking Spanish at home - Foreign born (%)
Residents speaking other language at home (%)
Residents speaking other language at home - Born in the United States (%)
Residents speaking other language at home - Native, born elsewhere (%)
Residents speaking other language at home - Foreign born (%)
Marital status - Never married (%)
Marital status - Now married (%)
Marital status - Separated (%)
Marital status - Widowed (%)
Marital status - Divorced (%)
Ancestries Reported - Arab (%)
Ancestries Reported - Czech (%)
Ancestries Reported - Danish (%)
Ancestries Reported - Dutch (%)
Ancestries Reported - English (%)
Ancestries Reported - French (%)
Ancestries Reported - French Canadian (%)
Ancestries Reported - German (%)
Ancestries Reported - Greek (%)
Ancestries Reported - Hungarian (%)
Ancestries Reported - Irish (%)
Ancestries Reported - Italian (%)
Ancestries Reported - Lithuanian (%)
Ancestries Reported - Norwegian (%)
Ancestries Reported - Polish (%)
Ancestries Reported - Portuguese (%)
Ancestries Reported - Russian (%)
Ancestries Reported - Scotch-Irish (%)
Ancestries Reported - Scottish (%)
Ancestries Reported - Slovak (%)
Ancestries Reported - Subsaharan African (%)
Ancestries Reported - Swedish (%)
Ancestries Reported - Swiss (%)
Ancestries Reported - Ukrainian (%)
Ancestries Reported - United States (%)
Ancestries Reported - Welsh (%)
Ancestries Reported - West Indian (%)
Ancestries Reported - Other (%)
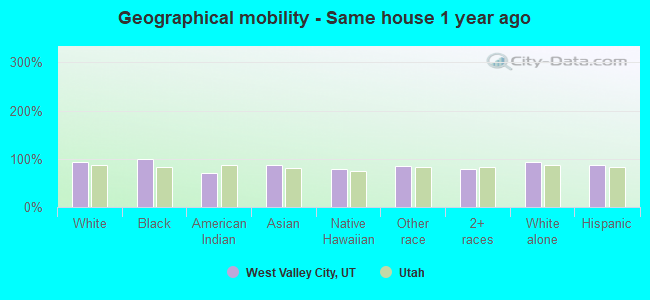
Geographical mobility - Same house 1 year ago (%)
Geographical mobility - Same house 1 year ago (%) - White
Geographical mobility - Same house 1 year ago (%) - Black or African American
Geographical mobility - Same house 1 year ago (%) - Asian
Geographical mobility - Same house 1 year ago (%) - Hispanic or Latino
Geographical mobility - Same house 1 year ago (%) - American Indian and Alaska Native
Geographical mobility - Same house 1 year ago (%) - Multirace
Geographical mobility - Same house 1 year ago (%) - Other Race
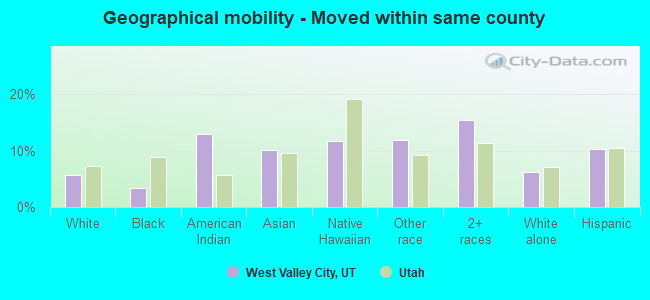
Geographical mobility - Moved within same county (%)
Geographical mobility - Moved within same county (%) - White
Geographical mobility - Moved within same county (%) - Black or African American
Geographical mobility - Moved within same county (%) - Asian
Geographical mobility - Moved within same county (%) - Hispanic or Latino
Geographical mobility - Moved within same county (%) - American Indian and Alaska Native
Geographical mobility - Moved within same county (%) - Multirace
Geographical mobility - Moved within same county (%) - Other Race
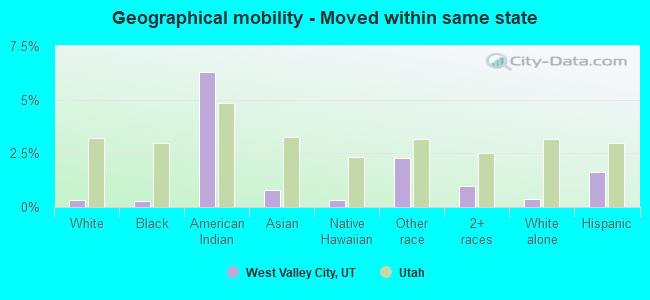
Geographical mobility - Moved from different county within same state (%)
Geographical mobility - Moved from different county within same state (%) - White
Geographical mobility - Moved from different county within same state (%) - Black or African American
Geographical mobility - Moved from different county within same state (%) - Asian
Geographical mobility - Moved from different county within same state (%) - Hispanic or Latino
Geographical mobility - Moved from different county within same state (%) - American Indian and Alaska Native
Geographical mobility - Moved from different county within same state (%) - Multirace
Geographical mobility - Moved from different county within same state (%) - Other Race
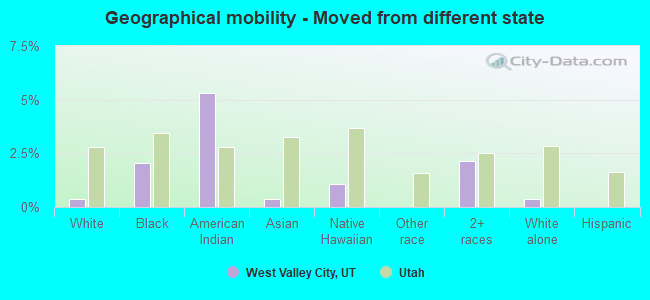
Geographical mobility - Moved from different state (%)
Geographical mobility - Moved from different state (%) - White
Geographical mobility - Moved from different state (%) - Black or African American
Geographical mobility - Moved from different state (%) - Asian
Geographical mobility - Moved from different state (%) - Hispanic or Latino
Geographical mobility - Moved from different state (%) - American Indian and Alaska Native
Geographical mobility - Moved from different state (%) - Multirace
Geographical mobility - Moved from different state (%) - Other Race
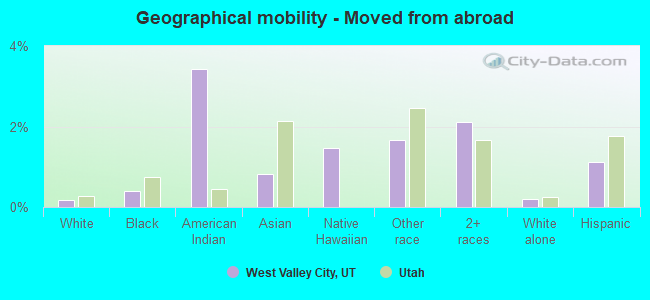
Geographical mobility - Moved from abroad (%)
Geographical mobility - Moved from abroad (%) - White
Geographical mobility - Moved from abroad (%) - Black or African American
Geographical mobility - Moved from abroad (%) - Asian
Geographical mobility - Moved from abroad (%) - Hispanic or Latino
Geographical mobility - Moved from abroad (%) - American Indian and Alaska Native
Geographical mobility - Moved from abroad (%) - Multirace
Geographical mobility - Moved from abroad (%) - Other Race
Place of birth for the foreign-born population - Ireland (%)
Place of birth for the foreign-born population - Denmark (%)
Place of birth for the foreign-born population - Norway (%)
Place of birth for the foreign-born population - Sweden (%)
Place of birth for the foreign-born population - United Kingdom (%)
Place of birth for the foreign-born population - England (%)
Place of birth for the foreign-born population - Scotland (%)
Place of birth for the foreign-born population - Other Northern Europe (%)
Place of birth for the foreign-born population - Austria (%)
Place of birth for the foreign-born population - Belgium (%)
Place of birth for the foreign-born population - France (%)
Place of birth for the foreign-born population - Germany (%)
Place of birth for the foreign-born population - Netherlands (%)
Place of birth for the foreign-born population - Switzerland (%)
Place of birth for the foreign-born population - Other Western Europe (%)
Place of birth for the foreign-born population - Greece (%)
Place of birth for the foreign-born population - Italy (%)
Place of birth for the foreign-born population - Portugal (%)
Place of birth for the foreign-born population - Spain (%)
Place of birth for the foreign-born population - Other Southern Europe (%)
Place of birth for the foreign-born population - Albania (%)
Place of birth for the foreign-born population - Belarus (%)
Place of birth for the foreign-born population - Bosnia and Herzegovina (%)
Place of birth for the foreign-born population - Bulgaria (%)
Place of birth for the foreign-born population - Croatia (%)
Place of birth for the foreign-born population - Czechoslovakia (%)
Place of birth for the foreign-born population - Hungary (%)
Place of birth for the foreign-born population - Latvia (%)
Place of birth for the foreign-born population - Lithuania (%)
Place of birth for the foreign-born population - North Macedonia (Macedonia) (%)
Place of birth for the foreign-born population - Moldova (%)
Place of birth for the foreign-born population - Poland (%)
Place of birth for the foreign-born population - Romania (%)
Place of birth for the foreign-born population - Russia (%)
Place of birth for the foreign-born population - Serbia (%)
Place of birth for the foreign-born population - Ukraine (%)
Place of birth for the foreign-born population - Other Eastern Europe (%)
Place of birth for the foreign-born population - China (%)
Place of birth for the foreign-born population - Hong Kong (%)
Place of birth for the foreign-born population - Taiwan (%)
Place of birth for the foreign-born population - Japan (%)
Place of birth for the foreign-born population - Korea (%)
Place of birth for the foreign-born population - Other Eastern Asia (%)
Place of birth for the foreign-born population - Afghanistan (%)
Place of birth for the foreign-born population - Bangladesh (%)
Place of birth for the foreign-born population - India (%)
Place of birth for the foreign-born population - Iran (%)
Place of birth for the foreign-born population - Kazakhstan (%)
Place of birth for the foreign-born population - Nepal (%)
Place of birth for the foreign-born population - Pakistan (%)
Place of birth for the foreign-born population - Sri Lanka (%)
Place of birth for the foreign-born population - Uzbekistan (%)
Place of birth for the foreign-born population - Other South Central Asia (%)
Place of birth for the foreign-born population - Burma (%)
Place of birth for the foreign-born population - Cambodia (%)
Place of birth for the foreign-born population - Indonesia (%)
Place of birth for the foreign-born population - Laos (%)
Place of birth for the foreign-born population - Malaysia (%)
Place of birth for the foreign-born population - Philippines (%)
Place of birth for the foreign-born population - Singapore (%)
Place of birth for the foreign-born population - Thailand (%)
Place of birth for the foreign-born population - Vietnam (%)
Place of birth for the foreign-born population - Other South Eastern Asia (%)
Place of birth for the foreign-born population - Armenia (%)
Place of birth for the foreign-born population - Iraq (%)
Place of birth for the foreign-born population - Israel (%)
Place of birth for the foreign-born population - Jordan (%)
Place of birth for the foreign-born population - Kuwait (%)
Place of birth for the foreign-born population - Lebanon (%)
Place of birth for the foreign-born population - Saudi Arabia (%)
Place of birth for the foreign-born population - Syria (%)
Place of birth for the foreign-born population - Turkey (%)
Place of birth for the foreign-born population - Yemen (%)
Place of birth for the foreign-born population - Other Western Asia (%)
Place of birth for the foreign-born population - Eritrea (%)
Place of birth for the foreign-born population - Ethiopia (%)
Place of birth for the foreign-born population - Kenya (%)
Place of birth for the foreign-born population - Somalia (%)
Place of birth for the foreign-born population - Uganda (%)
Place of birth for the foreign-born population - Zimbabwe (%)
Place of birth for the foreign-born population - Other Eastern Africa (%)
Place of birth for the foreign-born population - Cameroon (%)
Place of birth for the foreign-born population - Congo (%)
Place of birth for the foreign-born population - Democratic Republic of Congo (Zaire) (%)
Place of birth for the foreign-born population - Other Middle Africa (%)
Place of birth for the foreign-born population - Egypt (%)
Place of birth for the foreign-born population - Morocco (%)
Place of birth for the foreign-born population - Sudan (%)
Place of birth for the foreign-born population - Other Northern Africa (%)
Place of birth for the foreign-born population - South Africa (%)
Place of birth for the foreign-born population - Other Southern Africa (%)
Place of birth for the foreign-born population - Cabo Verde (%)
Place of birth for the foreign-born population - Ghana (%)
Place of birth for the foreign-born population - Liberia (%)
Place of birth for the foreign-born population - Nigeria (%)
Place of birth for the foreign-born population - Senegal (%)
Place of birth for the foreign-born population - Sierra Leone (%)
Place of birth for the foreign-born population - Other Western Africa (%)
Place of birth for the foreign-born population - Australia (%)
Place of birth for the foreign-born population - New Zealand (%)
Place of birth for the foreign-born population - Fiji (%)
Place of birth for the foreign-born population - Micronesia (%)
Place of birth for the foreign-born population - Bahamas (%)
Place of birth for the foreign-born population - Barbados (%)
Place of birth for the foreign-born population - Cuba (%)
Place of birth for the foreign-born population - Dominica (%)
Place of birth for the foreign-born population - Dominican Republic (%)
Place of birth for the foreign-born population - Grenada (%)
Place of birth for the foreign-born population - Haiti (%)
Place of birth for the foreign-born population - Jamaica (%)
Place of birth for the foreign-born population - St. Vincent and the Grenadines (%)
Place of birth for the foreign-born population - Trinidad and Tobago (%)
Place of birth for the foreign-born population - West Indies (%)
Place of birth for the foreign-born population - Other Caribbean (%)
Place of birth for the foreign-born population - Belize (%)
Place of birth for the foreign-born population - Costa Rica (%)
Place of birth for the foreign-born population - El Salvador (%)
Place of birth for the foreign-born population - Guatemala (%)
Place of birth for the foreign-born population - Honduras (%)
Place of birth for the foreign-born population - Mexico (%)
Place of birth for the foreign-born population - Nicaragua (%)
Place of birth for the foreign-born population - Panama (%)
Place of birth for the foreign-born population - Other Central America (%)
Place of birth for the foreign-born population - Argentina (%)
Place of birth for the foreign-born population - Bolivia (%)
Place of birth for the foreign-born population - Brazil (%)
Place of birth for the foreign-born population - Chile (%)
Place of birth for the foreign-born population - Colombia (%)
Place of birth for the foreign-born population - Ecuador (%)
Place of birth for the foreign-born population - Guyana (%)
Place of birth for the foreign-born population - Peru (%)
Place of birth for the foreign-born population - Uruguay (%)
Place of birth for the foreign-born population - Venezuela (%)
Place of birth for the foreign-born population - Other South America (%)
Place of birth for the foreign-born population - Canada (%)
Place of birth for the foreign-born population - Other Northern America (%)
Place of birth for the foreign-born population - Other (%)
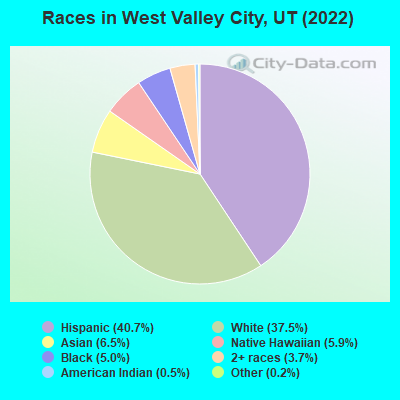
According to 2022 data, the most numerous races in West Valley City, UT are White alone (51,288 residents), Hispanic (55,594 residents), and Two or more races (5,034 residents). 53.6% of West Valley City residents speak English at home. 23.2% of West Valley City, UT residents are foreign-born (15.1% born in Latin America, 3.6% born in Asia), which is 65.6% greater than the foreign-born rate of 8.0% across the entire state of Utah.
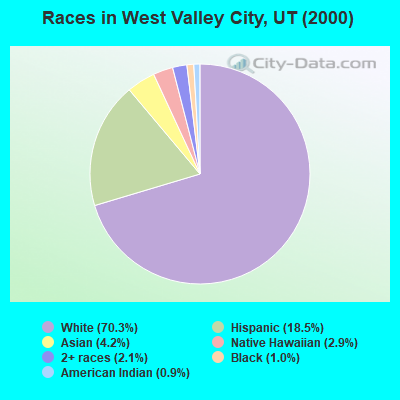
Race distribution in West Valley City
2000 2022
76,545 70.3% White alone 20,126 18.5% Hispanic 4,614 4.2% Asian alone 3,118 2.9% Native Hawaiian and Other 2,314 2.1% Two or more races 1,090 1.0% Black alone 1,014 0.9% American Indian alone 75 0.07% Other race alone
55,594 40.7% Hispanic 51,288 37.5% White alone 8,938 6.5% Asian alone 8,086 5.9% Native Hawaiian and Other 6,788 5.0% Black alone 5,034 3.7% Two or more races 624 0.5% American Indian alone 287 0.2% Other race alone
2000 2022
1,904,265 85.3% White alone 201,559 9.0% Hispanic 36,483 1.6% Asian alone 31,308 1.4% Two or more races 26,663 1.2% American Indian alone 14,806 0.7% Native Hawaiian and Other 16,137 0.7% Black alone 1,948 0.09% Other race alone
2,557,466 75.6% White alone 512,086 15.1% Hispanic 119,308 3.5% Two or more races 82,388 2.4% Asian alone 36,978 1.1% Native Hawaiian and Other 34,873 1.0% Black alone 22,803 0.7% American Indian alone 14,898 0.4% Other race alone
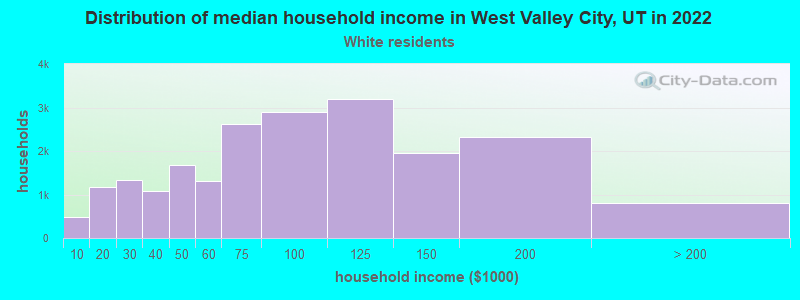
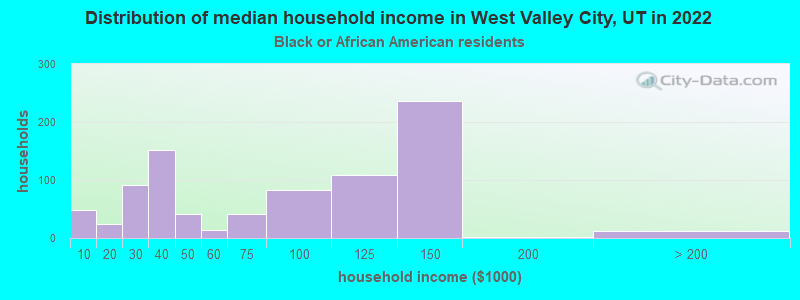
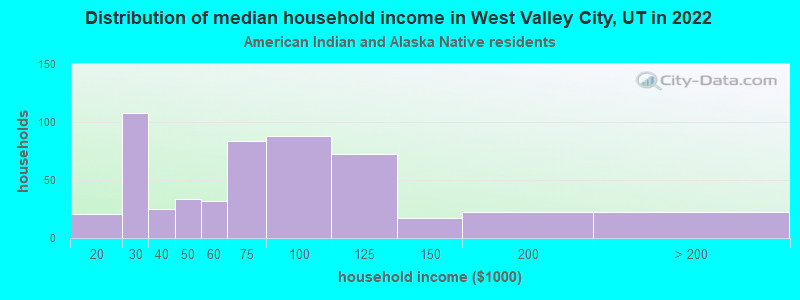
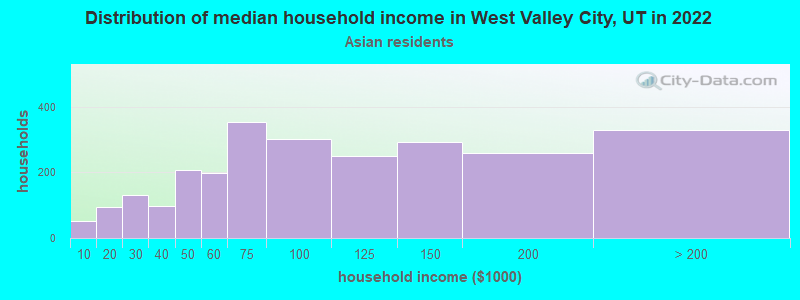
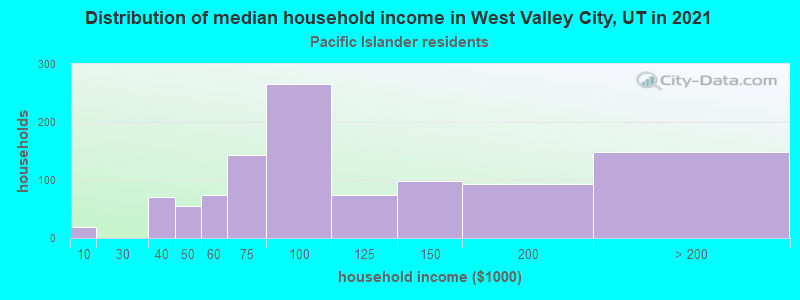
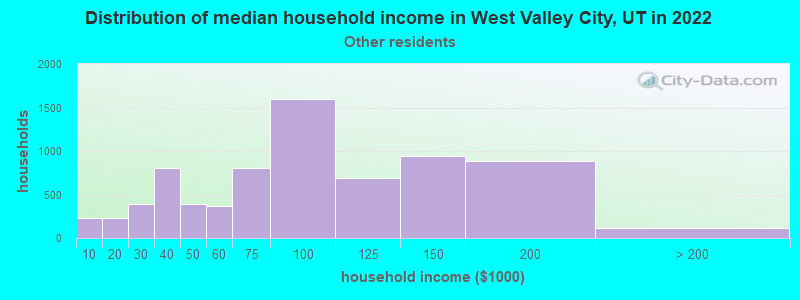
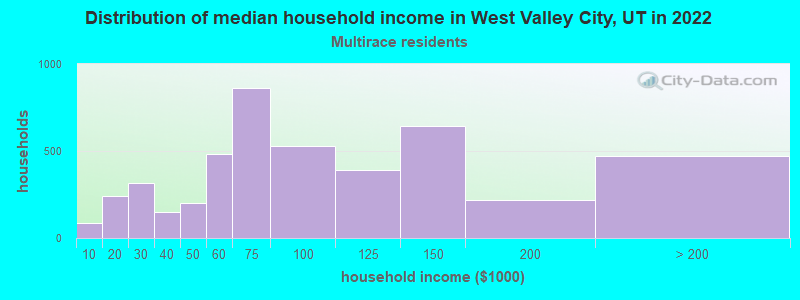
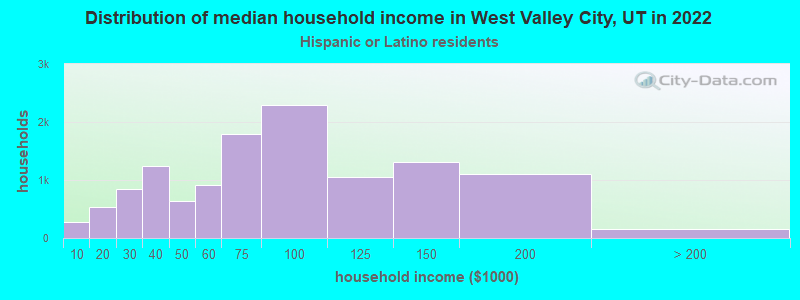
Income and house value in West Valley City Median household income in 2022 $85,048 White non-Hispanic householders$131,423 Black householders$123,886 American Indian and Alaska Native householders$99,971 Asian householders$81,572 Native Hawaiian and other Pacific Islander householders$90,447 Some other race householders$64,455 Two or more races householders$69,690 Hispanic or Latino race householdersMedian 2022 house value $425,282 White Non-Hispanic householders$443,471 Black or African American householders$400,149 American Indian or Alaska Native householders $453,061 Asian householders$416,022 Native Hawaiian and other Pacific Islander householders$419,991 Some other race householders$434,211 Two or more races householders$418,007 Hispanic or Latino householders
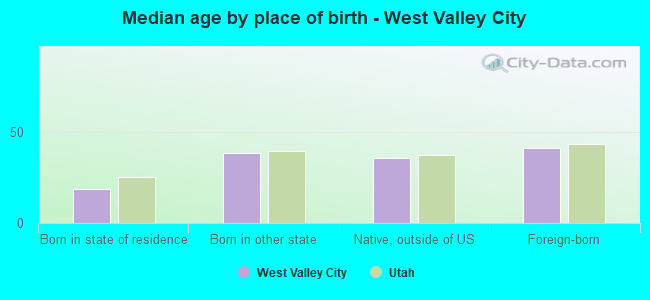
Median age by race in West Valley City
39.4 Median age for White residents37.0 41.6 14.0 Median age for Black or African American residents10.7 15.6 33.1 Median age for American Indian / Alaska Native residents25.7 41.9 40.9 Median age for Asian residents34.7 43.8 27.0 Median age for Native Hawaiian / Pacific Islander residents19.5 32.5 19.7 Median age for Other race residents19.9 19.6 22.6 Median age for Two or more races residents22.6 22.5 41.6 Median age for White alone residents39.7 42.8 20.8 Median age for Hispanic or Latino residents20.7 20.9
Owner/renter occupied households by race in West Valley City
House owners and renters - White residents 16,663 79.9% Owner occupied4,180 20.1% Renter occupiedHouse owners and renters - Black or African American residents 226 32.6% Owner occupied469 67.4% Renter occupiedHouse owners and renters - American Indian / Alaska Native residents 434 74.8% Owner occupied146 25.2% Renter occupiedHouse owners and renters - Asian residents 2,266 85.1% Owner occupied396 14.9% Renter occupiedHouse owners and renters - Native Hawaiian / Pacific Islander residents 660 41.1% Owner occupied944 58.9% Renter occupiedHouse owners and renters - Other race residents 5,092 68.3% Owner occupied2,362 31.7% Renter occupiedHouse owners and renters - Two or more races residents 2,551 56.2% Owner occupied1,992 43.8% Renter occupiedHouse owners and renters - White alone residents 16,068 81.1% Owner occupied3,736 18.9% Renter occupiedHouse owners and renters - Hispanic or Latino residents 7,479 61.6% Owner occupied4,654 38.4% Renter occupied
Language usage in West Valley City
English speakers - Total 53.6% of residents of West Valley City speak English at home.
30.3% of residents speak Spanish at home 22,084 58.9% Speak English very well15,388 41.1% Speak English less than very well16.1% of residents speak other language at home 13,478 67.4% Speak English very well6,513 32.6% Speak English less than very well
English speakers - Born in the United States 70.1% of residents of West Valley City speak English at home.
23.3% of residents speak Spanish at home 4,757 99.2% Speak English very well40 0.8% Speak English less than very well6.6% of residents speak other language at home 1,265 93.6% Speak English very well87 6.4% Speak English less than very well
English speakers - Native, born elsewhere 54.5% of residents of West Valley City speak English at home.
8.9% of residents speak Spanish at home 42 29.2% Speak English very well102 70.8% Speak English less than very well36.7% of residents speak other language at home 596 100.0% Speak English very well
English speakers - Foreign-born 8.4% of residents of West Valley City speak English at home.
57.5% of residents speak Spanish at home 5,480 29.8% Speak English very well12,918 70.2% Speak English less than very well34.1% of residents speak other language at home 5,325 48.7% Speak English very well5,604 51.3% Speak English less than very well
White (Caucasian) - Speak only English Native:
93.9% (48,044)Foreign-born:
30.8% (564)
White (Caucasian) - Speak another language Native:
6.1% (3,138)Foreign-born:
69.2% (1,270)
Black or African American - Speak only English Native:
64.9% (1,310)Foreign-born:
4.3% (40)
Black or African American - Speak another language Native:
38.5% (778)Foreign-born:
89.8% (830)
American Indian / Alaska Native - Speak only English Native:
41.0% (460)Foreign-born:
6.4% (77)
American Indian / Alaska Native - Speak another language Native:
70.0% (784)Foreign-born:
89.8% (1,079)
Asian - Speak only English Native:
32.4% (702)Foreign-born:
16.1% (998)
Asian - Speak another language Native:
67.6% (1,462)Foreign-born:
83.9% (5,203)
Native Hawaiian / Pacific Islander - Speak only English Native:
45.0% (2,067)Foreign-born:
4.6% (142)
Native Hawaiian / Pacific Islander - Speak another language Native:
55.0% (2,525)Foreign-born:
95.4% (2,977)
Other race - Speak only English Native:
20.1% (3,504)Foreign-born:
5.9% (856)
Other race - Speak another language Native:
79.9% (13,966)Foreign-born:
94.1% (13,709)
Two or more races - Speak only English Native:
77.1% (8,690)Foreign-born:
3.6% (133)
Two or more races - Speak another language Native:
22.9% (2,581)Foreign-born:
96.4% (3,513)
White alone - Speak only English Native:
95.3% (45,515)Foreign-born:
46.3% (564)
White alone - Speak another language Native:
4.7% (2,220)Foreign-born:
53.7% (654)
Hispanic or Latino - Speak only English Native:
37.5% (10,686)Foreign-born:
5.3% (1,033)
Hispanic or Latino - Speak another language Native:
62.5% (17,804)Foreign-born:
94.7% (18,440)
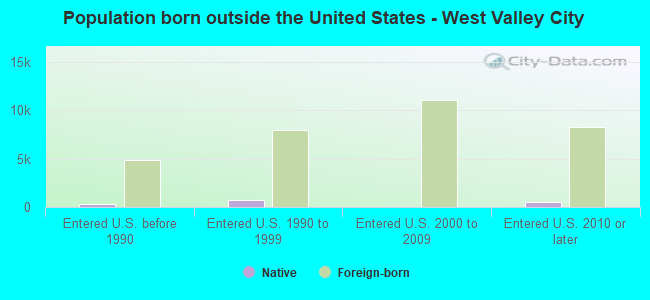
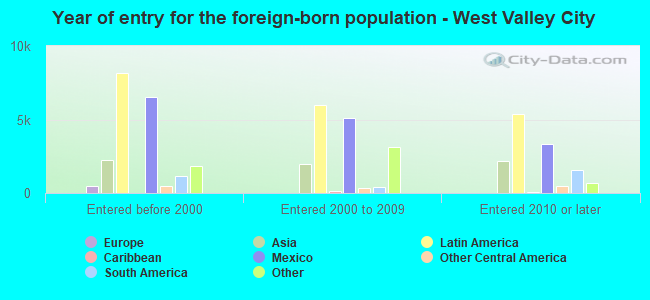
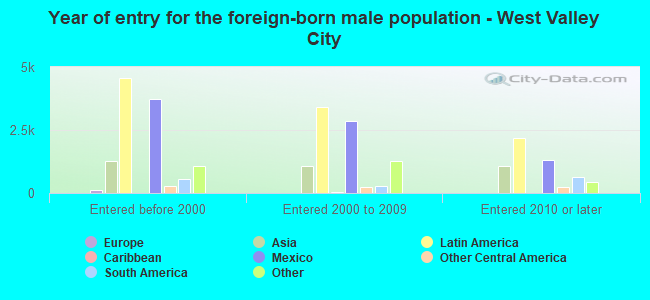
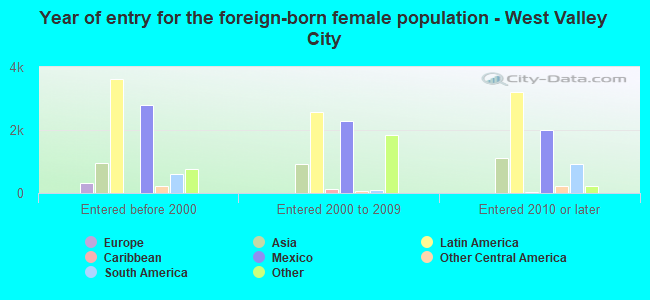
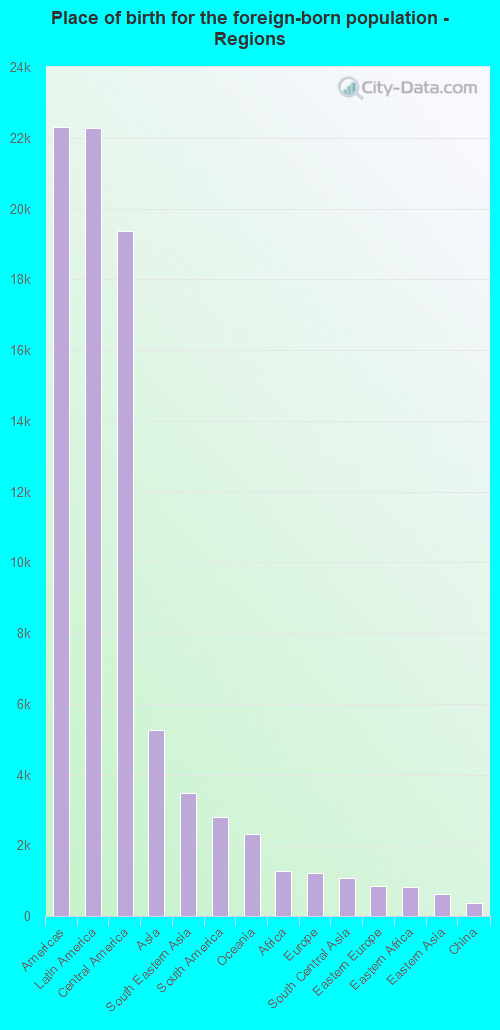
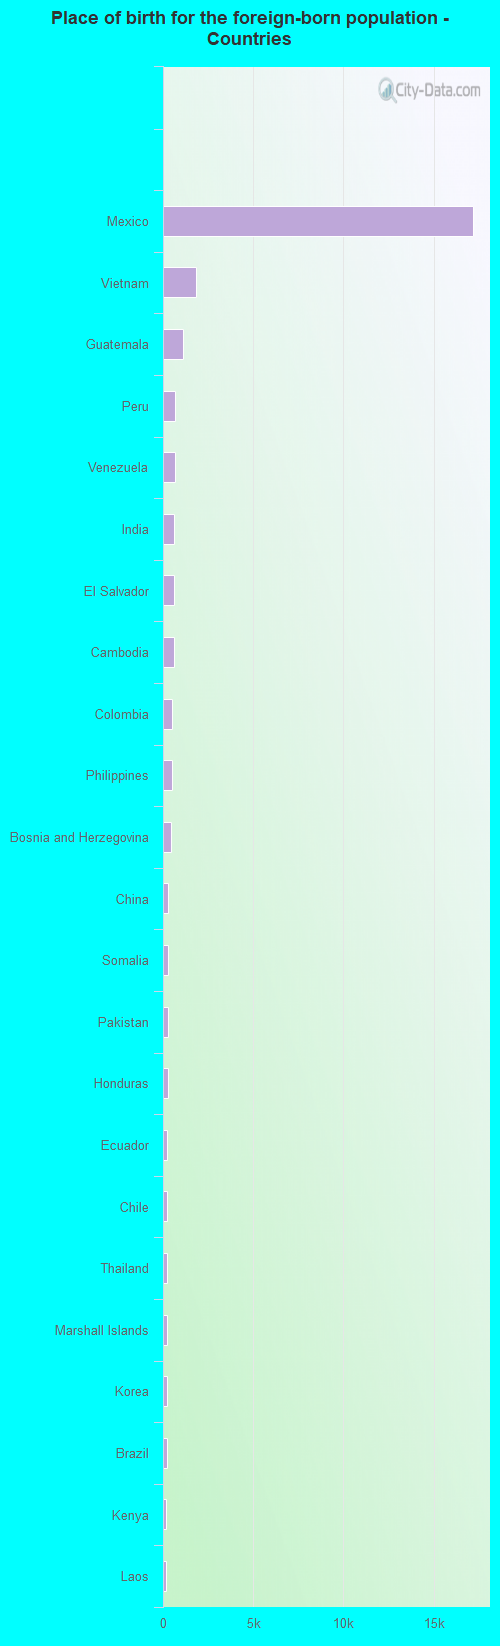
Foreign-born residents in West Valley City 32,408 residents are foreign born (15.1% Latin America , 3.6% Asia ).
Marital status for residents in West Valley City Marital status - White (Caucasian) population 15 years and over
Males 34.2% Never married50.6% Now married1.7% Separated2.5% Widowed11.0% DivorcedFemales 24.2% Never married46.4% Now married2.7% Separated7.7% Widowed19.0% DivorcedWomen who gave birth in the past 12 months Now married:
95.7% (959)Unmarried:
4.3% (43)
Women who did not give birth in the past 12 months Now married:
44.3% (5,108)Unmarried:
55.7% (6,428)
Marital status - Black or African American population 15 years and over
Males 42.6% Never married52.5% Now married2.0% Separated1.8% Widowed1.0% DivorcedFemales 57.1% Never married33.0% Now married0.0% Separated7.0% Widowed2.9% DivorcedWomen who gave birth in the past 12 months Now married:
100.0% (95)Unmarried:
0.0% (0)
Women who did not give birth in the past 12 months Now married:
29.2% (273)Unmarried:
70.8% (662)
Marital status - American Indian / Alaska Native population 15 years and over
Males 55.4% Never married33.7% Now married1.0% Separated0.8% Widowed9.1% DivorcedFemales 36.4% Never married50.0% Now married6.9% Separated4.9% Widowed1.7% DivorcedWomen who did not give birth in the past 12 months Now married:
45.3% (266)Unmarried:
54.7% (321)
Marital status - Asian population 15 years and over
Males 47.5% Never married43.4% Now married0.0% Separated0.0% Widowed9.1% DivorcedFemales 29.8% Never married43.8% Now married1.8% Separated12.3% Widowed12.3% DivorcedWomen who gave birth in the past 12 months Now married:
72.8% (78)Unmarried:
27.2% (29)
Women who did not give birth in the past 12 months Now married:
45.2% (930)Unmarried:
54.8% (1,128)
Marital status - Native Hawaiian / Pacific Islander population 15 years and over
Males 27.9% Never married59.3% Now married7.8% Separated1.0% Widowed4.1% DivorcedFemales 31.2% Never married55.0% Now married4.9% Separated3.0% Widowed5.9% DivorcedWomen who gave birth in the past 12 months Now married:
100.0% (14)Unmarried:
0.0% (0)
Women who did not give birth in the past 12 months Now married:
50.3% (756)Unmarried:
49.7% (745)
Marital status - Other race population 15 years and over
Males 36.3% Never married54.9% Now married5.2% Separated0.0% Widowed3.6% DivorcedFemales 39.2% Never married48.4% Now married2.7% Separated2.1% Widowed7.7% DivorcedWomen who gave birth in the past 12 months Now married:
91.9% (886)Unmarried:
8.1% (78)
Women who did not give birth in the past 12 months Now married:
43.5% (3,997)Unmarried:
56.5% (5,199)
Marital status - Two or more races population 15 years and over
Males 55.6% Never married37.7% Now married0.9% Separated0.0% Widowed5.8% DivorcedFemales 49.8% Never married37.2% Now married1.1% Separated0.0% Widowed11.8% DivorcedWomen who gave birth in the past 12 months Now married:
50.5% (239)Unmarried:
49.5% (234)
Women who did not give birth in the past 12 months Now married:
33.3% (1,417)Unmarried:
66.7% (2,832)
Marital status - White alone, not Hispanic / Latino population 15 years and over
Males 32.8% Never married51.6% Now married1.8% Separated2.7% Widowed11.2% DivorcedFemales 23.4% Never married46.8% Now married2.7% Separated8.1% Widowed19.0% DivorcedWomen who gave birth in the past 12 months Now married:
95.3% (869)Unmarried:
4.7% (43)
Women who did not give birth in the past 12 months Now married:
45.5% (4,826)Unmarried:
54.5% (5,779)
Marital status - Hispanic or Latino population 15 years and over
Males 42.7% Never married49.3% Now married3.4% Separated0.0% Widowed4.6% DivorcedFemales 40.7% Never married45.8% Now married2.4% Separated1.7% Widowed9.3% DivorcedWomen who gave birth in the past 12 months Now married:
74.9% (1,063)Unmarried:
25.1% (356)
Women who did not give birth in the past 12 months Now married:
41.7% (5,508)Unmarried:
58.3% (7,699)
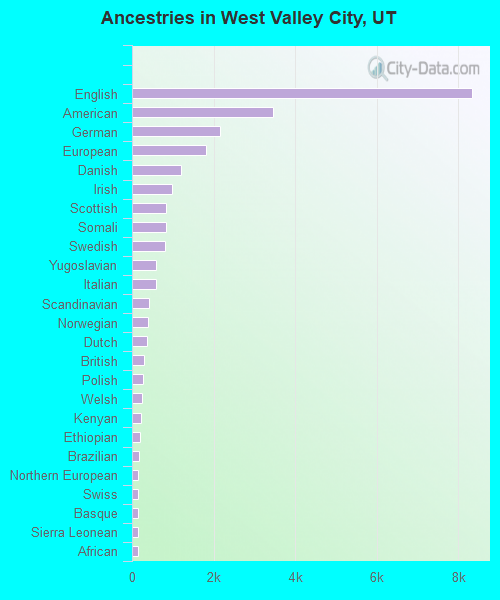
Ancestries in West Valley City
8,331 9.9% English3,444 4.1% American2,165 2.6% German1,821 2.2% European1,203 1.4% Danish980 1.2% Irish830 1.0% Scottish830 1.0% Somali799 1.0% Swedish592 0.7% Yugoslavian591 0.7% Italian416 0.5% Scandinavian391 0.5% Norwegian371 0.4% Dutch282 0.3% British280 0.3% Polish249 0.3% Welsh217 0.3% Kenyan191 0.2% Ethiopian176 0.2% Brazilian148 0.2% Northern European144 0.2% Swiss140 0.2% Basque140 0.2% Sierra Leonean137 0.2% African107 0.1% French105 0.1% Iranian99 0.1% Belizean96 0.1% Scotch-Irish93 0.1% Sudanese93 0.1% Greek88 0.1% Egyptian79 0.09% Serbian78 0.09% Russian73 0.09% Haitian56 0.07% Slavic55 0.07% Liberian52 0.06% Portuguese38 0.05% Eastern European28 0.03% Romanian28 0.03% Canadian25 0.03% Hungarian24 0.03% French Canadian19 0.02% Ghanaian18 0.02% Iraqi17 0.02% Armenian16 0.02% Croatian15 0.02% Slovene14 0.02% Finnish12 0.01% Ukrainian9 0.01% Czech9 0.01% Luxembourger8 0.01% Belgian7 0.01% Maltese7 0.01% Senegalese6 0.01% Lebanese
Geographical mobility in West Valley City Same house 1 year ago 51,589 93.4% White (Caucasian)3,389 99.2% Black or African American1,284 70.0% American Indian / Alaska Native6,927 87.9% Asian5,183 79.4% Native Hawaiian / Pacific Islander30,633 84.3% Other race14,126 79.5% Two or more races46,969 92.8% White alone, not Hispanic / Latino46,731 87.0% Hispanic or LatinoMoved within same county 3,161 5.7% White / Caucasian112 3.3% Black or African American238 13.0% American Indian / Alaska Native801 10.2% Asian766 11.7% Native Hawaiian / Pacific Islander4,284 11.8% Other race2,731 15.4% Two or more races3,161 6.2% White alone, not Hispanic / Latino5,514 10.3% Hispanic or LatinoMoved within same state 193 0.3% White / Caucasian9 0.3% Black or African American116 6.3% American Indian / Alaska Native64 0.8% Asian22 0.3% Native Hawaiian / Pacific Islander834 2.3% Other race177 1.0% Two or more races193 0.4% White alone, not Hispanic / Latino878 1.6% Hispanic or LatinoMoved from different state 194 0.4% White / Caucasian70 2.1% Black or African American98 5.3% American Indian / Alaska Native28 0.4% Asian71 1.1% Native Hawaiian / Pacific Islander382 2.2% Two or more races194 0.4% White alone, not Hispanic / LatinoMoved from abroad 97 0.2% White14 0.4% Black or African American63 3.4% American Indian / Alaska Native64 0.8% Asian96 1.5% Native Hawaiian / Pacific Islander602 1.7% Other race374 2.1% Two or more races97 0.2% White alone, not Hispanic / Latino602 1.1% Hispanic or Latino
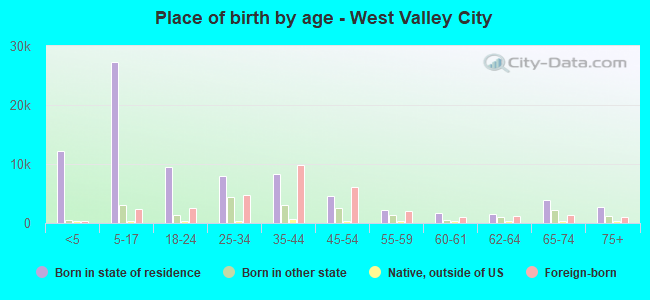
Children Nativity (place of birth) in West Valley City
Children under 6 years - Living with two parents Both parents native 3,180 100.0% NativeBoth parents foreign-born 2,988 98.1% Native57 1.9% Foreign-bornOne native, one foreign-born parent 2,150 100.0% NativeChildren under 6 years - Living with one parent Native parent 2,191 100.0% NativeForeign-born parent 2,730 98.1% Native53 1.9% Foreign-bornChildren 6 to 17 years - Living with two parents Both parents native 6,865 96.9% Native223 3.1% Foreign-bornBoth parents foreign-born 10,460 94.7% Native590 5.3% Foreign-bornOne native, one foreign-born parent 5,091 100.0% NativeChildren 6 to 17 years - Living with one parent Native parent 3,076 100.0% NativeForeign-born parent 3,429 57.3% Native2,556 42.7% Foreign-born
Place of birth for residents in West Valley City 22,312 Americas22,266 Latin America19,369 Central America5,272 Asia3,470 South Eastern Asia2,808 South America2,318 Oceania1,284 Africa1,221 Europe1,075 South Central Asia860 Eastern Europe806 Eastern Africa631 Eastern Asia363 China193 Western Europe164 Western Africa129 Northern Europe128 Northern Africa102 Middle Africa95 Western Asia88 Caribbean82 Southern Africa76 Australia and New Zealand Subregion45 Northern America37 Southern Europe17,202 Mexico1,832 Vietnam1,087 Guatemala680 Peru680 Venezuela622 India607 El Salvador598 Cambodia500 Colombia480 Philippines460 Bosnia and Herzegovina303 China293 Somalia292 Pakistan291 Honduras239 Ecuador239 Chile217 Thailand211 Marshall Islands203 Korea194 Brazil165 Kenya159 Laos140 Burma (Myanmar)131 Sierra Leone128 Eritrea120 Fiji104 Belize102 Democratic Republic of Congo (Zaire)101 Argentina99 Germany91 Sudan91 Bolivia87 England83 Iraq82 South Africa77 Poland75 Netherlands65 Dominican Republic64 Japan64 Uruguay61 Bhutan52 Uganda49 Iran47 Hong Kong46 Croatia46 New Zealand45 Nicaragua45 Canada36 Indonesia31 Bangladesh31 Tanzania30 Spain29 Costa Rica29 Australia27 Serbia26 Liberia26 Egypt23 Romania23 Cuba19 Ethiopia18 Sweden18 Afghanistan14 Scotland11 Taiwan10 Morocco9 Jordan9 Zimbabwe7 Denmark6 Italy6 Bulgaria6 Senegal5 Malaysia5 France5 Belgium1 United Arab Emirates1 Turkey1 United Kingdom
Grandparents responsible for own grandchildren in West Valley City
Grandparents (30 to 59 years) White / Caucasian 146 15.5% Responsible for grandchildren797 84.5% Not responsible for grandchildrenBlack or African American 3 9.5% Responsible for grandchildren25 90.5% Not responsible for grandchildrenAsian 201 100.0% Not responsible for grandchildrenNative Hawaiian / Pacific Islander 54 30.1% Responsible for grandchildren126 69.9% Not responsible for grandchildrenOther race 185 23.3% Responsible for grandchildren610 76.7% Not responsible for grandchildrenTwo or more races 71 43.8% Responsible for grandchildren91 56.2% Not responsible for grandchildrenWhite alone, not Hispanic / Latino 81 11.1% Responsible for grandchildren648 88.9% Not responsible for grandchildrenHispanic or Latino 293 27.1% Responsible for grandchildren788 72.9% Not responsible for grandchildrenGrandparents (60 years and over) White / Caucasian 603 40.9% Responsible for grandchildren872 59.1% Not responsible for grandchildrenBlack or African American 8 6.0% Responsible for grandchildren121 94.0% Not responsible for grandchildrenAsian 34 11.9% Responsible for grandchildren249 88.1% Not responsible for grandchildrenNative Hawaiian / Pacific Islander 42 19.2% Responsible for grandchildren177 80.8% Not responsible for grandchildrenOther race 29 5.4% Responsible for grandchildren507 94.6% Not responsible for grandchildrenTwo or more races 27 9.1% Responsible for grandchildren270 90.9% Not responsible for grandchildrenWhite alone, not Hispanic / Latino 595 43.8% Responsible for grandchildren763 56.2% Not responsible for grandchildrenHispanic or Latino 104 10.6% Responsible for grandchildren871 89.4% Not responsible for grandchildren