Races in West Valley, Washington (WA) Detailed Stats
Ancestries, Foreign-born residents, place of birth

Recent posts about races in West Valley, Washington on our local forum with over 2,400,000 registered users:
 | West Valley vs. Terrace Heights vs. Selah (4 replies) |
| Yakima Bad! LMAO (24 replies) |
| Unbiased review on yakima, wa. Just visited 9/3/2015 (3 replies) |
| Yakima to Ellensburg. Where is the best place to live in this area??? (26 replies) |
| Help with Relocation-- South Hills or Liberty Lake (20 replies) |
| spokane, spokane and more spokane (16 replies) |
4.0% of West Valley, WA residents are foreign-born (1.6% born in Asia, 1.1% born in Latin America, 0.7% born in Europe, 0.6% born in North America), which is 273.5% less than the foreign-born rate of 15.0% across the entire state of Washington.
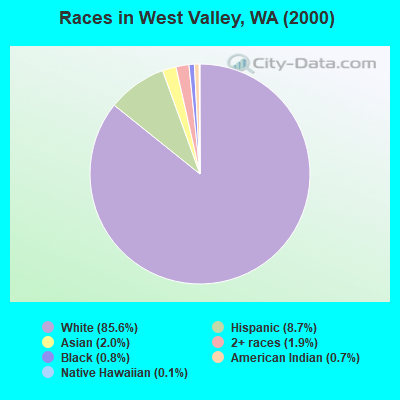
Race distribution in West Valley

- 8,93585.6%White alone
- 9108.7%Hispanic
- 2072.0%Asian alone
- 2021.9%Two or more races
- 800.8%Black alone
- 780.7%American Indian alone
- 110.1%Native Hawaiian and Other
Pacific Islander alone - 100.10%Other race alone
2000
2022
-
- 4,652,49078.9%White alone
- 441,5097.5%Hispanic
- 319,4015.4%Asian alone
- 184,6313.1%Black alone
- 175,9263.0%Two or more races
- 85,3961.4%American Indian alone
- 22,7790.4%Native Hawaiian and Other
Pacific Islander alone - 11,9890.2%Other race alone

-
- 4,941,45663.5%White alone
- 1,093,31314.0%Hispanic
- 755,8329.7%Asian alone
- 523,4486.7%Two or more races
- 299,5373.8%Black alone
- 69,0240.9%American Indian alone
- 52,2310.7%Native Hawaiian and Other
Pacific Islander alone - 50,9450.7%Other race alone

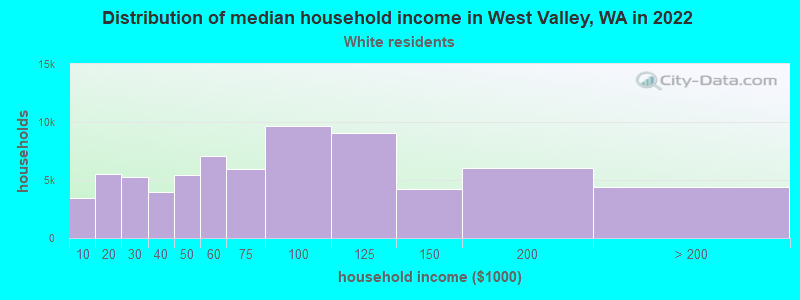
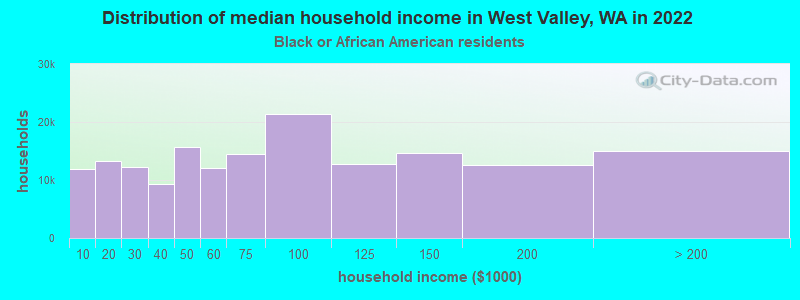
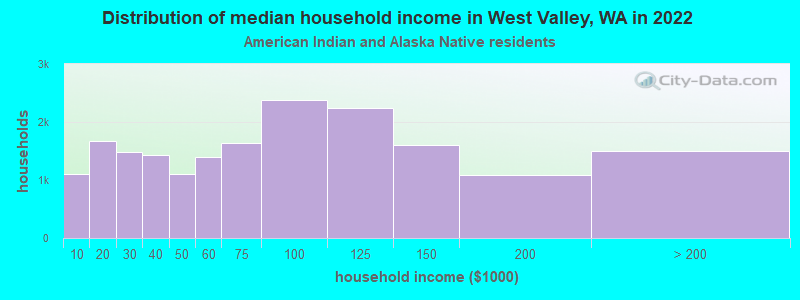
Income and house value in West Valley
- Median household income in 2022
- $97,537White non-Hispanic householders
- $101,306Black householders
- $74,398American Indian and Alaska Native householders
- $114,346Asian householders
- $75,959Some other race householders
- $85,370Two or more races householders
- $89,219Hispanic or Latino race householders
- Median 2022 house value
- $436,567White Non-Hispanic householders
- $335,261Black or African American householders
- $411,100American Indian or Alaska Native householders
- $452,518Asian householders
- $136,847Some other race householders
- $469,869Two or more races householders
- $390,111Hispanic or Latino householders
Household income for White non-Hispanic householders
Household income for Black householders
Household income for American Indian and Alaska Native householders
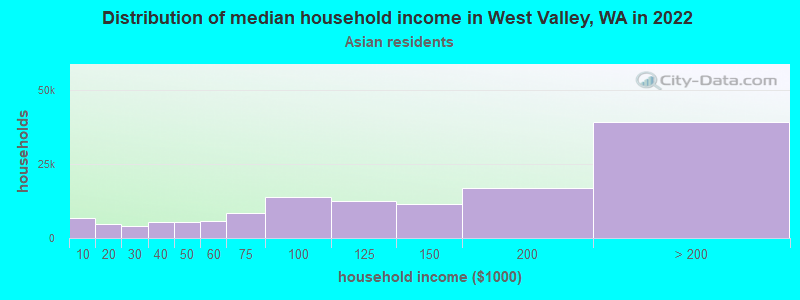
Household income for Asian householders
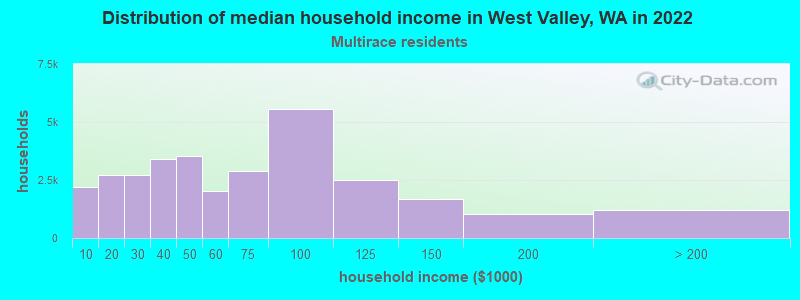
Household income for Two or more races householders
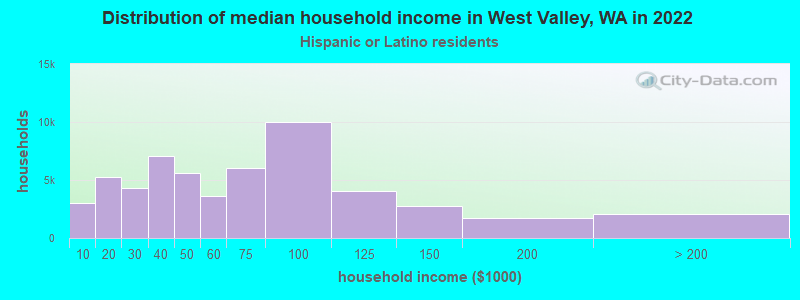
Household income for Hispanic or Latino race householders
Foreign-born residents in West Valley
419 residents are foreign born (1.6% Asia, 1.1% Latin America, 0.7% Europe, 0.6% North America).
| This city: | 4.0% |
| Washington: | 10.4% |
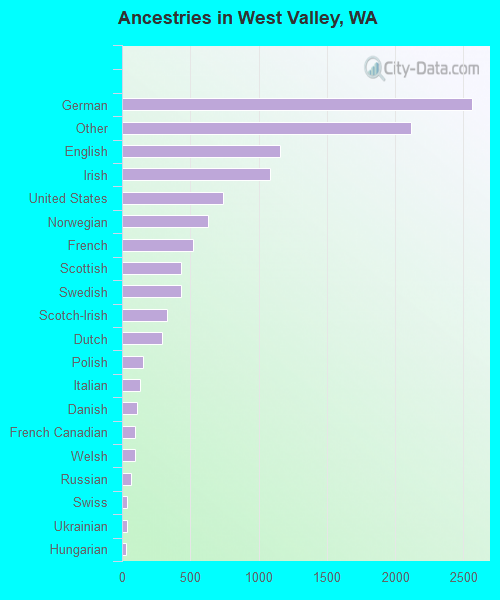
Ancestries in West Valley

- 2,55923.0%German
- 2,11519.0%Other
- 1,15610.4%English
- 1,0809.7%Irish
- 7396.7%United States
- 6285.7%Norwegian
- 5224.7%French
- 4333.9%Scottish
- 4293.9%Swedish
- 3262.9%Scotch-Irish
- 2962.7%Dutch
- 1541.4%Polish
- 1321.2%Italian
- 1111.0%Danish
- 920.8%French Canadian
- 920.8%Welsh
- 630.6%Russian
- 390.4%Swiss
- 370.3%Ukrainian
- 260.2%Hungarian
- 230.2%Greek
- 210.2%Arab
- 170.2%Czech
- 100.09%Slovak
- 80.07%Portuguese
- 40.04%Subsaharan African
Zip codes: 98908.