Races in Westland, Michigan (MI) Detailed Stats
Data:
Races - White alone (%)
Races - White alone (% change since 2000)
Races - Black alone (%)
Races - Black alone (% change since 2000)
Races - American Indian alone (%)
Races - American Indian alone (% change since 2000)
Races - Asian alone (%)
Races - Asian alone (% change since 2000)
Races - Hispanic (%)
Races - Hispanic (% change since 2000)
Races - Native Hawaiian and Other Pacific Islander alone (%)
Races - Native Hawaiian and Other Pacific Islander alone (% change since 2000)
Races - Two or more races(%)
Races - Two or more races(% change since 2000)
Races - Other race alone (%)
Races - Other race alone (% change since 2000)
Racial diversity
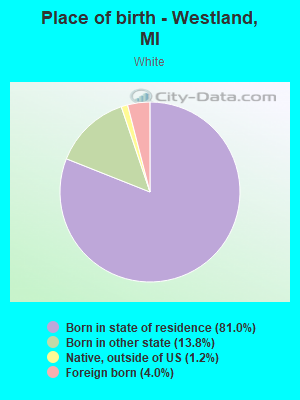
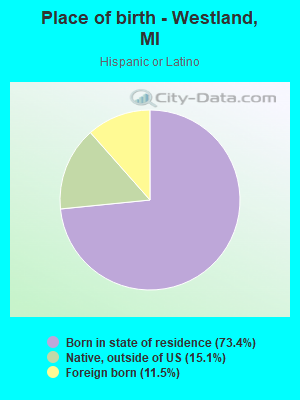
Place of birth - Born in state of residence (%)
Place of birth - Born in state of residence (%) - White
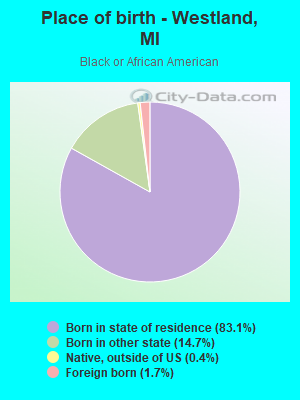
Place of birth - Born in state of residence (%) - Black or African American
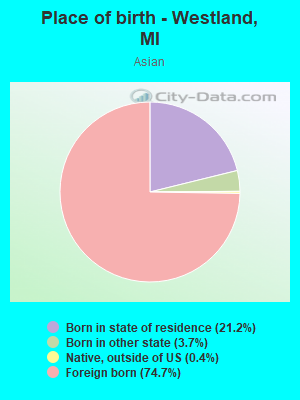
Place of birth - Born in state of residence (%) - Asian
Place of birth - Born in state of residence (%) - Hispanic or Latino
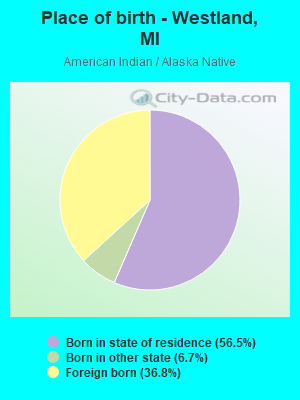
Place of birth - Born in state of residence (%) - American Indian and Alaska Native
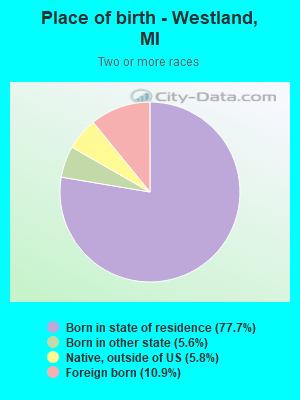
Place of birth - Born in state of residence (%) - Multirace
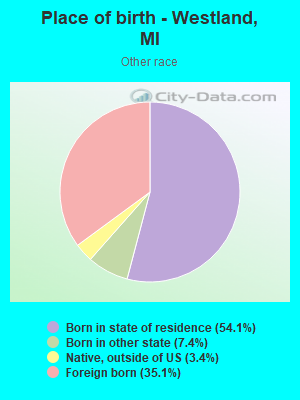
Place of birth - Born in state of residence (%) - Other Race
Place of birth - Born in other state (%)
Place of birth - Born in other state (%) - White
Place of birth - Born in other state (%) - Black or African American
Place of birth - Born in other state (%) - Asian
Place of birth - Born in other state (%) - Hispanic or Latino
Place of birth - Born in other state (%) - American Indian and Alaska Native
Place of birth - Born in other state (%) - Multirace
Place of birth - Born in other state (%) - Other Race
Place of birth - Native, outside of US (%)
Place of birth - Native, outside of US (%) - White
Place of birth - Native, outside of US (%) - Black or African American
Place of birth - Native, outside of US (%) - Asian
Place of birth - Native, outside of US (%) - Hispanic or Latino
Place of birth - Native, outside of US (%) - American Indian and Alaska Native
Place of birth - Native, outside of US (%) - Multirace
Place of birth - Native, outside of US (%) - Other Race
Place of birth - Foreign born (%)
Place of birth - Foreign born (%) - White
Place of birth - Foreign born (%) - Black or African American
Place of birth - Foreign born (%) - Asian
Place of birth - Foreign born (%) - Hispanic or Latino
Place of birth - Foreign born (%) - American Indian and Alaska Native
Place of birth - Foreign born (%) - Multirace
Place of birth - Foreign born (%) - Other Race
Residents speaking English at home (%)
Residents speaking English at home - Born in the United States (%)
Residents speaking English at home - Native, born elsewhere (%)
Residents speaking English at home - Foreign born (%)
Residents speaking Spanish at home (%)
Residents speaking Spanish at home - Born in the United States (%)
Residents speaking Spanish at home - Native, born elsewhere (%)
Residents speaking Spanish at home - Foreign born (%)
Residents speaking other language at home (%)
Residents speaking other language at home - Born in the United States (%)
Residents speaking other language at home - Native, born elsewhere (%)
Residents speaking other language at home - Foreign born (%)
Marital status - Never married (%)
Marital status - Now married (%)
Marital status - Separated (%)
Marital status - Widowed (%)
Marital status - Divorced (%)
Ancestries Reported - Arab (%)
Ancestries Reported - Czech (%)
Ancestries Reported - Danish (%)
Ancestries Reported - Dutch (%)
Ancestries Reported - English (%)
Ancestries Reported - French (%)
Ancestries Reported - French Canadian (%)
Ancestries Reported - German (%)
Ancestries Reported - Greek (%)
Ancestries Reported - Hungarian (%)
Ancestries Reported - Irish (%)
Ancestries Reported - Italian (%)
Ancestries Reported - Lithuanian (%)
Ancestries Reported - Norwegian (%)
Ancestries Reported - Polish (%)
Ancestries Reported - Portuguese (%)
Ancestries Reported - Russian (%)
Ancestries Reported - Scotch-Irish (%)
Ancestries Reported - Scottish (%)
Ancestries Reported - Slovak (%)
Ancestries Reported - Subsaharan African (%)
Ancestries Reported - Swedish (%)
Ancestries Reported - Swiss (%)
Ancestries Reported - Ukrainian (%)
Ancestries Reported - United States (%)
Ancestries Reported - Welsh (%)
Ancestries Reported - West Indian (%)
Ancestries Reported - Other (%)
Geographical mobility - Same house 1 year ago (%)
Geographical mobility - Same house 1 year ago (%) - White
Geographical mobility - Same house 1 year ago (%) - Black or African American
Geographical mobility - Same house 1 year ago (%) - Asian
Geographical mobility - Same house 1 year ago (%) - Hispanic or Latino
Geographical mobility - Same house 1 year ago (%) - American Indian and Alaska Native
Geographical mobility - Same house 1 year ago (%) - Multirace
Geographical mobility - Same house 1 year ago (%) - Other Race
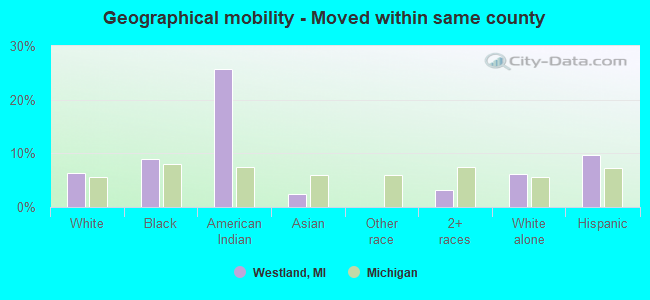
Geographical mobility - Moved within same county (%)
Geographical mobility - Moved within same county (%) - White
Geographical mobility - Moved within same county (%) - Black or African American
Geographical mobility - Moved within same county (%) - Asian
Geographical mobility - Moved within same county (%) - Hispanic or Latino
Geographical mobility - Moved within same county (%) - American Indian and Alaska Native
Geographical mobility - Moved within same county (%) - Multirace
Geographical mobility - Moved within same county (%) - Other Race
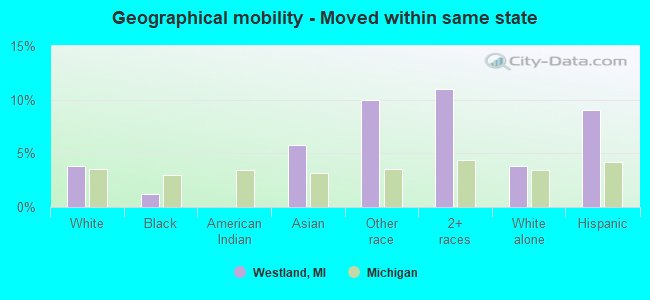
Geographical mobility - Moved from different county within same state (%)
Geographical mobility - Moved from different county within same state (%) - White
Geographical mobility - Moved from different county within same state (%) - Black or African American
Geographical mobility - Moved from different county within same state (%) - Asian
Geographical mobility - Moved from different county within same state (%) - Hispanic or Latino
Geographical mobility - Moved from different county within same state (%) - American Indian and Alaska Native
Geographical mobility - Moved from different county within same state (%) - Multirace
Geographical mobility - Moved from different county within same state (%) - Other Race
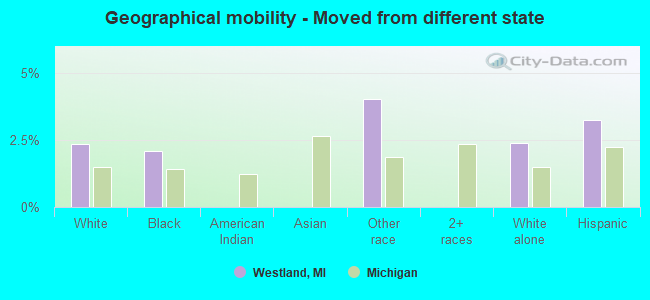
Geographical mobility - Moved from different state (%)
Geographical mobility - Moved from different state (%) - White
Geographical mobility - Moved from different state (%) - Black or African American
Geographical mobility - Moved from different state (%) - Asian
Geographical mobility - Moved from different state (%) - Hispanic or Latino
Geographical mobility - Moved from different state (%) - American Indian and Alaska Native
Geographical mobility - Moved from different state (%) - Multirace
Geographical mobility - Moved from different state (%) - Other Race
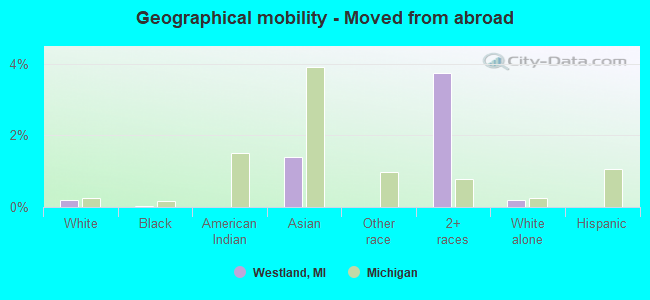
Geographical mobility - Moved from abroad (%)
Geographical mobility - Moved from abroad (%) - White
Geographical mobility - Moved from abroad (%) - Black or African American
Geographical mobility - Moved from abroad (%) - Asian
Geographical mobility - Moved from abroad (%) - Hispanic or Latino
Geographical mobility - Moved from abroad (%) - American Indian and Alaska Native
Geographical mobility - Moved from abroad (%) - Multirace
Geographical mobility - Moved from abroad (%) - Other Race
Place of birth for the foreign-born population - Ireland (%)
Place of birth for the foreign-born population - Denmark (%)
Place of birth for the foreign-born population - Norway (%)
Place of birth for the foreign-born population - Sweden (%)
Place of birth for the foreign-born population - United Kingdom (%)
Place of birth for the foreign-born population - England (%)
Place of birth for the foreign-born population - Scotland (%)
Place of birth for the foreign-born population - Other Northern Europe (%)
Place of birth for the foreign-born population - Austria (%)
Place of birth for the foreign-born population - Belgium (%)
Place of birth for the foreign-born population - France (%)
Place of birth for the foreign-born population - Germany (%)
Place of birth for the foreign-born population - Netherlands (%)
Place of birth for the foreign-born population - Switzerland (%)
Place of birth for the foreign-born population - Other Western Europe (%)
Place of birth for the foreign-born population - Greece (%)
Place of birth for the foreign-born population - Italy (%)
Place of birth for the foreign-born population - Portugal (%)
Place of birth for the foreign-born population - Spain (%)
Place of birth for the foreign-born population - Other Southern Europe (%)
Place of birth for the foreign-born population - Albania (%)
Place of birth for the foreign-born population - Belarus (%)
Place of birth for the foreign-born population - Bosnia and Herzegovina (%)
Place of birth for the foreign-born population - Bulgaria (%)
Place of birth for the foreign-born population - Croatia (%)
Place of birth for the foreign-born population - Czechoslovakia (%)
Place of birth for the foreign-born population - Hungary (%)
Place of birth for the foreign-born population - Latvia (%)
Place of birth for the foreign-born population - Lithuania (%)
Place of birth for the foreign-born population - North Macedonia (Macedonia) (%)
Place of birth for the foreign-born population - Moldova (%)
Place of birth for the foreign-born population - Poland (%)
Place of birth for the foreign-born population - Romania (%)
Place of birth for the foreign-born population - Russia (%)
Place of birth for the foreign-born population - Serbia (%)
Place of birth for the foreign-born population - Ukraine (%)
Place of birth for the foreign-born population - Other Eastern Europe (%)
Place of birth for the foreign-born population - China (%)
Place of birth for the foreign-born population - Hong Kong (%)
Place of birth for the foreign-born population - Taiwan (%)
Place of birth for the foreign-born population - Japan (%)
Place of birth for the foreign-born population - Korea (%)
Place of birth for the foreign-born population - Other Eastern Asia (%)
Place of birth for the foreign-born population - Afghanistan (%)
Place of birth for the foreign-born population - Bangladesh (%)
Place of birth for the foreign-born population - India (%)
Place of birth for the foreign-born population - Iran (%)
Place of birth for the foreign-born population - Kazakhstan (%)
Place of birth for the foreign-born population - Nepal (%)
Place of birth for the foreign-born population - Pakistan (%)
Place of birth for the foreign-born population - Sri Lanka (%)
Place of birth for the foreign-born population - Uzbekistan (%)
Place of birth for the foreign-born population - Other South Central Asia (%)
Place of birth for the foreign-born population - Burma (%)
Place of birth for the foreign-born population - Cambodia (%)
Place of birth for the foreign-born population - Indonesia (%)
Place of birth for the foreign-born population - Laos (%)
Place of birth for the foreign-born population - Malaysia (%)
Place of birth for the foreign-born population - Philippines (%)
Place of birth for the foreign-born population - Singapore (%)
Place of birth for the foreign-born population - Thailand (%)
Place of birth for the foreign-born population - Vietnam (%)
Place of birth for the foreign-born population - Other South Eastern Asia (%)
Place of birth for the foreign-born population - Armenia (%)
Place of birth for the foreign-born population - Iraq (%)
Place of birth for the foreign-born population - Israel (%)
Place of birth for the foreign-born population - Jordan (%)
Place of birth for the foreign-born population - Kuwait (%)
Place of birth for the foreign-born population - Lebanon (%)
Place of birth for the foreign-born population - Saudi Arabia (%)
Place of birth for the foreign-born population - Syria (%)
Place of birth for the foreign-born population - Turkey (%)
Place of birth for the foreign-born population - Yemen (%)
Place of birth for the foreign-born population - Other Western Asia (%)
Place of birth for the foreign-born population - Eritrea (%)
Place of birth for the foreign-born population - Ethiopia (%)
Place of birth for the foreign-born population - Kenya (%)
Place of birth for the foreign-born population - Somalia (%)
Place of birth for the foreign-born population - Uganda (%)
Place of birth for the foreign-born population - Zimbabwe (%)
Place of birth for the foreign-born population - Other Eastern Africa (%)
Place of birth for the foreign-born population - Cameroon (%)
Place of birth for the foreign-born population - Congo (%)
Place of birth for the foreign-born population - Democratic Republic of Congo (Zaire) (%)
Place of birth for the foreign-born population - Other Middle Africa (%)
Place of birth for the foreign-born population - Egypt (%)
Place of birth for the foreign-born population - Morocco (%)
Place of birth for the foreign-born population - Sudan (%)
Place of birth for the foreign-born population - Other Northern Africa (%)
Place of birth for the foreign-born population - South Africa (%)
Place of birth for the foreign-born population - Other Southern Africa (%)
Place of birth for the foreign-born population - Cabo Verde (%)
Place of birth for the foreign-born population - Ghana (%)
Place of birth for the foreign-born population - Liberia (%)
Place of birth for the foreign-born population - Nigeria (%)
Place of birth for the foreign-born population - Senegal (%)
Place of birth for the foreign-born population - Sierra Leone (%)
Place of birth for the foreign-born population - Other Western Africa (%)
Place of birth for the foreign-born population - Australia (%)
Place of birth for the foreign-born population - New Zealand (%)
Place of birth for the foreign-born population - Fiji (%)
Place of birth for the foreign-born population - Micronesia (%)
Place of birth for the foreign-born population - Bahamas (%)
Place of birth for the foreign-born population - Barbados (%)
Place of birth for the foreign-born population - Cuba (%)
Place of birth for the foreign-born population - Dominica (%)
Place of birth for the foreign-born population - Dominican Republic (%)
Place of birth for the foreign-born population - Grenada (%)
Place of birth for the foreign-born population - Haiti (%)
Place of birth for the foreign-born population - Jamaica (%)
Place of birth for the foreign-born population - St. Vincent and the Grenadines (%)
Place of birth for the foreign-born population - Trinidad and Tobago (%)
Place of birth for the foreign-born population - West Indies (%)
Place of birth for the foreign-born population - Other Caribbean (%)
Place of birth for the foreign-born population - Belize (%)
Place of birth for the foreign-born population - Costa Rica (%)
Place of birth for the foreign-born population - El Salvador (%)
Place of birth for the foreign-born population - Guatemala (%)
Place of birth for the foreign-born population - Honduras (%)
Place of birth for the foreign-born population - Mexico (%)
Place of birth for the foreign-born population - Nicaragua (%)
Place of birth for the foreign-born population - Panama (%)
Place of birth for the foreign-born population - Other Central America (%)
Place of birth for the foreign-born population - Argentina (%)
Place of birth for the foreign-born population - Bolivia (%)
Place of birth for the foreign-born population - Brazil (%)
Place of birth for the foreign-born population - Chile (%)
Place of birth for the foreign-born population - Colombia (%)
Place of birth for the foreign-born population - Ecuador (%)
Place of birth for the foreign-born population - Guyana (%)
Place of birth for the foreign-born population - Peru (%)
Place of birth for the foreign-born population - Uruguay (%)
Place of birth for the foreign-born population - Venezuela (%)
Place of birth for the foreign-born population - Other South America (%)
Place of birth for the foreign-born population - Canada (%)
Place of birth for the foreign-born population - Other Northern America (%)
Place of birth for the foreign-born population - Other (%)
Latest news about races in Westland, MI collected exclusively by city-data.com from local newspapers, TV, and radio stations
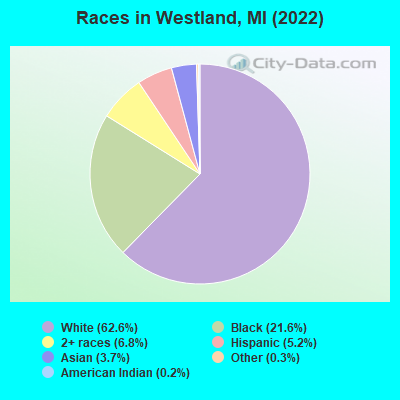
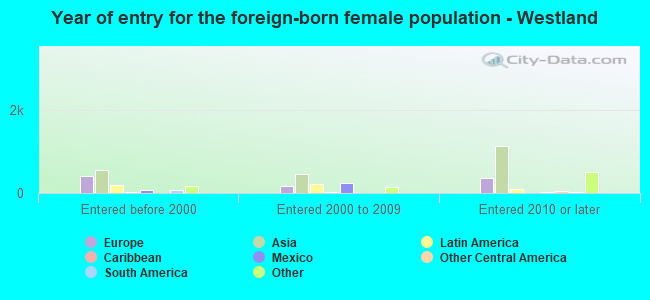
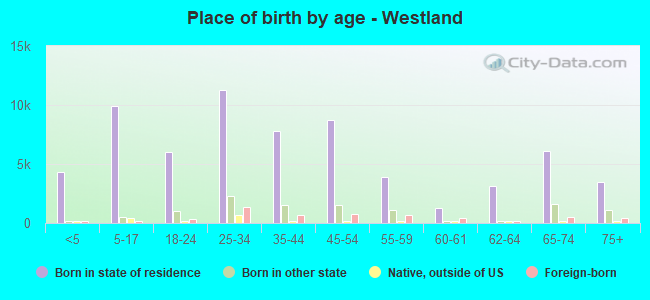
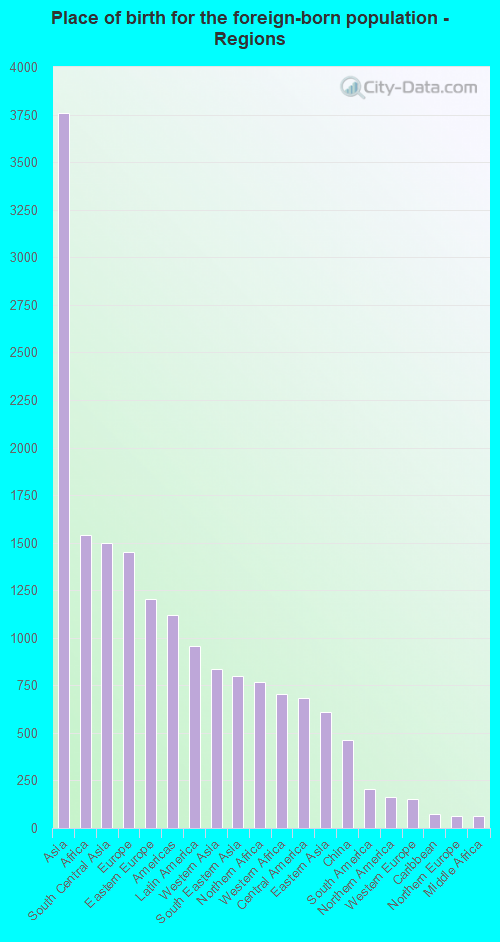
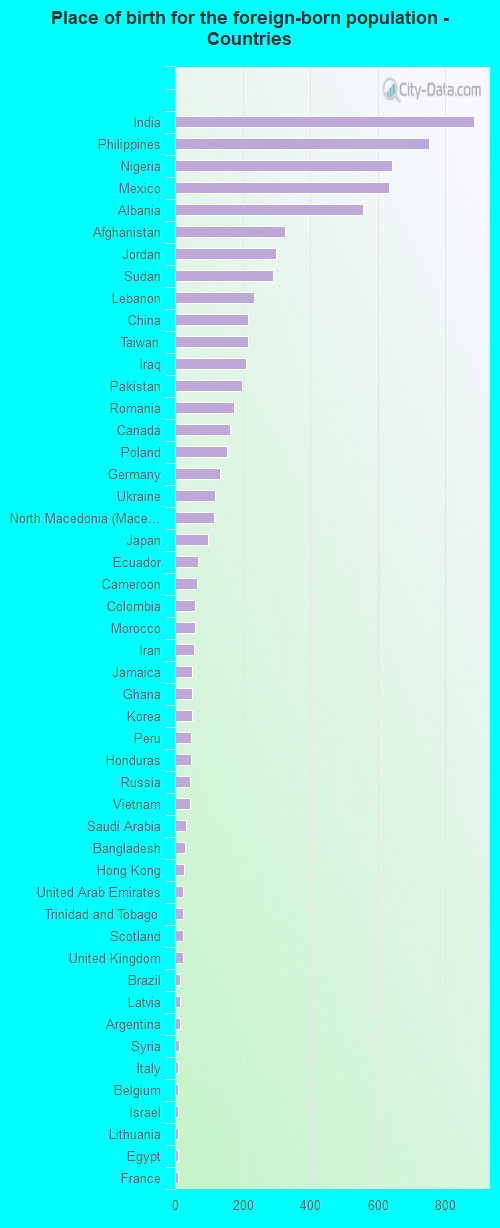
According to 2022 data, the most numerous races in Westland, MI are White alone (52,342 residents), Black alone (18,073 residents), and Hispanic (4,386 residents). 86.9% of Westland residents speak English at home. 9.4% of Westland, MI residents are foreign-born (4.4% born in Asia, 1.8% born in Africa, 1.7% born in Europe, 1.1% born in Latin America), which is 36.3% greater than the foreign-born rate of 6.0% across the entire state of Michigan.
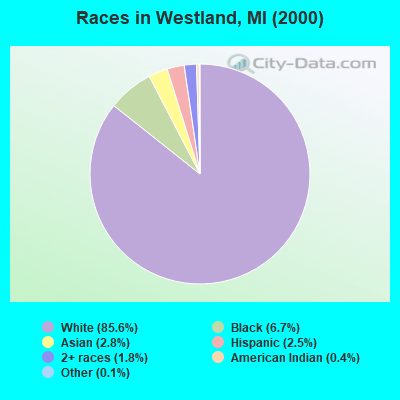
Race distribution in Westland
2000 2022
74,116 85.6% White alone 5,823 6.7% Black alone 2,427 2.8% Asian alone 2,138 2.5% Hispanic 1,586 1.8% Two or more races 360 0.4% American Indian alone 127 0.1% Other race alone 25 0.03% Native Hawaiian and Other
52,342 62.6% White alone 18,073 21.6% Black alone 5,685 6.8% Two or more races 4,386 5.2% Hispanic 3,128 3.7% Asian alone 252 0.3% Other race alone 162 0.2% American Indian alone
2000 2022
7,806,691 78.6% White alone 1,402,047 14.1% Black alone 323,877 3.3% Hispanic 175,311 1.8% Asian alone 163,487 1.6% Two or more races 53,421 0.5% American Indian alone 11,465 0.1% Other race alone 2,145 0.02% Native Hawaiian and Other
7,289,051 72.6% White alone 1,310,464 13.1% Black alone 572,405 5.7% Hispanic 450,031 4.5% Two or more races 335,732 3.3% Asian alone 45,217 0.5% Other race alone 29,011 0.3% American Indian alone 2,207 0.02% Native Hawaiian and Other
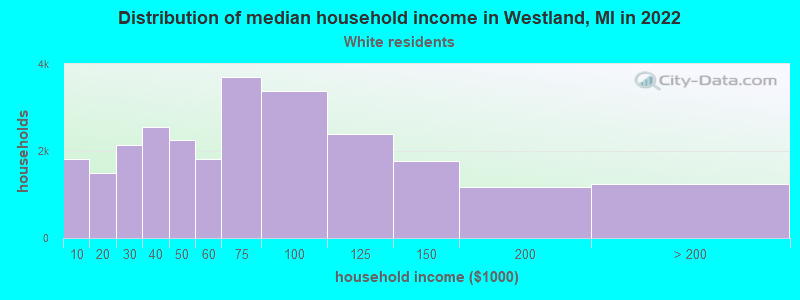
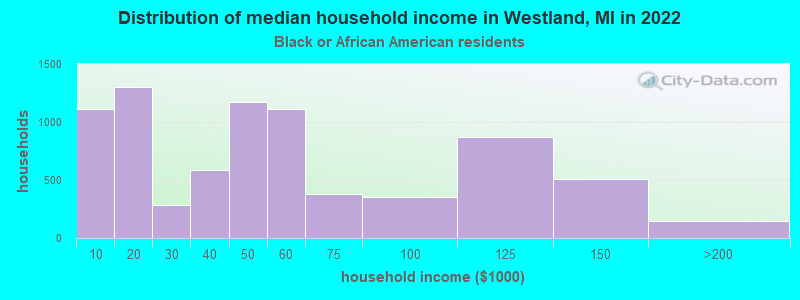
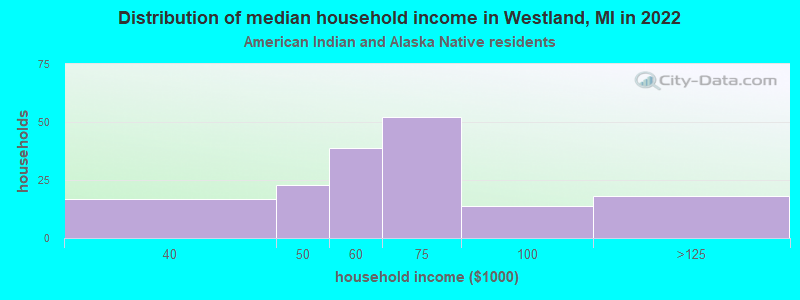
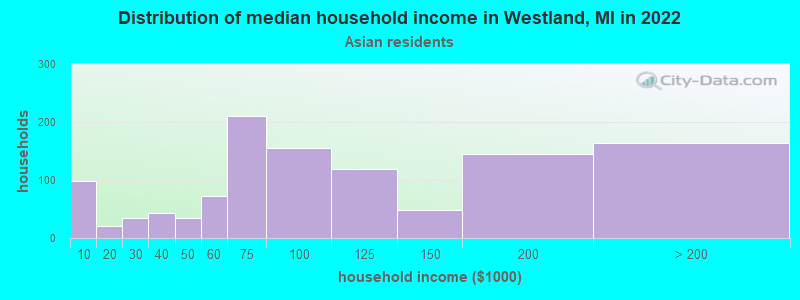
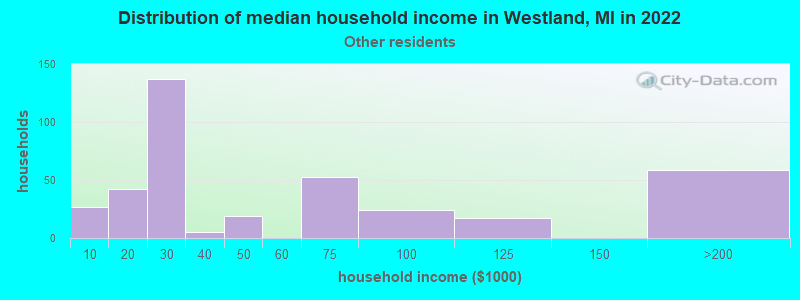
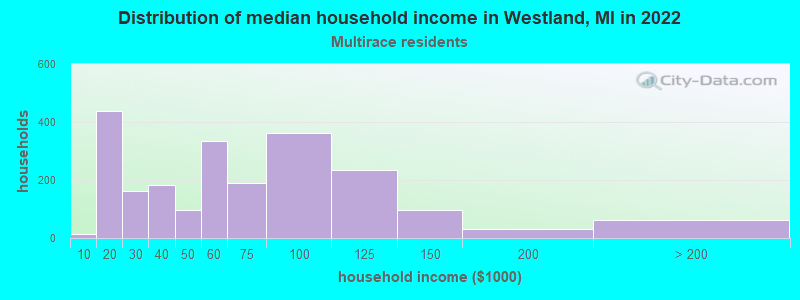
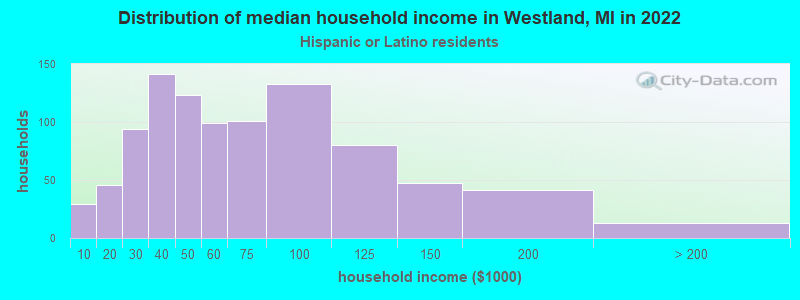
Income and house value in Westland Median household income in 2022 $63,478 White non-Hispanic householders$44,929 Black householders$91,660 Asian householders$51,048 Two or more races householders$54,165 Hispanic or Latino race householdersMedian 2022 house value $184,444 White Non-Hispanic householders$141,046 Black or African American householders$152,360 American Indian or Alaska Native householders $225,208 Asian householders$121,516 Some other race householders$205,679 Two or more races householders$185,064 Hispanic or Latino householders
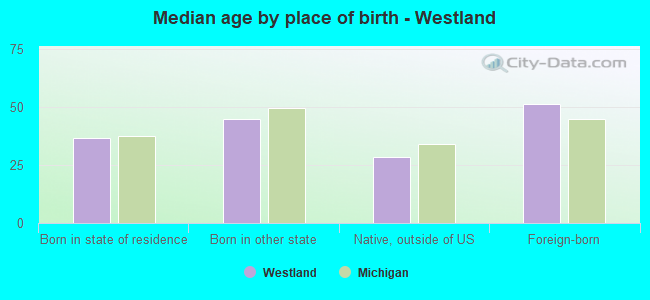
Median age by race in Westland
42.6 Median age for White residents42.2 43.1 34.9 Median age for Black or African American residents32.1 44.8 51.4 Median age for American Indian / Alaska Native residents51.1 -666,666,666.0 51.7 Median age for Asian residents53.1 44.4 -666,666,666.0 Median age for Native Hawaiian / Pacific Islander residents-666,666,666.0 -666,666,666.0 27.8 Median age for Other race residents27.7 31.3 23.7 Median age for Two or more races residents19.5 29.3 42.9 Median age for White alone residents42.7 43.1 25.6 Median age for Hispanic or Latino residents14.9 35.9
Owner/renter occupied households by race in Westland
House owners and renters - White residents 18,051 70.3% Owner occupied7,626 29.7% Renter occupiedHouse owners and renters - Black or African American residents 1,663 21.3% Owner occupied6,162 78.7% Renter occupiedHouse owners and renters - American Indian / Alaska Native residents 68 38.3% Owner occupied110 61.7% Renter occupiedHouse owners and renters - Asian residents 519 64.7% Owner occupied283 35.3% Renter occupiedHouse owners and renters - Other race residents 140 38.3% Owner occupied226 61.7% Renter occupiedHouse owners and renters - Two or more races residents 1,254 58.4% Owner occupied895 41.6% Renter occupiedHouse owners and renters - White alone residents 17,987 70.9% Owner occupied7,387 29.1% Renter occupiedHouse owners and renters - Hispanic or Latino residents 672 49.4% Owner occupied689 50.6% Renter occupied
Language usage in Westland
English speakers - Total 86.9% of residents of Westland speak English at home.
3.1% of residents speak Spanish at home 1,590 65.2% Speak English very well849 34.8% Speak English less than very well9.9% of residents speak other language at home 4,237 54.5% Speak English very well3,536 45.5% Speak English less than very well
English speakers - Born in the United States 95.0% of residents of Westland speak English at home.
1.3% of residents speak Spanish at home 111 82.2% Speak English very well24 17.8% Speak English less than very well3.0% of residents speak other language at home 269 88.5% Speak English very well35 11.5% Speak English less than very well
English speakers - Native, born elsewhere 77.4% of residents of Westland speak English at home.
15.3% of residents speak Spanish at home 4 4.1% Speak English very well94 95.9% Speak English less than very well19.7% of residents speak other language at home 126 100.0% Speak English very well
English speakers - Foreign-born 12.7% of residents of Westland speak English at home.
9.3% of residents speak Spanish at home 150 20.4% Speak English very well585 79.6% Speak English less than very well77.7% of residents speak other language at home 2,688 43.9% Speak English very well3,434 56.1% Speak English less than very well
White (Caucasian) - Speak only English Native:
97.8% (50,858)Foreign-born:
40.2% (911)
White (Caucasian) - Speak another language Native:
2.2% (1,163)Foreign-born:
59.8% (1,354)
Black or African American - Speak only English Native:
97.4% (15,869)Foreign-born:
22.2% (191)
Black or African American - Speak another language Native:
2.0% (328)Foreign-born:
76.4% (659)
American Indian / Alaska Native - Speak another language Native:
29.0% (96)Foreign-born:
100.0% (190)
Asian - Speak only English Native:
64.3% (366)Foreign-born:
11.4% (265)
Asian - Speak another language Native:
33.3% (190)Foreign-born:
88.3% (2,058)
Other race - Speak only English Native:
37.7% (258)Foreign-born:
2.5% (10)
Other race - Speak another language Native:
62.0% (423)Foreign-born:
98.7% (393)
Two or more races - Speak only English Native:
85.0% (5,130)Foreign-born:
9.2% (74)
Two or more races - Speak another language Native:
14.7% (887)Foreign-born:
91.5% (740)
White alone - Speak only English Native:
97.7% (49,961)Foreign-born:
40.2% (911)
White alone - Speak another language Native:
2.3% (1,163)Foreign-born:
59.8% (1,354)
Hispanic or Latino - Speak only English Native:
53.8% (1,783)Foreign-born:
6.4% (51)
Hispanic or Latino - Speak another language Native:
46.2% (1,533)Foreign-born:
93.4% (737)
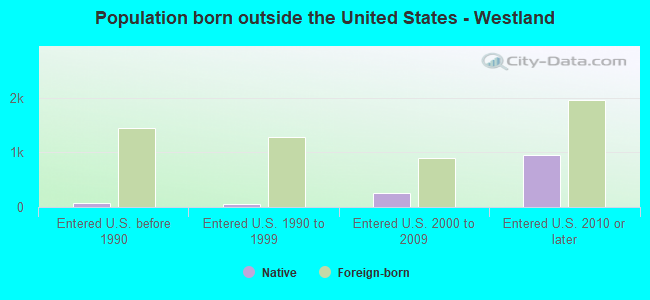
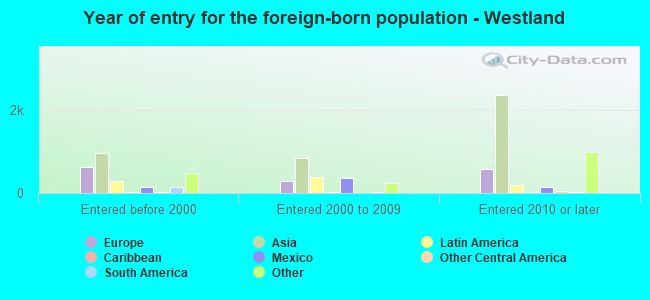
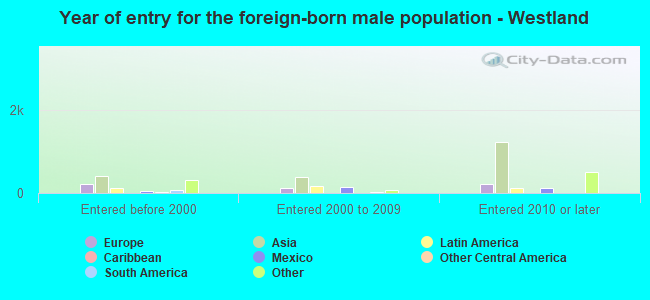
Foreign-born residents in Westland 7,883 residents are foreign born (4.4% Asia , 1.8% Africa , 1.7% Europe , 1.1% Latin America ).
This city:
9.4%Michigan:
6.9%
Marital status for residents in Westland Marital status - White (Caucasian) population 15 years and over
Males 44.8% Never married38.6% Now married0.3% Separated3.7% Widowed12.6% DivorcedFemales 33.6% Never married41.1% Now married1.2% Separated9.4% Widowed14.7% DivorcedWomen who gave birth in the past 12 months Now married:
39.5% (221)Unmarried:
60.5% (338)
Women who did not give birth in the past 12 months Now married:
36.0% (4,599)Unmarried:
64.0% (8,178)
Marital status - Black or African American population 15 years and over
Males 69.2% Never married22.7% Now married5.9% Separated0.0% Widowed2.2% DivorcedFemales 53.2% Never married26.6% Now married0.1% Separated8.2% Widowed11.9% DivorcedWomen who gave birth in the past 12 months Now married:
52.2% (105)Unmarried:
47.8% (96)
Women who did not give birth in the past 12 months Now married:
22.2% (684)Unmarried:
77.8% (2,398)
Marital status - American Indian / Alaska Native population 15 years and over
Males 64.3% Never married22.1% Now married0.0% Separated0.0% Widowed13.6% DivorcedFemales 28.2% Never married17.1% Now married6.6% Separated0.0% Widowed48.1% DivorcedWomen who gave birth in the past 12 months Now married:
100.0% (12)Unmarried:
0.0% (0)
Women who did not give birth in the past 12 months Now married:
20.4% (32)Unmarried:
79.6% (125)
Marital status - Asian population 15 years and over
Males 36.9% Never married56.9% Now married5.6% Separated0.0% Widowed0.7% DivorcedFemales 23.0% Never married64.4% Now married0.0% Separated5.7% Widowed7.0% DivorcedWomen who gave birth in the past 12 months Now married:
81.9% (66)Unmarried:
18.1% (15)
Women who did not give birth in the past 12 months Now married:
57.7% (367)Unmarried:
42.3% (269)
Marital status - Other race population 15 years and over
Males 52.3% Never married47.7% Now married0.0% Separated0.0% Widowed0.0% DivorcedFemales 52.6% Never married40.1% Now married0.0% Separated0.0% Widowed7.4% DivorcedWomen who gave birth in the past 12 months Now married:
100.0% (16)Unmarried:
0.0% (0)
Women who did not give birth in the past 12 months Now married:
35.2% (111)Unmarried:
64.8% (205)
Marital status - Two or more races population 15 years and over
Males 61.1% Never married24.5% Now married3.9% Separated1.0% Widowed9.6% DivorcedFemales 39.5% Never married42.9% Now married0.0% Separated3.4% Widowed14.1% DivorcedWomen who gave birth in the past 12 months Now married:
100.0% (292)Unmarried:
0.0% (0)
Women who did not give birth in the past 12 months Now married:
19.3% (348)Unmarried:
80.7% (1,457)
Marital status - White alone, not Hispanic / Latino population 15 years and over
Males 44.5% Never married38.9% Now married0.3% Separated3.8% Widowed12.5% DivorcedFemales 33.4% Never married41.8% Now married1.2% Separated9.5% Widowed14.2% DivorcedWomen who gave birth in the past 12 months Now married:
39.5% (221)Unmarried:
60.5% (338)
Women who did not give birth in the past 12 months Now married:
37.0% (4,599)Unmarried:
63.0% (7,815)
Marital status - Hispanic or Latino population 15 years and over
Males 52.2% Never married40.9% Now married0.0% Separated1.7% Widowed5.2% DivorcedFemales 56.6% Never married34.5% Now married0.2% Separated1.8% Widowed6.9% DivorcedWomen who gave birth in the past 12 months Now married:
100.0% (39)Unmarried:
0.0% (0)
Women who did not give birth in the past 12 months Now married:
28.3% (364)Unmarried:
71.7% (921)
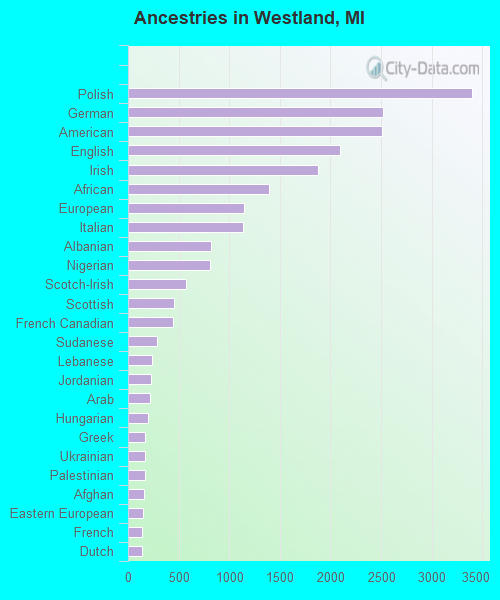
Ancestries in Westland
3,397 8.2% Polish2,517 6.1% German2,507 6.1% American2,097 5.1% English1,881 4.6% Irish1,392 3.4% African1,148 2.8% European1,139 2.8% Italian816 2.0% Albanian809 2.0% Nigerian576 1.4% Scotch-Irish459 1.1% Scottish441 1.1% French Canadian289 0.7% Sudanese234 0.6% Lebanese229 0.6% Jordanian214 0.5% Arab196 0.5% Hungarian172 0.4% Greek170 0.4% Ukrainian165 0.4% Palestinian154 0.4% Afghan149 0.4% Eastern European138 0.3% French134 0.3% Dutch133 0.3% Swedish118 0.3% Iraqi112 0.3% Norwegian112 0.3% Finnish110 0.3% Iranian104 0.3% Macedonian98 0.2% Canadian92 0.2% Romanian87 0.2% Ghanaian73 0.2% Slovak72 0.2% Jamaican68 0.2% Czech54 0.1% Moroccan50 0.1% Welsh46 0.1% Russian45 0.1% Maltese41 0.10% British41 0.10% Serbian36 0.09% Lithuanian36 0.09% British West Indian34 0.08% Danish33 0.08% Croatian22 0.05% Slovene22 0.05% Syrian17 0.04% Belgian16 0.04% Czechoslovakian16 0.04% Slavic15 0.04% Egyptian14 0.03% Latvian12 0.03% Assyrian9 0.02% Scandinavian9 0.02% Turkish8 0.02% Northern European
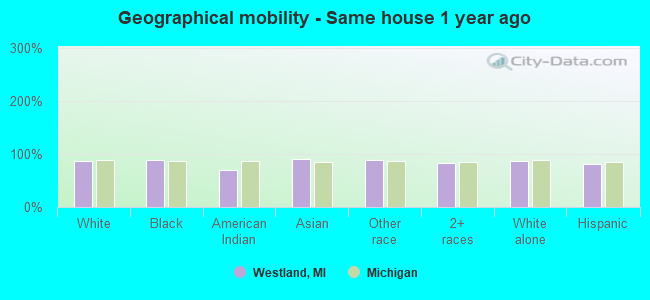
Geographical mobility in Westland Same house 1 year ago 49,254 87.4% White (Caucasian)15,993 87.9% Black or African American382 70.6% American Indian / Alaska Native2,787 91.0% Asian973 87.9% Other race7,609 82.1% Two or more races48,481 87.4% White alone, not Hispanic / Latino3,516 81.2% Hispanic or LatinoMoved within same county 3,557 6.3% White / Caucasian1,638 9.0% Black or African American139 25.8% American Indian / Alaska Native73 2.4% Asian294 3.2% Two or more races3,433 6.2% White alone, not Hispanic / Latino419 9.7% Hispanic or LatinoMoved within same state 2,141 3.8% White / Caucasian229 1.3% Black or African American177 5.8% Asian110 9.9% Other race1,015 11.0% Two or more races2,141 3.9% White alone, not Hispanic / Latino391 9.0% Hispanic or LatinoMoved from different state 1,320 2.3% White / Caucasian381 2.1% Black or African American44 4.0% Other race1,320 2.4% White alone, not Hispanic / Latino140 3.2% Hispanic or LatinoMoved from abroad 108 0.2% White7 0.0% Black or African American43 1.4% Asian348 3.8% Two or more races108 0.2% White alone, not Hispanic / Latino
Children Nativity (place of birth) in Westland
Children under 6 years - Living with two parents Both parents native 2,270 100.0% NativeBoth parents foreign-born 1,093 98.3% Native19 1.7% Foreign-bornOne native, one foreign-born parent 308 100.0% NativeChildren under 6 years - Living with one parent Native parent 1,848 99.5% Native9 0.5% Foreign-bornForeign-born parent 213 90.5% Native22 9.5% Foreign-bornChildren 6 to 17 years - Living with two parents Both parents native 4,508 99.6% Native18 0.4% Foreign-bornBoth parents foreign-born 938 70.6% Native390 29.4% Foreign-bornOne native, one foreign-born parent 133 100.0% NativeChildren 6 to 17 years - Living with one parent Native parent 4,419 100.0% NativeForeign-born parent 353 55.1% Native288 44.9% Foreign-born
Grandparents responsible for own grandchildren in Westland
Grandparents (30 to 59 years) White / Caucasian 447 70.6% Responsible for grandchildren187 29.4% Not responsible for grandchildrenBlack or African American 16 10.3% Responsible for grandchildren136 89.7% Not responsible for grandchildrenAsian 26 49.7% Responsible for grandchildren26 50.3% Not responsible for grandchildrenTwo or more races 4 6.8% Responsible for grandchildren53 93.2% Not responsible for grandchildrenWhite alone, not Hispanic / Latino 447 69.3% Responsible for grandchildren198 30.7% Not responsible for grandchildrenGrandparents (60 years and over) White / Caucasian 86 27.2% Responsible for grandchildren231 72.8% Not responsible for grandchildrenBlack or African American 34 28.6% Responsible for grandchildren85 71.4% Not responsible for grandchildrenAsian 57 59.5% Responsible for grandchildren39 40.5% Not responsible for grandchildrenTwo or more races 50 80.4% Responsible for grandchildren12 19.6% Not responsible for grandchildrenWhite alone, not Hispanic / Latino 81 25.2% Responsible for grandchildren240 74.8% Not responsible for grandchildren