Races in Westminster, Maryland (MD) Detailed Stats
Data:
Races - White alone (%)
Races - White alone (% change since 2000)
Races - Black alone (%)
Races - Black alone (% change since 2000)
Races - American Indian alone (%)
Races - American Indian alone (% change since 2000)
Races - Asian alone (%)
Races - Asian alone (% change since 2000)
Races - Hispanic (%)
Races - Hispanic (% change since 2000)
Races - Native Hawaiian and Other Pacific Islander alone (%)
Races - Native Hawaiian and Other Pacific Islander alone (% change since 2000)
Races - Two or more races(%)
Races - Two or more races(% change since 2000)
Races - Other race alone (%)
Races - Other race alone (% change since 2000)
Racial diversity
Place of birth - Born in state of residence (%)
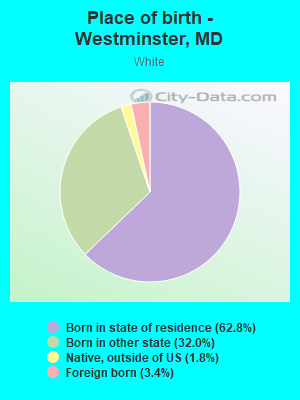
Place of birth - Born in state of residence (%) - White
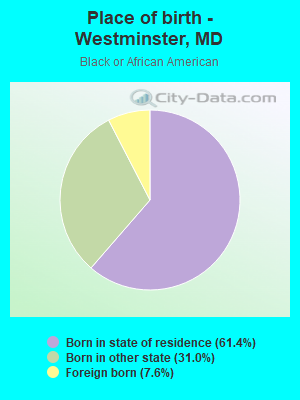
Place of birth - Born in state of residence (%) - Black or African American
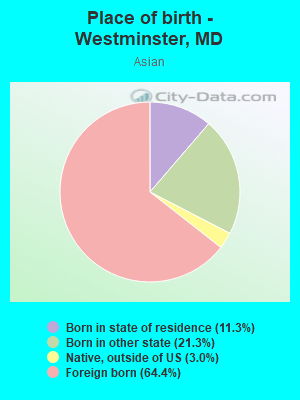
Place of birth - Born in state of residence (%) - Asian
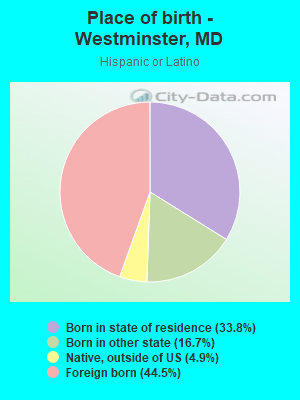
Place of birth - Born in state of residence (%) - Hispanic or Latino
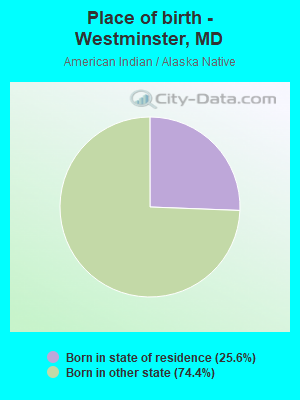
Place of birth - Born in state of residence (%) - American Indian and Alaska Native
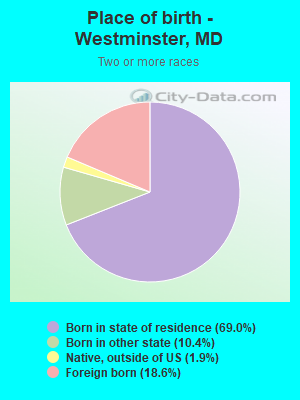
Place of birth - Born in state of residence (%) - Multirace
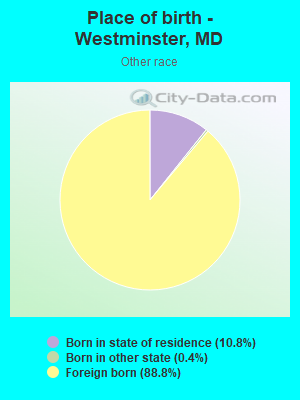
Place of birth - Born in state of residence (%) - Other Race
Place of birth - Born in other state (%)
Place of birth - Born in other state (%) - White
Place of birth - Born in other state (%) - Black or African American
Place of birth - Born in other state (%) - Asian
Place of birth - Born in other state (%) - Hispanic or Latino
Place of birth - Born in other state (%) - American Indian and Alaska Native
Place of birth - Born in other state (%) - Multirace
Place of birth - Born in other state (%) - Other Race
Place of birth - Native, outside of US (%)
Place of birth - Native, outside of US (%) - White
Place of birth - Native, outside of US (%) - Black or African American
Place of birth - Native, outside of US (%) - Asian
Place of birth - Native, outside of US (%) - Hispanic or Latino
Place of birth - Native, outside of US (%) - American Indian and Alaska Native
Place of birth - Native, outside of US (%) - Multirace
Place of birth - Native, outside of US (%) - Other Race
Place of birth - Foreign born (%)
Place of birth - Foreign born (%) - White
Place of birth - Foreign born (%) - Black or African American
Place of birth - Foreign born (%) - Asian
Place of birth - Foreign born (%) - Hispanic or Latino
Place of birth - Foreign born (%) - American Indian and Alaska Native
Place of birth - Foreign born (%) - Multirace
Place of birth - Foreign born (%) - Other Race
Residents speaking English at home (%)
Residents speaking English at home - Born in the United States (%)
Residents speaking English at home - Native, born elsewhere (%)
Residents speaking English at home - Foreign born (%)
Residents speaking Spanish at home (%)
Residents speaking Spanish at home - Born in the United States (%)
Residents speaking Spanish at home - Native, born elsewhere (%)
Residents speaking Spanish at home - Foreign born (%)
Residents speaking other language at home (%)
Residents speaking other language at home - Born in the United States (%)
Residents speaking other language at home - Native, born elsewhere (%)
Residents speaking other language at home - Foreign born (%)
Marital status - Never married (%)
Marital status - Now married (%)
Marital status - Separated (%)
Marital status - Widowed (%)
Marital status - Divorced (%)
Ancestries Reported - Arab (%)
Ancestries Reported - Czech (%)
Ancestries Reported - Danish (%)
Ancestries Reported - Dutch (%)
Ancestries Reported - English (%)
Ancestries Reported - French (%)
Ancestries Reported - French Canadian (%)
Ancestries Reported - German (%)
Ancestries Reported - Greek (%)
Ancestries Reported - Hungarian (%)
Ancestries Reported - Irish (%)
Ancestries Reported - Italian (%)
Ancestries Reported - Lithuanian (%)
Ancestries Reported - Norwegian (%)
Ancestries Reported - Polish (%)
Ancestries Reported - Portuguese (%)
Ancestries Reported - Russian (%)
Ancestries Reported - Scotch-Irish (%)
Ancestries Reported - Scottish (%)
Ancestries Reported - Slovak (%)
Ancestries Reported - Subsaharan African (%)
Ancestries Reported - Swedish (%)
Ancestries Reported - Swiss (%)
Ancestries Reported - Ukrainian (%)
Ancestries Reported - United States (%)
Ancestries Reported - Welsh (%)
Ancestries Reported - West Indian (%)
Ancestries Reported - Other (%)
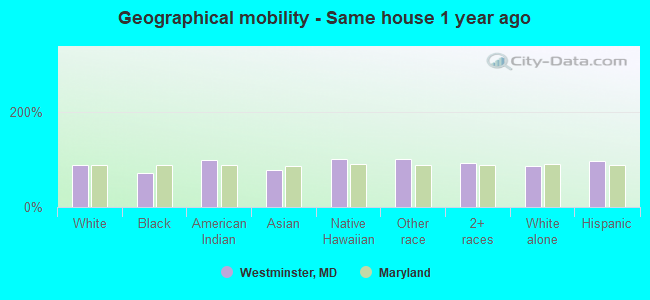
Geographical mobility - Same house 1 year ago (%)
Geographical mobility - Same house 1 year ago (%) - White
Geographical mobility - Same house 1 year ago (%) - Black or African American
Geographical mobility - Same house 1 year ago (%) - Asian
Geographical mobility - Same house 1 year ago (%) - Hispanic or Latino
Geographical mobility - Same house 1 year ago (%) - American Indian and Alaska Native
Geographical mobility - Same house 1 year ago (%) - Multirace
Geographical mobility - Same house 1 year ago (%) - Other Race
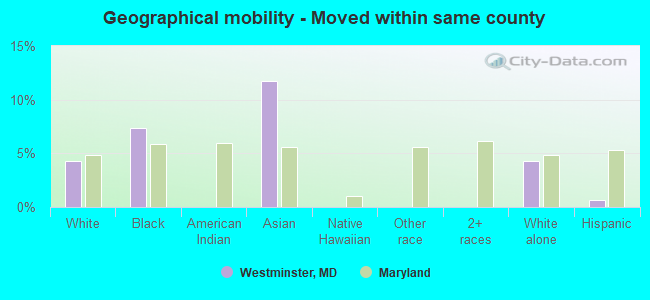
Geographical mobility - Moved within same county (%)
Geographical mobility - Moved within same county (%) - White
Geographical mobility - Moved within same county (%) - Black or African American
Geographical mobility - Moved within same county (%) - Asian
Geographical mobility - Moved within same county (%) - Hispanic or Latino
Geographical mobility - Moved within same county (%) - American Indian and Alaska Native
Geographical mobility - Moved within same county (%) - Multirace
Geographical mobility - Moved within same county (%) - Other Race
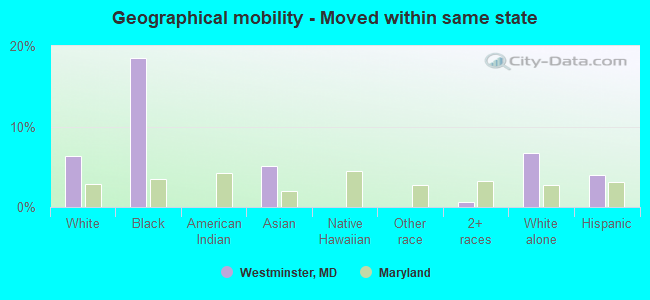
Geographical mobility - Moved from different county within same state (%)
Geographical mobility - Moved from different county within same state (%) - White
Geographical mobility - Moved from different county within same state (%) - Black or African American
Geographical mobility - Moved from different county within same state (%) - Asian
Geographical mobility - Moved from different county within same state (%) - Hispanic or Latino
Geographical mobility - Moved from different county within same state (%) - American Indian and Alaska Native
Geographical mobility - Moved from different county within same state (%) - Multirace
Geographical mobility - Moved from different county within same state (%) - Other Race
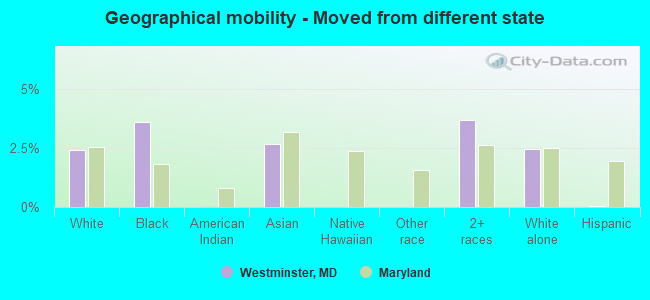
Geographical mobility - Moved from different state (%)
Geographical mobility - Moved from different state (%) - White
Geographical mobility - Moved from different state (%) - Black or African American
Geographical mobility - Moved from different state (%) - Asian
Geographical mobility - Moved from different state (%) - Hispanic or Latino
Geographical mobility - Moved from different state (%) - American Indian and Alaska Native
Geographical mobility - Moved from different state (%) - Multirace
Geographical mobility - Moved from different state (%) - Other Race
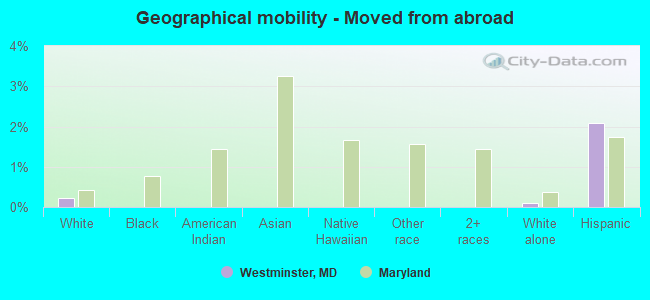
Geographical mobility - Moved from abroad (%)
Geographical mobility - Moved from abroad (%) - White
Geographical mobility - Moved from abroad (%) - Black or African American
Geographical mobility - Moved from abroad (%) - Asian
Geographical mobility - Moved from abroad (%) - Hispanic or Latino
Geographical mobility - Moved from abroad (%) - American Indian and Alaska Native
Geographical mobility - Moved from abroad (%) - Multirace
Geographical mobility - Moved from abroad (%) - Other Race
Place of birth for the foreign-born population - Ireland (%)
Place of birth for the foreign-born population - Denmark (%)
Place of birth for the foreign-born population - Norway (%)
Place of birth for the foreign-born population - Sweden (%)
Place of birth for the foreign-born population - United Kingdom (%)
Place of birth for the foreign-born population - England (%)
Place of birth for the foreign-born population - Scotland (%)
Place of birth for the foreign-born population - Other Northern Europe (%)
Place of birth for the foreign-born population - Austria (%)
Place of birth for the foreign-born population - Belgium (%)
Place of birth for the foreign-born population - France (%)
Place of birth for the foreign-born population - Germany (%)
Place of birth for the foreign-born population - Netherlands (%)
Place of birth for the foreign-born population - Switzerland (%)
Place of birth for the foreign-born population - Other Western Europe (%)
Place of birth for the foreign-born population - Greece (%)
Place of birth for the foreign-born population - Italy (%)
Place of birth for the foreign-born population - Portugal (%)
Place of birth for the foreign-born population - Spain (%)
Place of birth for the foreign-born population - Other Southern Europe (%)
Place of birth for the foreign-born population - Albania (%)
Place of birth for the foreign-born population - Belarus (%)
Place of birth for the foreign-born population - Bosnia and Herzegovina (%)
Place of birth for the foreign-born population - Bulgaria (%)
Place of birth for the foreign-born population - Croatia (%)
Place of birth for the foreign-born population - Czechoslovakia (%)
Place of birth for the foreign-born population - Hungary (%)
Place of birth for the foreign-born population - Latvia (%)
Place of birth for the foreign-born population - Lithuania (%)
Place of birth for the foreign-born population - North Macedonia (Macedonia) (%)
Place of birth for the foreign-born population - Moldova (%)
Place of birth for the foreign-born population - Poland (%)
Place of birth for the foreign-born population - Romania (%)
Place of birth for the foreign-born population - Russia (%)
Place of birth for the foreign-born population - Serbia (%)
Place of birth for the foreign-born population - Ukraine (%)
Place of birth for the foreign-born population - Other Eastern Europe (%)
Place of birth for the foreign-born population - China (%)
Place of birth for the foreign-born population - Hong Kong (%)
Place of birth for the foreign-born population - Taiwan (%)
Place of birth for the foreign-born population - Japan (%)
Place of birth for the foreign-born population - Korea (%)
Place of birth for the foreign-born population - Other Eastern Asia (%)
Place of birth for the foreign-born population - Afghanistan (%)
Place of birth for the foreign-born population - Bangladesh (%)
Place of birth for the foreign-born population - India (%)
Place of birth for the foreign-born population - Iran (%)
Place of birth for the foreign-born population - Kazakhstan (%)
Place of birth for the foreign-born population - Nepal (%)
Place of birth for the foreign-born population - Pakistan (%)
Place of birth for the foreign-born population - Sri Lanka (%)
Place of birth for the foreign-born population - Uzbekistan (%)
Place of birth for the foreign-born population - Other South Central Asia (%)
Place of birth for the foreign-born population - Burma (%)
Place of birth for the foreign-born population - Cambodia (%)
Place of birth for the foreign-born population - Indonesia (%)
Place of birth for the foreign-born population - Laos (%)
Place of birth for the foreign-born population - Malaysia (%)
Place of birth for the foreign-born population - Philippines (%)
Place of birth for the foreign-born population - Singapore (%)
Place of birth for the foreign-born population - Thailand (%)
Place of birth for the foreign-born population - Vietnam (%)
Place of birth for the foreign-born population - Other South Eastern Asia (%)
Place of birth for the foreign-born population - Armenia (%)
Place of birth for the foreign-born population - Iraq (%)
Place of birth for the foreign-born population - Israel (%)
Place of birth for the foreign-born population - Jordan (%)
Place of birth for the foreign-born population - Kuwait (%)
Place of birth for the foreign-born population - Lebanon (%)
Place of birth for the foreign-born population - Saudi Arabia (%)
Place of birth for the foreign-born population - Syria (%)
Place of birth for the foreign-born population - Turkey (%)
Place of birth for the foreign-born population - Yemen (%)
Place of birth for the foreign-born population - Other Western Asia (%)
Place of birth for the foreign-born population - Eritrea (%)
Place of birth for the foreign-born population - Ethiopia (%)
Place of birth for the foreign-born population - Kenya (%)
Place of birth for the foreign-born population - Somalia (%)
Place of birth for the foreign-born population - Uganda (%)
Place of birth for the foreign-born population - Zimbabwe (%)
Place of birth for the foreign-born population - Other Eastern Africa (%)
Place of birth for the foreign-born population - Cameroon (%)
Place of birth for the foreign-born population - Congo (%)
Place of birth for the foreign-born population - Democratic Republic of Congo (Zaire) (%)
Place of birth for the foreign-born population - Other Middle Africa (%)
Place of birth for the foreign-born population - Egypt (%)
Place of birth for the foreign-born population - Morocco (%)
Place of birth for the foreign-born population - Sudan (%)
Place of birth for the foreign-born population - Other Northern Africa (%)
Place of birth for the foreign-born population - South Africa (%)
Place of birth for the foreign-born population - Other Southern Africa (%)
Place of birth for the foreign-born population - Cabo Verde (%)
Place of birth for the foreign-born population - Ghana (%)
Place of birth for the foreign-born population - Liberia (%)
Place of birth for the foreign-born population - Nigeria (%)
Place of birth for the foreign-born population - Senegal (%)
Place of birth for the foreign-born population - Sierra Leone (%)
Place of birth for the foreign-born population - Other Western Africa (%)
Place of birth for the foreign-born population - Australia (%)
Place of birth for the foreign-born population - New Zealand (%)
Place of birth for the foreign-born population - Fiji (%)
Place of birth for the foreign-born population - Micronesia (%)
Place of birth for the foreign-born population - Bahamas (%)
Place of birth for the foreign-born population - Barbados (%)
Place of birth for the foreign-born population - Cuba (%)
Place of birth for the foreign-born population - Dominica (%)
Place of birth for the foreign-born population - Dominican Republic (%)
Place of birth for the foreign-born population - Grenada (%)
Place of birth for the foreign-born population - Haiti (%)
Place of birth for the foreign-born population - Jamaica (%)
Place of birth for the foreign-born population - St. Vincent and the Grenadines (%)
Place of birth for the foreign-born population - Trinidad and Tobago (%)
Place of birth for the foreign-born population - West Indies (%)
Place of birth for the foreign-born population - Other Caribbean (%)
Place of birth for the foreign-born population - Belize (%)
Place of birth for the foreign-born population - Costa Rica (%)
Place of birth for the foreign-born population - El Salvador (%)
Place of birth for the foreign-born population - Guatemala (%)
Place of birth for the foreign-born population - Honduras (%)
Place of birth for the foreign-born population - Mexico (%)
Place of birth for the foreign-born population - Nicaragua (%)
Place of birth for the foreign-born population - Panama (%)
Place of birth for the foreign-born population - Other Central America (%)
Place of birth for the foreign-born population - Argentina (%)
Place of birth for the foreign-born population - Bolivia (%)
Place of birth for the foreign-born population - Brazil (%)
Place of birth for the foreign-born population - Chile (%)
Place of birth for the foreign-born population - Colombia (%)
Place of birth for the foreign-born population - Ecuador (%)
Place of birth for the foreign-born population - Guyana (%)
Place of birth for the foreign-born population - Peru (%)
Place of birth for the foreign-born population - Uruguay (%)
Place of birth for the foreign-born population - Venezuela (%)
Place of birth for the foreign-born population - Other South America (%)
Place of birth for the foreign-born population - Canada (%)
Place of birth for the foreign-born population - Other Northern America (%)
Place of birth for the foreign-born population - Other (%)
Latest news about races in Westminster, MD collected exclusively by city-data.com from local newspapers, TV, and radio stations
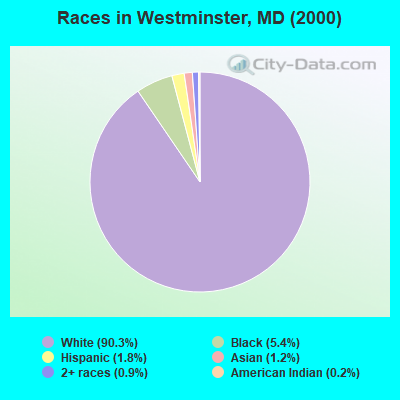
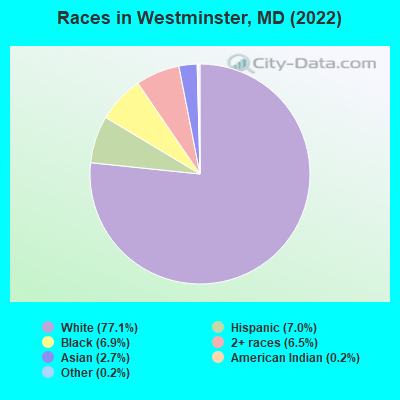
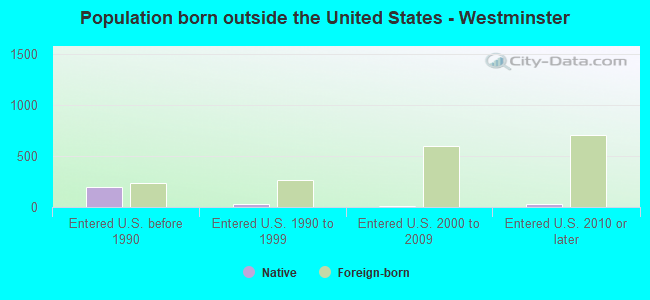
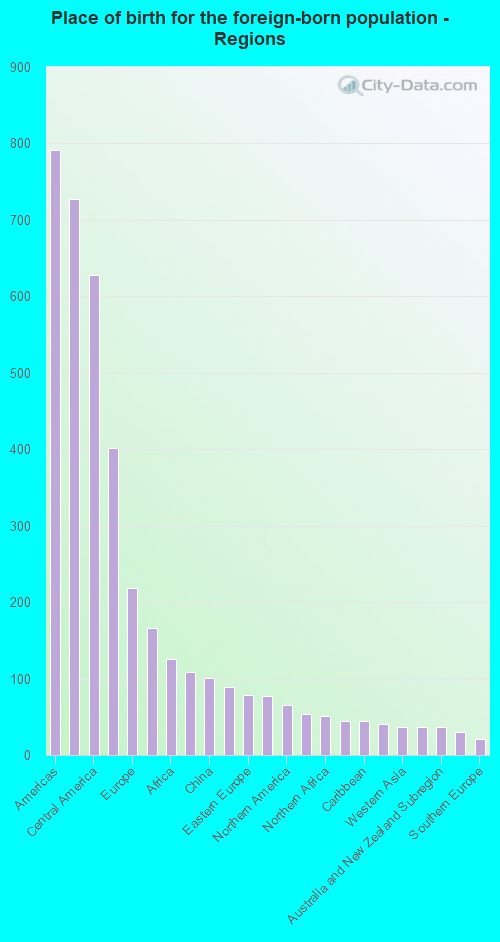
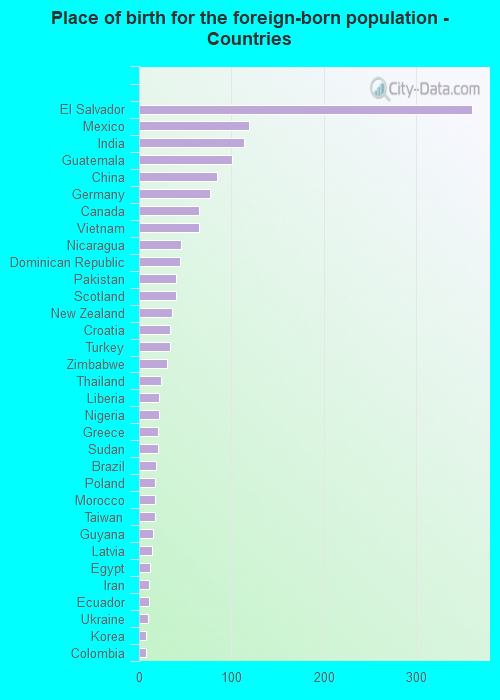
According to 2022 data, the most numerous races in Westminster, MD are White alone (15,690 residents), Black alone (1,404 residents), and Hispanic (1,422 residents). 90.0% of Westminster residents speak English at home. 7.8% of Westminster, MD residents are foreign-born (3.4% born in Latin America, 1.9% born in Asia, 1.0% born in Europe), which is 106.4% less than the foreign-born rate of 16.0% across the entire state of Maryland.
Race distribution in Westminster
2000 2022
3,286,547 62.1% White alone 1,464,735 27.7% Black alone 227,916 4.3% Hispanic 209,738 4.0% Asian alone 82,946 1.6% Two or more races 13,312 0.3% American Indian alone 9,379 0.2% Other race alone 1,913 0.04% Native Hawaiian and Other
2,906,492 47.1% White alone 1,800,914 29.2% Black alone 705,842 11.4% Hispanic 401,818 6.5% Asian alone 291,317 4.7% Two or more races 46,930 0.8% Other race alone 8,930 0.1% American Indian alone 2,417 0.04% Native Hawaiian and Other
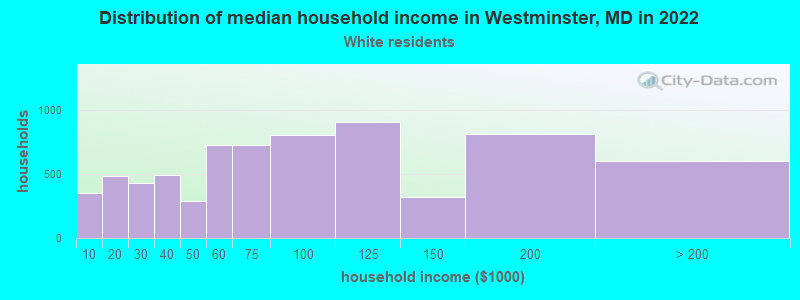
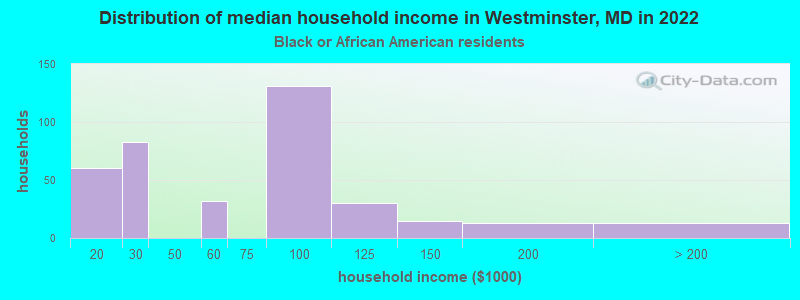
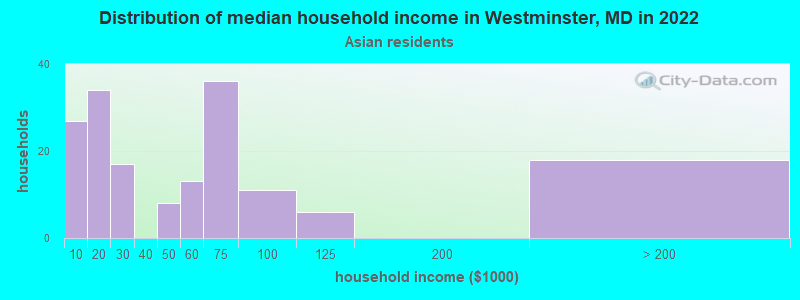
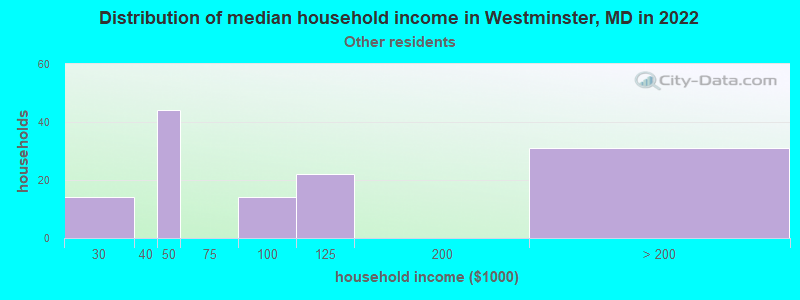
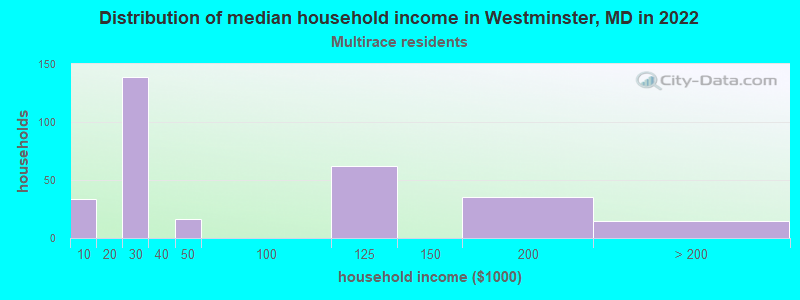
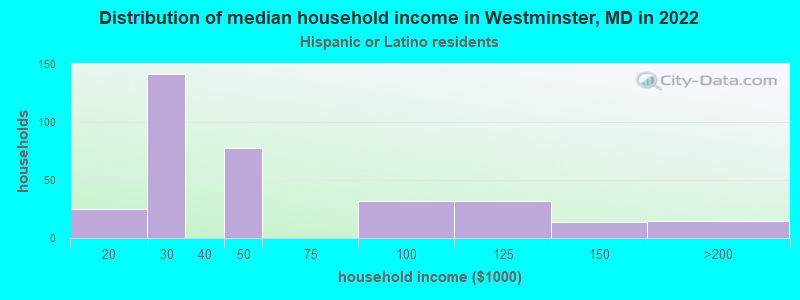
Income and house value in Westminster Median household income in 2022 $67,577 White non-Hispanic householders$73,610 Black householders$70,960 Asian householders$38,357 Hispanic or Latino race householdersMedian 2022 house value $314,752 White Non-Hispanic householders$332,150 Black or African American householders $322,924 Asian householders$332,941 Two or more races householders
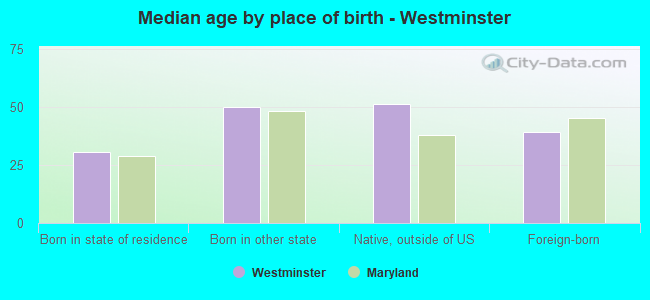
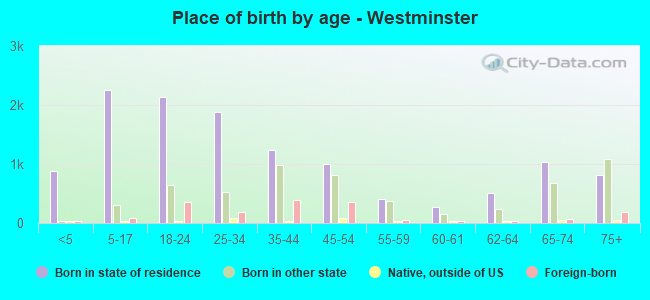
Median age by race in Westminster
42.0 Median age for White residents37.6 46.9 22.8 Median age for Black or African American residents13.7 32.5 18.8 Median age for American Indian / Alaska Native residents-669,090,908.4 27.8 30.2 Median age for Asian residents23.9 31.9 -763,333,332.6 Median age for Native Hawaiian / Pacific Islander residents-666,666,666.0 -666,666,666.0 25.9 Median age for Other race residents26.7 25.5 21.9 Median age for Two or more races residents19.5 23.4 42.2 Median age for White alone residents37.7 46.8 31.9 Median age for Hispanic or Latino residents25.2 44.4
Owner/renter occupied households by race in Westminster
House owners and renters - White residents 3,976 57.5% Owner occupied2,937 42.5% Renter occupiedHouse owners and renters - Black or African American residents 84 18.9% Owner occupied361 81.1% Renter occupiedHouse owners and renters - American Indian / Alaska Native residents 1 100.0% Renter occupiedHouse owners and renters - Asian residents 153 89.2% Owner occupied18 10.8% Renter occupiedHouse owners and renters - Other race residents 44 32.1% Owner occupied94 67.9% Renter occupiedHouse owners and renters - Two or more races residents 106 31.7% Owner occupied228 68.3% Renter occupiedHouse owners and renters - White alone residents 3,935 57.5% Owner occupied2,912 42.5% Renter occupiedHouse owners and renters - Hispanic or Latino residents 79 20.1% Owner occupied314 79.9% Renter occupied
Language usage in Westminster
English speakers - Total 90.0% of residents of Westminster speak English at home.
5.5% of residents speak Spanish at home 611 57.2% Speak English very well457 42.8% Speak English less than very well4.6% of residents speak other language at home 767 85.8% Speak English very well127 14.2% Speak English less than very well
English speakers - Born in the United States 94.9% of residents of Westminster speak English at home.
2.1% of residents speak Spanish at home 125 100.0% Speak English very well2.8% of residents speak other language at home 162 97.6% Speak English very well4 2.4% Speak English less than very well
English speakers - Native, born elsewhere 64.5% of residents of Westminster speak English at home.
26.7% of residents speak Spanish at home 64 70.3% Speak English very well27 29.7% Speak English less than very well6.7% of residents speak other language at home 23 100.0% Speak English very well
English speakers - Foreign-born 27.5% of residents of Westminster speak English at home.
34.1% of residents speak Spanish at home 170 28.0% Speak English very well438 72.0% Speak English less than very well31.6% of residents speak other language at home 428 76.0% Speak English very well135 24.0% Speak English less than very well
White (Caucasian) - Speak only English Native:
98.5% (14,682)Foreign-born:
44.4% (239)
White (Caucasian) - Speak another language Native:
1.2% (176)Foreign-born:
55.0% (296)
Black or African American - Speak only English Native:
97.3% (1,141)Foreign-born:
72.9% (65)
Black or African American - Speak another language Native:
2.6% (30)Foreign-born:
25.1% (23)
Asian - Speak only English Native:
46.2% (83)Foreign-born:
17.9% (66)
Asian - Speak another language Native:
57.1% (103)Foreign-born:
81.0% (299)
Other race - Speak another language Native:
32.3% (15)Foreign-born:
100.0% (311)
Two or more races - Speak only English Native:
74.8% (1,034)Foreign-born:
11.4% (43)
Two or more races - Speak another language Native:
28.6% (396)Foreign-born:
96.1% (362)
White alone - Speak only English Native:
98.8% (14,581)Foreign-born:
55.9% (240)
White alone - Speak another language Native:
1.0% (149)Foreign-born:
39.0% (168)
Hispanic or Latino - Speak only English Native:
50.0% (385)Foreign-born:
0.5% (3)
Hispanic or Latino - Speak another language Native:
51.5% (396)Foreign-born:
100.0% (574)
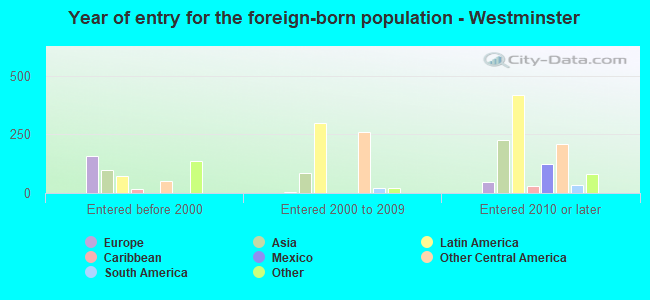
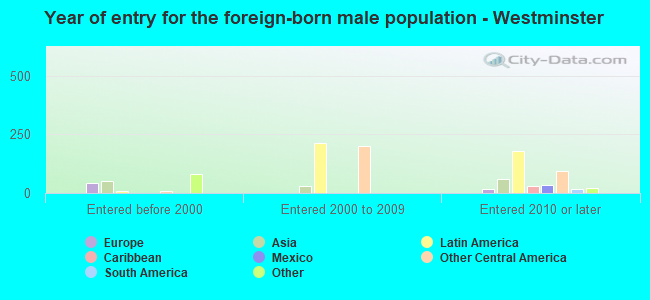
Foreign-born residents in Westminster 1,577 residents are foreign born (3.4% Latin America , 1.9% Asia , 1.0% Europe ).
This city:
7.8%Maryland:
15.7%
Marital status for residents in Westminster Marital status - White (Caucasian) population 15 years and over
Males 37.6% Never married49.7% Now married0.5% Separated5.5% Widowed6.7% DivorcedFemales 29.1% Never married42.2% Now married0.8% Separated13.2% Widowed14.7% DivorcedWomen who gave birth in the past 12 months Now married:
82.2% (169)Unmarried:
17.8% (36)
Women who did not give birth in the past 12 months Now married:
40.6% (1,400)Unmarried:
59.4% (2,051)
Marital status - Black or African American population 15 years and over
Males 77.7% Never married19.7% Now married0.0% Separated0.0% Widowed2.6% DivorcedFemales 65.5% Never married17.6% Now married0.0% Separated0.5% Widowed16.4% DivorcedWomen who gave birth in the past 12 months Now married:
0.0% (0)Unmarried:
100.0% (66)
Women who did not give birth in the past 12 months Now married:
11.8% (44)Unmarried:
88.2% (330)
Marital status - American Indian / Alaska Native population 15 years and over
Males 0.0% Never married100.0% Now married0.0% Separated0.0% Widowed0.0% DivorcedFemales 78.9% Never married0.0% Now married0.0% Separated0.0% Widowed21.1% DivorcedWomen who did not give birth in the past 12 months Now married:
0.0% (0)Unmarried:
100.0% (45)
Marital status - Asian population 15 years and over
Males 41.2% Never married54.2% Now married4.6% Separated0.0% Widowed0.0% DivorcedFemales 50.8% Never married44.7% Now married0.0% Separated4.5% Widowed0.0% DivorcedWomen who did not give birth in the past 12 months Now married:
38.5% (99)Unmarried:
61.5% (158)
Marital status - Other race population 15 years and over
Males 77.9% Never married22.1% Now married0.0% Separated0.0% Widowed0.0% DivorcedFemales 58.1% Never married35.3% Now married0.0% Separated6.6% Widowed0.0% DivorcedWomen who did not give birth in the past 12 months Now married:
40.7% (60)Unmarried:
59.3% (88)
Marital status - Two or more races population 15 years and over
Males 25.2% Never married57.0% Now married0.0% Separated5.2% Widowed12.7% DivorcedFemales 80.0% Never married20.0% Now married0.0% Separated0.0% Widowed0.0% DivorcedWomen who did not give birth in the past 12 months Now married:
19.0% (83)Unmarried:
81.0% (353)
Marital status - White alone, not Hispanic / Latino population 15 years and over
Males 37.1% Never married50.0% Now married0.5% Separated5.6% Widowed6.7% DivorcedFemales 28.5% Never married42.4% Now married0.7% Separated13.4% Widowed15.0% DivorcedWomen who gave birth in the past 12 months Now married:
82.2% (171)Unmarried:
17.8% (37)
Women who did not give birth in the past 12 months Now married:
40.7% (1,384)Unmarried:
59.3% (2,014)
Marital status - Hispanic or Latino population 15 years and over
Males 50.8% Never married42.0% Now married0.6% Separated0.0% Widowed6.6% DivorcedFemales 66.7% Never married29.7% Now married1.7% Separated1.9% Widowed0.0% DivorcedWomen who did not give birth in the past 12 months Now married:
33.9% (133)Unmarried:
66.1% (259)
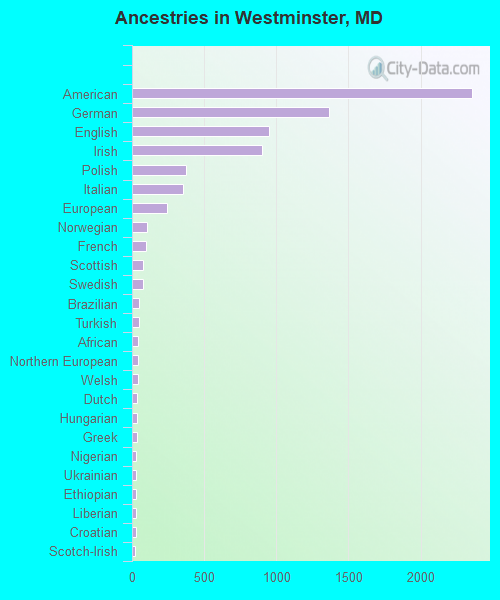
Ancestries in Westminster
2,357 24.2% American1,363 14.0% German947 9.7% English901 9.2% Irish371 3.8% Polish355 3.6% Italian241 2.5% European106 1.1% Norwegian98 1.0% French75 0.8% Scottish75 0.8% Swedish50 0.5% Brazilian47 0.5% Turkish43 0.4% African41 0.4% Northern European40 0.4% Welsh38 0.4% Dutch35 0.4% Hungarian34 0.3% Greek31 0.3% Nigerian30 0.3% Ukrainian27 0.3% Ethiopian26 0.3% Liberian25 0.3% Croatian24 0.2% Scotch-Irish23 0.2% Russian18 0.2% Slovak16 0.2% Swiss15 0.2% French Canadian13 0.1% Canadian13 0.1% Iranian12 0.1% Syrian10 0.1% Lithuanian9 0.09% Czechoslovakian4 0.04% Cape Verdean3 0.03% Jamaican2 0.02% Latvian
Geographical mobility in Westminster Same house 1 year ago 13,726 86.7% White (Caucasian)1,053 71.1% Black or African American56 98.9% American Indian / Alaska Native475 78.3% Asian3 100.0% Native Hawaiian / Pacific Islander358 100.0% Other race1,884 92.3% Two or more races13,480 86.5% White alone, not Hispanic / Latino1,246 95.9% Hispanic or LatinoMoved within same county 676 4.3% White / Caucasian109 7.4% Black or African American71 11.8% Asian675 4.3% White alone, not Hispanic / Latino8 0.6% Hispanic or LatinoMoved within same state 994 6.3% White / Caucasian274 18.5% Black or African American31 5.1% Asian12 0.6% Two or more races1,041 6.7% White alone, not Hispanic / Latino52 4.0% Hispanic or LatinoMoved from different state 382 2.4% White / Caucasian53 3.6% Black or African American16 2.7% Asian75 3.7% Two or more races379 2.4% White alone, not Hispanic / Latino1 0.1% Hispanic or LatinoMoved from abroad 35 0.2% White15 0.1% White alone, not Hispanic / Latino27 2.1% Hispanic or Latino
Children Nativity (place of birth) in Westminster
Children under 6 years - Living with two parents Both parents native 692 100.0% NativeOne native, one foreign-born parent 77 100.0% NativeChildren under 6 years - Living with one parent Native parent 299 100.0% NativeChildren 6 to 17 years - Living with two parents Both parents native 1,323 99.2% Native10 0.8% Foreign-bornBoth parents foreign-born 177 66.9% Native88 33.1% Foreign-bornOne native, one foreign-born parent 133 100.0% NativeChildren 6 to 17 years - Living with one parent Native parent 549 100.0% NativeForeign-born parent 75 61.8% Native47 38.2% Foreign-born
Grandparents responsible for own grandchildren in Westminster
Grandparents (30 to 59 years) White / Caucasian 10 13.5% Responsible for grandchildren67 86.5% Not responsible for grandchildrenTwo or more races 43 100.0% Not responsible for grandchildrenWhite alone, not Hispanic / Latino 11 12.8% Responsible for grandchildren72 87.2% Not responsible for grandchildrenHispanic or Latino 35 100.0% Not responsible for grandchildrenGrandparents (60 years and over) White / Caucasian 13 31.3% Responsible for grandchildren28 68.7% Not responsible for grandchildrenWhite alone, not Hispanic / Latino 13 29.8% Responsible for grandchildren30 70.2% Not responsible for grandchildren