Races in Weston, Vermont (VT) Detailed Stats
Ancestries, Foreign-born residents, place of birth

Recent posts about races in Weston, Vermont on our local forum with over 2,400,000 registered users:
 | Vermont versus New Hampshire living and life styles ... (2 replies) |
| Why is Vermont's Cost of Living so High? (148 replies) |
| Two weeks in Bennington around Christmas (4 replies) |
| Does Vermont want another out-of-stater? (129 replies) |
| Year-round rental houses in Southern VT? (6 replies) |
| Vacation in/near Manchester? (18 replies) |
2.7% of Weston, VT residents are foreign-born (1.3% born in Asia, 0.8% born in Latin America, 0.3% born in Europe, 0.3% born in North America), which is 48.2% less than the foreign-born rate of 4.0% across the entire state of Vermont.
Race distribution in Weston

- 60796.3%White alone
- 111.7%Hispanic
- 50.8%Two or more races
- 40.6%Asian alone
- 20.3%Black alone
- 10.2%American Indian alone

2000
2022
-
- 585,43196.2%White alone
- 6,8091.1%Two or more races
- 5,5040.9%Hispanic
- 5,1600.8%Asian alone
- 2,9210.5%Black alone
- 2,3250.4%American Indian alone
- 5570.09%Other race alone
- 1200.02%Native Hawaiian and Other
Pacific Islander alone

-
- 583,54690.2%White alone
- 27,3404.2%Two or more races
- 14,7702.3%Hispanic
- 11,5121.8%Asian alone
- 6,2641.0%Black alone
- 2,5210.4%Other race alone
- 1,0520.2%American Indian alone
- 590.01%Native Hawaiian and Other
Pacific Islander alone

Income and house value in Weston
- Median household income in 2022
- $79,796White non-Hispanic householders
- over $200,000Two or more races householders
- Median 2022 house value
- $379,470White Non-Hispanic householders
- $467,174Two or more races householders
Household income for White non-Hispanic householders

Household income for Two or more races householders

Foreign-born residents in Weston
17 residents are foreign born (1.3% Asia, 0.8% Latin America, 0.3% Europe, 0.3% North America).
| This city: | 2.7% |
| Vermont: | 3.8% |
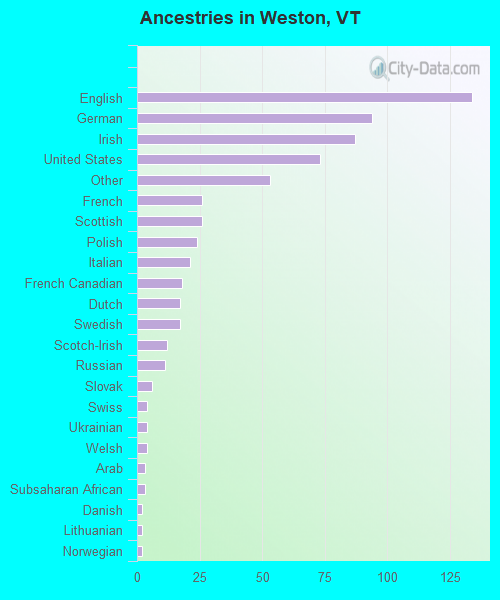
Ancestries in Weston

- 13420.8%English
- 9414.6%German
- 8713.5%Irish
- 7311.3%United States
- 538.2%Other
- 264.0%French
- 264.0%Scottish
- 243.7%Polish
- 213.3%Italian
- 182.8%French Canadian
- 172.6%Dutch
- 172.6%Swedish
- 121.9%Scotch-Irish
- 111.7%Russian
- 60.9%Slovak
- 40.6%Swiss
- 40.6%Ukrainian
- 40.6%Welsh
- 30.5%Arab
- 30.5%Subsaharan African
- 20.3%Danish
- 20.3%Lithuanian
- 20.3%Norwegian
- 10.2%Hungarian
Zip codes: 05161.