Races in Wheaton-Glenmont, Maryland (MD) Detailed Stats
Ancestries, Foreign-born residents, place of birth

Recent posts about races in Wheaton-Glenmont, Maryland on our local forum with over 2,400,000 registered users:

39.6% of Wheaton-Glenmont, MD residents are foreign-born (21.8% born in Latin America, 10.6% born in Asia), which is 59.6% greater than the foreign-born rate of 16.0% across the entire state of Maryland.
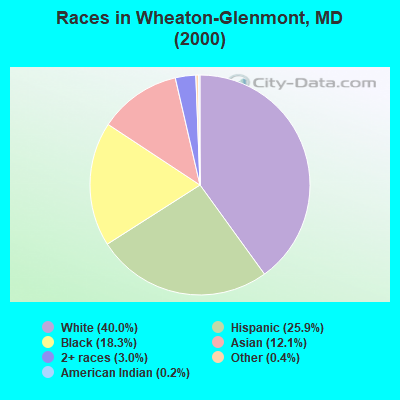
Race distribution in Wheaton-Glenmont

- 23,09340.0%White alone
- 14,95625.9%Hispanic
- 10,56418.3%Black alone
- 6,99012.1%Asian alone
- 1,7053.0%Two or more races
- 2410.4%Other race alone
- 1180.2%American Indian alone
- 270.05%Native Hawaiian and Other
Pacific Islander alone
2000
2022
-
- 3,286,54762.1%White alone
- 1,464,73527.7%Black alone
- 227,9164.3%Hispanic
- 209,7384.0%Asian alone
- 82,9461.6%Two or more races
- 13,3120.3%American Indian alone
- 9,3790.2%Other race alone
- 1,9130.04%Native Hawaiian and Other
Pacific Islander alone

-
- 2,906,49247.1%White alone
- 1,800,91429.2%Black alone
- 705,84211.4%Hispanic
- 401,8186.5%Asian alone
- 291,3174.7%Two or more races
- 46,9300.8%Other race alone
- 8,9300.1%American Indian alone
- 2,4170.04%Native Hawaiian and Other
Pacific Islander alone

Income and house value in Wheaton-Glenmont
- Median household income in 2022
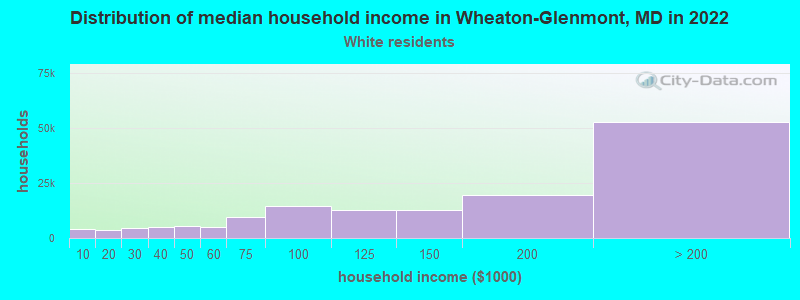
- $111,864White non-Hispanic householders
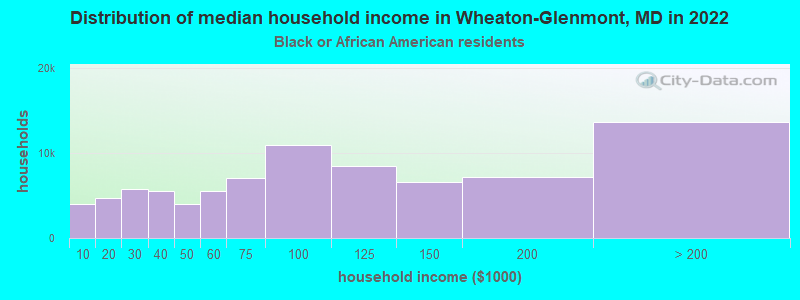
- $97,650Black householders
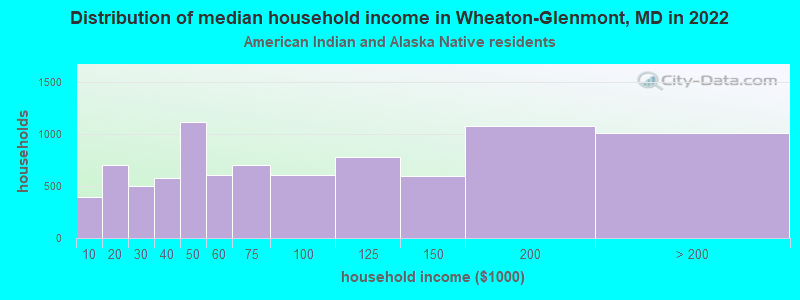
- $84,000American Indian and Alaska Native householders
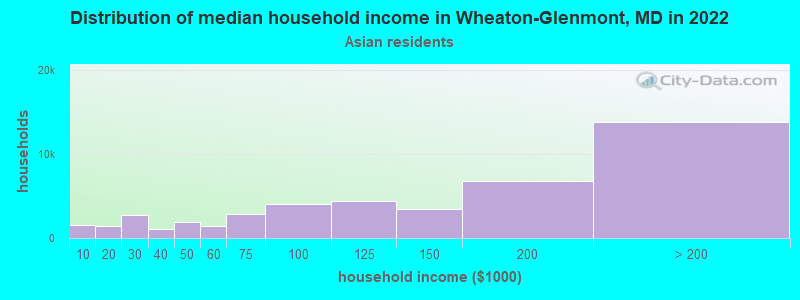
- $109,452Asian householders
- $80,777Some other race householders
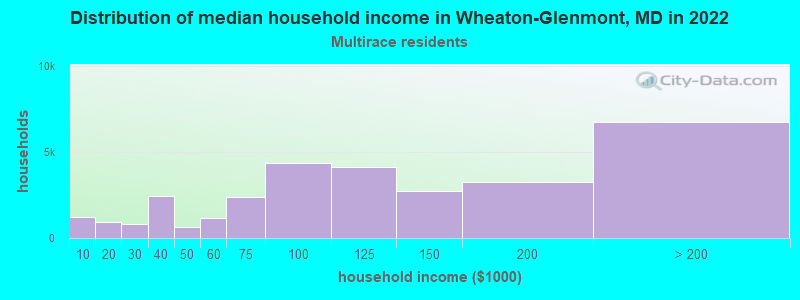
- $107,145Two or more races householders
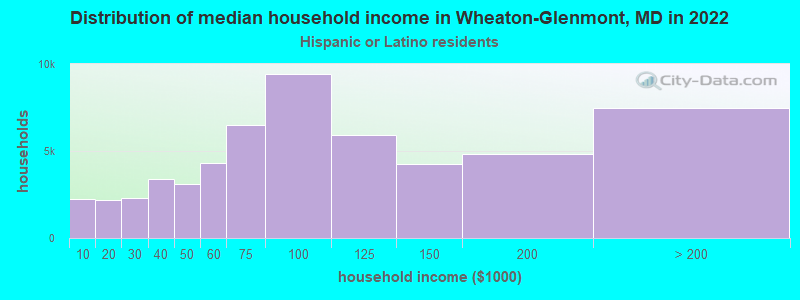
- $82,848Hispanic or Latino race householders
- Median 2022 house value
- $478,430White Non-Hispanic householders
- $492,424Black or African American householders
- $473,765American Indian or Alaska Native householders
- $478,721Asian householders
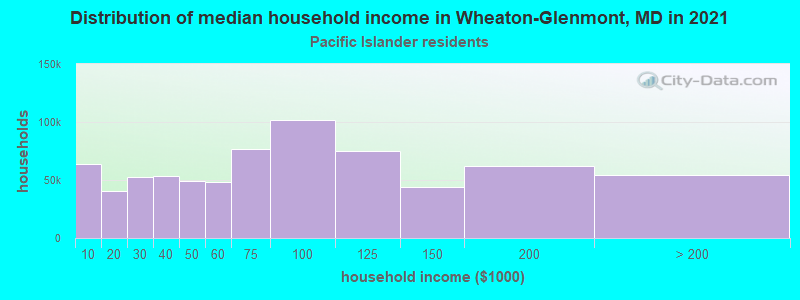
- $655,982Native Hawaiian and other Pacific Islander householders
- $439,362Some other race householders
- $482,511Two or more races householders
- $447,817Hispanic or Latino householders
Household income for White non-Hispanic householders
Household income for Black householders
Household income for American Indian and Alaska Native householders
Household income for Asian householders
Household income for Native Hawaiian and other Pacific Islander householders
Household income for Two or more races householders
Household income for Hispanic or Latino race householders
Foreign-born residents in Wheaton-Glenmont
22,855 residents are foreign born (21.8% Latin America, 10.6% Asia).
| This city: | 39.6% |
| Maryland: | 9.8% |
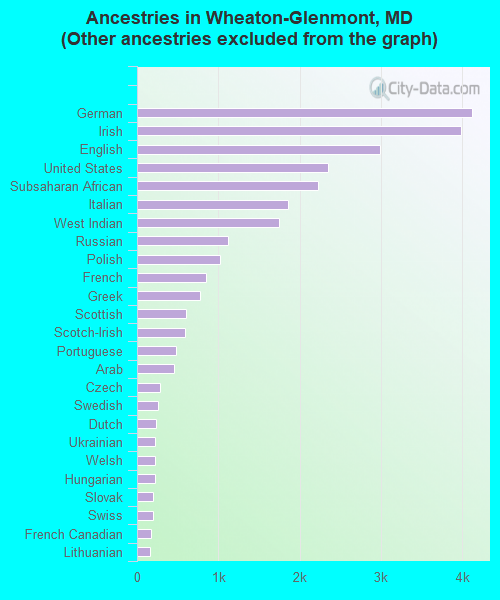
Ancestries in Wheaton-Glenmont

- 30,80952.9%Other
- 4,1227.1%German
- 3,9896.8%Irish
- 2,9945.1%English
- 2,3484.0%United States
- 2,2233.8%Subsaharan African
- 1,8613.2%Italian
- 1,7473.0%West Indian
- 1,1251.9%Russian
- 1,0231.8%Polish
- 8431.4%French
- 7781.3%Greek
- 5991.0%Scottish
- 5871.0%Scotch-Irish
- 4760.8%Portuguese
- 4560.8%Arab
- 2790.5%Czech
- 2570.4%Swedish
- 2320.4%Dutch
- 2260.4%Ukrainian
- 2240.4%Welsh
- 2160.4%Hungarian
- 2000.3%Slovak
- 1930.3%Swiss
- 1740.3%French Canadian
- 1540.3%Lithuanian
- 730.1%Danish
- 730.1%Norwegian
Zip codes: 20902.