Races in Wheeling, Illinois (IL) Detailed Stats
Data:
Races - White alone (%)
Races - White alone (% change since 2000)
Races - Black alone (%)
Races - Black alone (% change since 2000)
Races - American Indian alone (%)
Races - American Indian alone (% change since 2000)
Races - Asian alone (%)
Races - Asian alone (% change since 2000)
Races - Hispanic (%)
Races - Hispanic (% change since 2000)
Races - Native Hawaiian and Other Pacific Islander alone (%)
Races - Native Hawaiian and Other Pacific Islander alone (% change since 2000)
Races - Two or more races(%)
Races - Two or more races(% change since 2000)
Races - Other race alone (%)
Races - Other race alone (% change since 2000)
Racial diversity
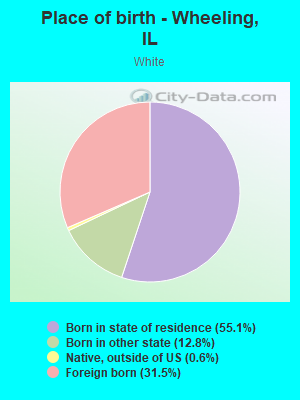
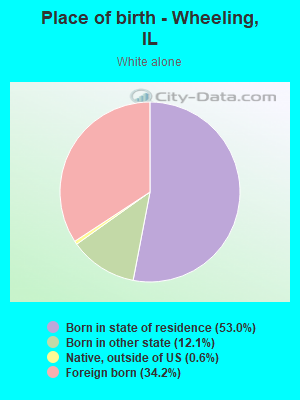
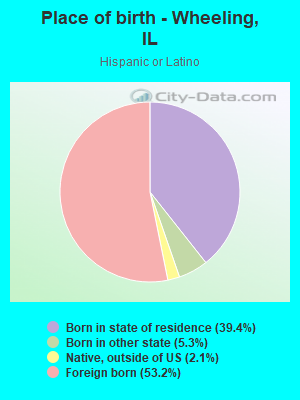
Place of birth - Born in state of residence (%)
Place of birth - Born in state of residence (%) - White
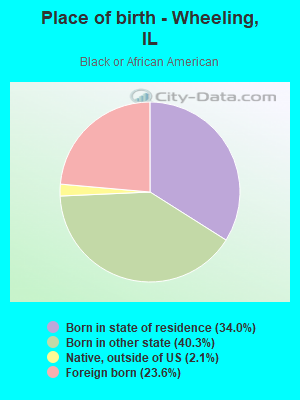
Place of birth - Born in state of residence (%) - Black or African American
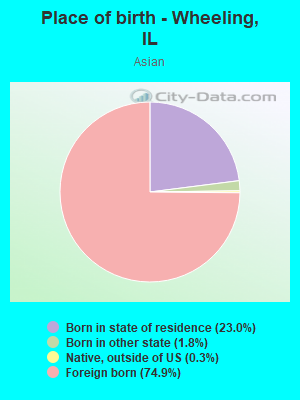
Place of birth - Born in state of residence (%) - Asian
Place of birth - Born in state of residence (%) - Hispanic or Latino
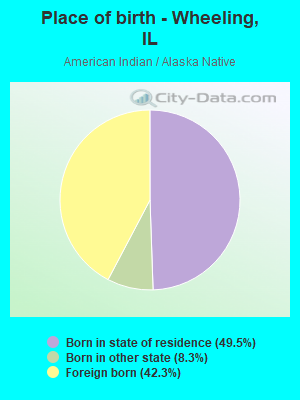
Place of birth - Born in state of residence (%) - American Indian and Alaska Native
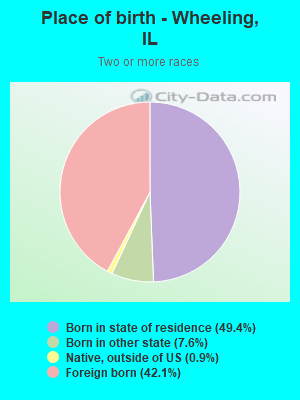
Place of birth - Born in state of residence (%) - Multirace
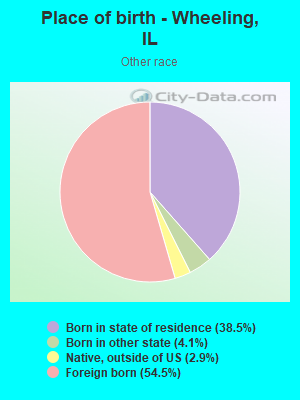
Place of birth - Born in state of residence (%) - Other Race
Place of birth - Born in other state (%)
Place of birth - Born in other state (%) - White
Place of birth - Born in other state (%) - Black or African American
Place of birth - Born in other state (%) - Asian
Place of birth - Born in other state (%) - Hispanic or Latino
Place of birth - Born in other state (%) - American Indian and Alaska Native
Place of birth - Born in other state (%) - Multirace
Place of birth - Born in other state (%) - Other Race
Place of birth - Native, outside of US (%)
Place of birth - Native, outside of US (%) - White
Place of birth - Native, outside of US (%) - Black or African American
Place of birth - Native, outside of US (%) - Asian
Place of birth - Native, outside of US (%) - Hispanic or Latino
Place of birth - Native, outside of US (%) - American Indian and Alaska Native
Place of birth - Native, outside of US (%) - Multirace
Place of birth - Native, outside of US (%) - Other Race
Place of birth - Foreign born (%)
Place of birth - Foreign born (%) - White
Place of birth - Foreign born (%) - Black or African American
Place of birth - Foreign born (%) - Asian
Place of birth - Foreign born (%) - Hispanic or Latino
Place of birth - Foreign born (%) - American Indian and Alaska Native
Place of birth - Foreign born (%) - Multirace
Place of birth - Foreign born (%) - Other Race
Residents speaking English at home (%)
Residents speaking English at home - Born in the United States (%)
Residents speaking English at home - Native, born elsewhere (%)
Residents speaking English at home - Foreign born (%)
Residents speaking Spanish at home (%)
Residents speaking Spanish at home - Born in the United States (%)
Residents speaking Spanish at home - Native, born elsewhere (%)
Residents speaking Spanish at home - Foreign born (%)
Residents speaking other language at home (%)
Residents speaking other language at home - Born in the United States (%)
Residents speaking other language at home - Native, born elsewhere (%)
Residents speaking other language at home - Foreign born (%)
Marital status - Never married (%)
Marital status - Now married (%)
Marital status - Separated (%)
Marital status - Widowed (%)
Marital status - Divorced (%)
Ancestries Reported - Arab (%)
Ancestries Reported - Czech (%)
Ancestries Reported - Danish (%)
Ancestries Reported - Dutch (%)
Ancestries Reported - English (%)
Ancestries Reported - French (%)
Ancestries Reported - French Canadian (%)
Ancestries Reported - German (%)
Ancestries Reported - Greek (%)
Ancestries Reported - Hungarian (%)
Ancestries Reported - Irish (%)
Ancestries Reported - Italian (%)
Ancestries Reported - Lithuanian (%)
Ancestries Reported - Norwegian (%)
Ancestries Reported - Polish (%)
Ancestries Reported - Portuguese (%)
Ancestries Reported - Russian (%)
Ancestries Reported - Scotch-Irish (%)
Ancestries Reported - Scottish (%)
Ancestries Reported - Slovak (%)
Ancestries Reported - Subsaharan African (%)
Ancestries Reported - Swedish (%)
Ancestries Reported - Swiss (%)
Ancestries Reported - Ukrainian (%)
Ancestries Reported - United States (%)
Ancestries Reported - Welsh (%)
Ancestries Reported - West Indian (%)
Ancestries Reported - Other (%)
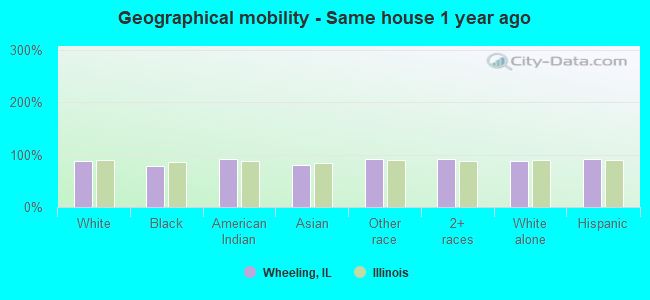
Geographical mobility - Same house 1 year ago (%)
Geographical mobility - Same house 1 year ago (%) - White
Geographical mobility - Same house 1 year ago (%) - Black or African American
Geographical mobility - Same house 1 year ago (%) - Asian
Geographical mobility - Same house 1 year ago (%) - Hispanic or Latino
Geographical mobility - Same house 1 year ago (%) - American Indian and Alaska Native
Geographical mobility - Same house 1 year ago (%) - Multirace
Geographical mobility - Same house 1 year ago (%) - Other Race
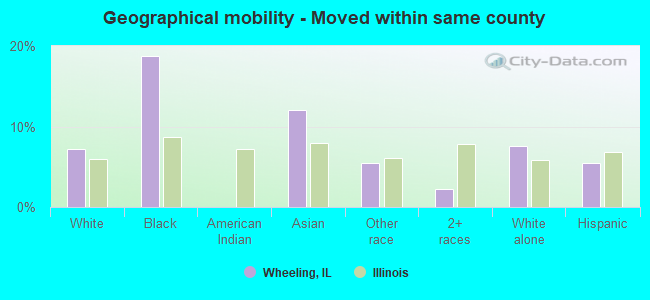
Geographical mobility - Moved within same county (%)
Geographical mobility - Moved within same county (%) - White
Geographical mobility - Moved within same county (%) - Black or African American
Geographical mobility - Moved within same county (%) - Asian
Geographical mobility - Moved within same county (%) - Hispanic or Latino
Geographical mobility - Moved within same county (%) - American Indian and Alaska Native
Geographical mobility - Moved within same county (%) - Multirace
Geographical mobility - Moved within same county (%) - Other Race
Geographical mobility - Moved from different county within same state (%)
Geographical mobility - Moved from different county within same state (%) - White
Geographical mobility - Moved from different county within same state (%) - Black or African American
Geographical mobility - Moved from different county within same state (%) - Asian
Geographical mobility - Moved from different county within same state (%) - Hispanic or Latino
Geographical mobility - Moved from different county within same state (%) - American Indian and Alaska Native
Geographical mobility - Moved from different county within same state (%) - Multirace
Geographical mobility - Moved from different county within same state (%) - Other Race
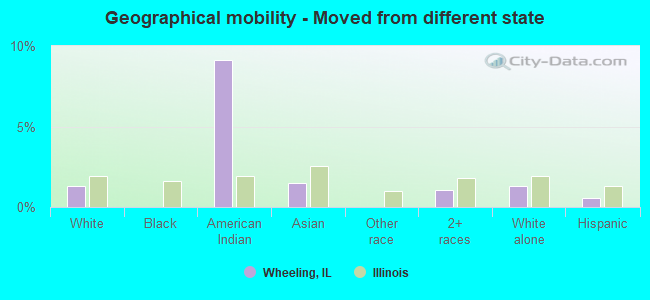
Geographical mobility - Moved from different state (%)
Geographical mobility - Moved from different state (%) - White
Geographical mobility - Moved from different state (%) - Black or African American
Geographical mobility - Moved from different state (%) - Asian
Geographical mobility - Moved from different state (%) - Hispanic or Latino
Geographical mobility - Moved from different state (%) - American Indian and Alaska Native
Geographical mobility - Moved from different state (%) - Multirace
Geographical mobility - Moved from different state (%) - Other Race
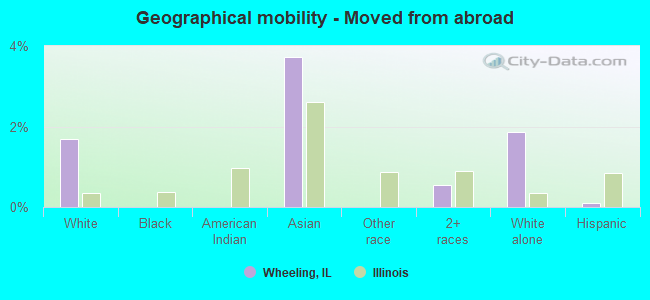
Geographical mobility - Moved from abroad (%)
Geographical mobility - Moved from abroad (%) - White
Geographical mobility - Moved from abroad (%) - Black or African American
Geographical mobility - Moved from abroad (%) - Asian
Geographical mobility - Moved from abroad (%) - Hispanic or Latino
Geographical mobility - Moved from abroad (%) - American Indian and Alaska Native
Geographical mobility - Moved from abroad (%) - Multirace
Geographical mobility - Moved from abroad (%) - Other Race
Place of birth for the foreign-born population - Ireland (%)
Place of birth for the foreign-born population - Denmark (%)
Place of birth for the foreign-born population - Norway (%)
Place of birth for the foreign-born population - Sweden (%)
Place of birth for the foreign-born population - United Kingdom (%)
Place of birth for the foreign-born population - England (%)
Place of birth for the foreign-born population - Scotland (%)
Place of birth for the foreign-born population - Other Northern Europe (%)
Place of birth for the foreign-born population - Austria (%)
Place of birth for the foreign-born population - Belgium (%)
Place of birth for the foreign-born population - France (%)
Place of birth for the foreign-born population - Germany (%)
Place of birth for the foreign-born population - Netherlands (%)
Place of birth for the foreign-born population - Switzerland (%)
Place of birth for the foreign-born population - Other Western Europe (%)
Place of birth for the foreign-born population - Greece (%)
Place of birth for the foreign-born population - Italy (%)
Place of birth for the foreign-born population - Portugal (%)
Place of birth for the foreign-born population - Spain (%)
Place of birth for the foreign-born population - Other Southern Europe (%)
Place of birth for the foreign-born population - Albania (%)
Place of birth for the foreign-born population - Belarus (%)
Place of birth for the foreign-born population - Bosnia and Herzegovina (%)
Place of birth for the foreign-born population - Bulgaria (%)
Place of birth for the foreign-born population - Croatia (%)
Place of birth for the foreign-born population - Czechoslovakia (%)
Place of birth for the foreign-born population - Hungary (%)
Place of birth for the foreign-born population - Latvia (%)
Place of birth for the foreign-born population - Lithuania (%)
Place of birth for the foreign-born population - North Macedonia (Macedonia) (%)
Place of birth for the foreign-born population - Moldova (%)
Place of birth for the foreign-born population - Poland (%)
Place of birth for the foreign-born population - Romania (%)
Place of birth for the foreign-born population - Russia (%)
Place of birth for the foreign-born population - Serbia (%)
Place of birth for the foreign-born population - Ukraine (%)
Place of birth for the foreign-born population - Other Eastern Europe (%)
Place of birth for the foreign-born population - China (%)
Place of birth for the foreign-born population - Hong Kong (%)
Place of birth for the foreign-born population - Taiwan (%)
Place of birth for the foreign-born population - Japan (%)
Place of birth for the foreign-born population - Korea (%)
Place of birth for the foreign-born population - Other Eastern Asia (%)
Place of birth for the foreign-born population - Afghanistan (%)
Place of birth for the foreign-born population - Bangladesh (%)
Place of birth for the foreign-born population - India (%)
Place of birth for the foreign-born population - Iran (%)
Place of birth for the foreign-born population - Kazakhstan (%)
Place of birth for the foreign-born population - Nepal (%)
Place of birth for the foreign-born population - Pakistan (%)
Place of birth for the foreign-born population - Sri Lanka (%)
Place of birth for the foreign-born population - Uzbekistan (%)
Place of birth for the foreign-born population - Other South Central Asia (%)
Place of birth for the foreign-born population - Burma (%)
Place of birth for the foreign-born population - Cambodia (%)
Place of birth for the foreign-born population - Indonesia (%)
Place of birth for the foreign-born population - Laos (%)
Place of birth for the foreign-born population - Malaysia (%)
Place of birth for the foreign-born population - Philippines (%)
Place of birth for the foreign-born population - Singapore (%)
Place of birth for the foreign-born population - Thailand (%)
Place of birth for the foreign-born population - Vietnam (%)
Place of birth for the foreign-born population - Other South Eastern Asia (%)
Place of birth for the foreign-born population - Armenia (%)
Place of birth for the foreign-born population - Iraq (%)
Place of birth for the foreign-born population - Israel (%)
Place of birth for the foreign-born population - Jordan (%)
Place of birth for the foreign-born population - Kuwait (%)
Place of birth for the foreign-born population - Lebanon (%)
Place of birth for the foreign-born population - Saudi Arabia (%)
Place of birth for the foreign-born population - Syria (%)
Place of birth for the foreign-born population - Turkey (%)
Place of birth for the foreign-born population - Yemen (%)
Place of birth for the foreign-born population - Other Western Asia (%)
Place of birth for the foreign-born population - Eritrea (%)
Place of birth for the foreign-born population - Ethiopia (%)
Place of birth for the foreign-born population - Kenya (%)
Place of birth for the foreign-born population - Somalia (%)
Place of birth for the foreign-born population - Uganda (%)
Place of birth for the foreign-born population - Zimbabwe (%)
Place of birth for the foreign-born population - Other Eastern Africa (%)
Place of birth for the foreign-born population - Cameroon (%)
Place of birth for the foreign-born population - Congo (%)
Place of birth for the foreign-born population - Democratic Republic of Congo (Zaire) (%)
Place of birth for the foreign-born population - Other Middle Africa (%)
Place of birth for the foreign-born population - Egypt (%)
Place of birth for the foreign-born population - Morocco (%)
Place of birth for the foreign-born population - Sudan (%)
Place of birth for the foreign-born population - Other Northern Africa (%)
Place of birth for the foreign-born population - South Africa (%)
Place of birth for the foreign-born population - Other Southern Africa (%)
Place of birth for the foreign-born population - Cabo Verde (%)
Place of birth for the foreign-born population - Ghana (%)
Place of birth for the foreign-born population - Liberia (%)
Place of birth for the foreign-born population - Nigeria (%)
Place of birth for the foreign-born population - Senegal (%)
Place of birth for the foreign-born population - Sierra Leone (%)
Place of birth for the foreign-born population - Other Western Africa (%)
Place of birth for the foreign-born population - Australia (%)
Place of birth for the foreign-born population - New Zealand (%)
Place of birth for the foreign-born population - Fiji (%)
Place of birth for the foreign-born population - Micronesia (%)
Place of birth for the foreign-born population - Bahamas (%)
Place of birth for the foreign-born population - Barbados (%)
Place of birth for the foreign-born population - Cuba (%)
Place of birth for the foreign-born population - Dominica (%)
Place of birth for the foreign-born population - Dominican Republic (%)
Place of birth for the foreign-born population - Grenada (%)
Place of birth for the foreign-born population - Haiti (%)
Place of birth for the foreign-born population - Jamaica (%)
Place of birth for the foreign-born population - St. Vincent and the Grenadines (%)
Place of birth for the foreign-born population - Trinidad and Tobago (%)
Place of birth for the foreign-born population - West Indies (%)
Place of birth for the foreign-born population - Other Caribbean (%)
Place of birth for the foreign-born population - Belize (%)
Place of birth for the foreign-born population - Costa Rica (%)
Place of birth for the foreign-born population - El Salvador (%)
Place of birth for the foreign-born population - Guatemala (%)
Place of birth for the foreign-born population - Honduras (%)
Place of birth for the foreign-born population - Mexico (%)
Place of birth for the foreign-born population - Nicaragua (%)
Place of birth for the foreign-born population - Panama (%)
Place of birth for the foreign-born population - Other Central America (%)
Place of birth for the foreign-born population - Argentina (%)
Place of birth for the foreign-born population - Bolivia (%)
Place of birth for the foreign-born population - Brazil (%)
Place of birth for the foreign-born population - Chile (%)
Place of birth for the foreign-born population - Colombia (%)
Place of birth for the foreign-born population - Ecuador (%)
Place of birth for the foreign-born population - Guyana (%)
Place of birth for the foreign-born population - Peru (%)
Place of birth for the foreign-born population - Uruguay (%)
Place of birth for the foreign-born population - Venezuela (%)
Place of birth for the foreign-born population - Other South America (%)
Place of birth for the foreign-born population - Canada (%)
Place of birth for the foreign-born population - Other Northern America (%)
Place of birth for the foreign-born population - Other (%)
Latest news about races in Wheeling, IL collected exclusively by city-data.com from local newspapers, TV, and radio stations
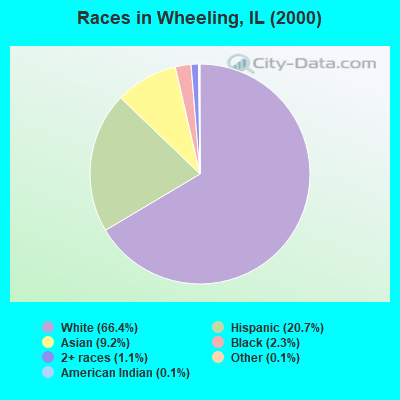
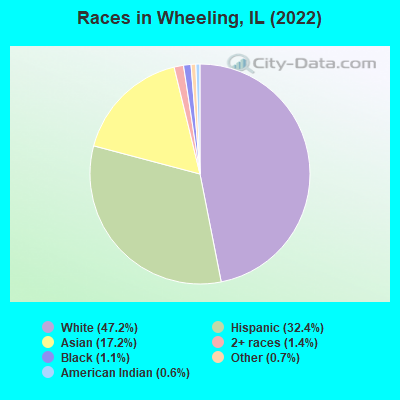
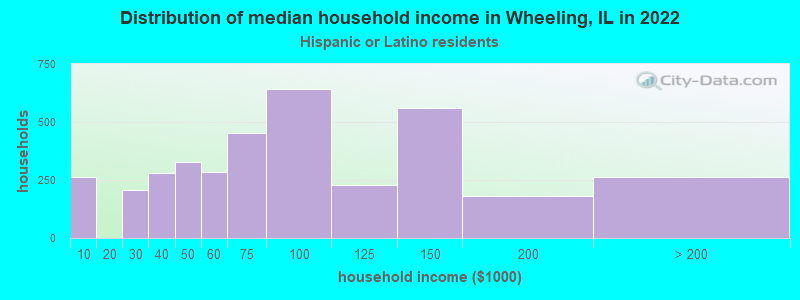
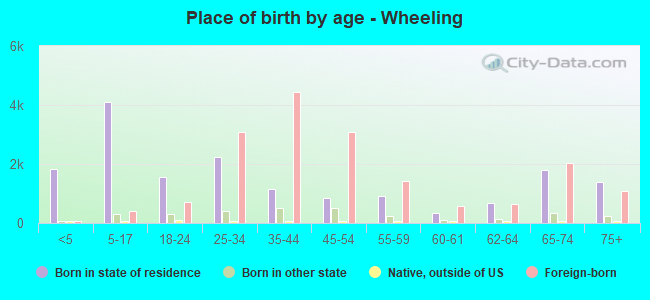
According to 2022 data, the most numerous races in Wheeling, IL are White alone (17,932 residents), Hispanic (12,296 residents), and Black alone (425 residents). 35.7% of Wheeling residents speak English at home. 46.6% of Wheeling, IL residents are foreign-born (16.9% born in Latin America, 14.8% born in Europe, 13.6% born in Asia), which is 69.9% greater than the foreign-born rate of 14.0% across the entire state of Illinois.
Race distribution in Wheeling
2000 2022
8,424,140 67.8% White alone 1,856,152 14.9% Black alone 1,530,262 12.3% Hispanic 419,916 3.4% Asian alone 153,996 1.2% Two or more races 13,479 0.1% Other race alone 18,232 0.1% American Indian alone 3,116 0.03% Native Hawaiian and Other
7,356,301 58.5% White alone 2,299,726 18.3% Hispanic 1,660,423 13.2% Black alone 747,296 5.9% Asian alone 458,599 3.6% Two or more races 45,386 0.4% Other race alone 10,405 0.08% American Indian alone 3,896 0.03% Native Hawaiian and Other
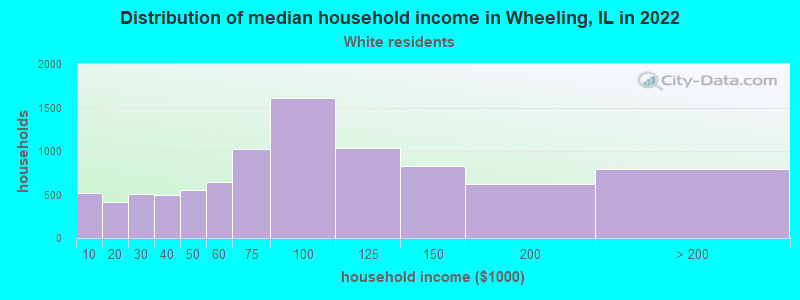
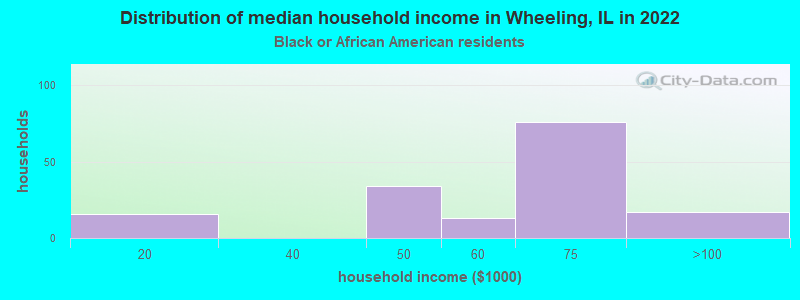
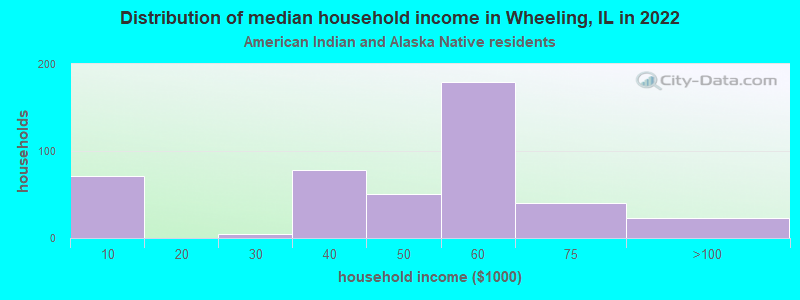
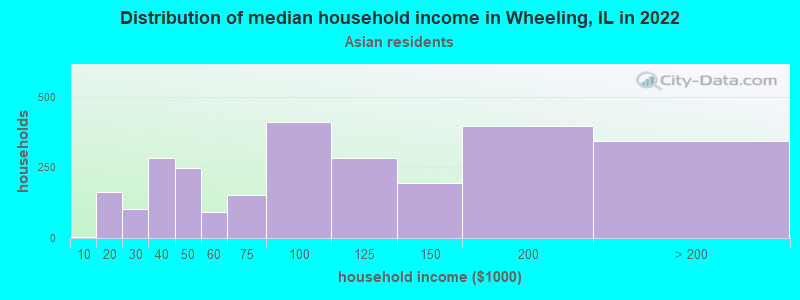
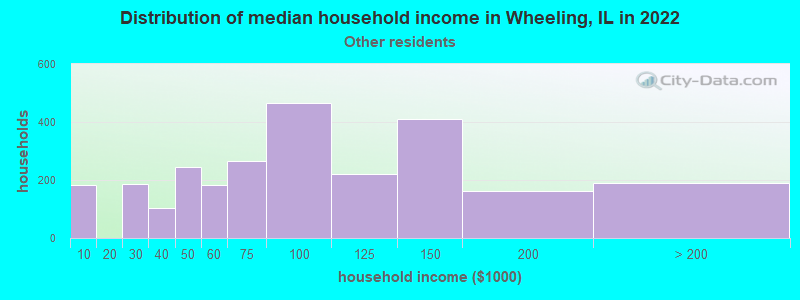
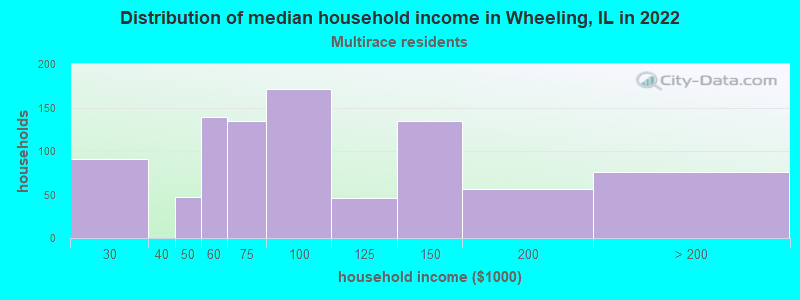
Income and house value in Wheeling Median household income in 2022 $78,270 White non-Hispanic householders$59,080 Black householders$55,134 American Indian and Alaska Native householders$90,397 Asian householders$82,608 Some other race householders$72,315 Two or more races householders$77,234 Hispanic or Latino race householdersMedian 2022 house value $268,754 White Non-Hispanic householders$250,628 Black or African American householders$308,960 American Indian or Alaska Native householders $346,365 Asian householders$230,855 Some other race householders$232,173 Two or more races householders$236,292 Hispanic or Latino householders
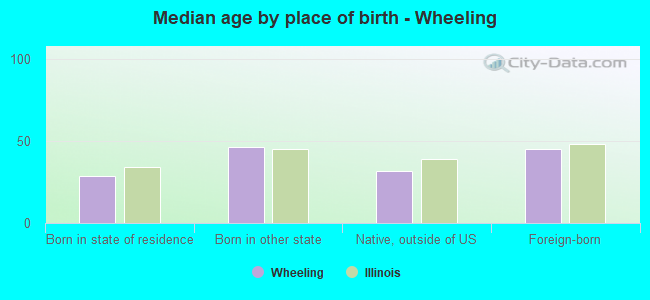
Median age by race in Wheeling
49.2 Median age for White residents48.4 50.2 40.4 Median age for Black or African American residents40.6 56.2 51.5 Median age for American Indian / Alaska Native residents47.6 58.6 37.7 Median age for Asian residents35.1 39.8 -687,999,999.3 Median age for Native Hawaiian / Pacific Islander residents-918,721,460.3 -610,229,276.3 33.5 Median age for Other race residents34.4 33.0 33.5 Median age for Two or more races residents36.8 29.3 50.7 Median age for White alone residents49.5 51.5 33.2 Median age for Hispanic or Latino residents34.1 31.6
Owner/renter occupied households by race in Wheeling
House owners and renters - White residents 6,177 68.7% Owner occupied2,817 31.3% Renter occupiedHouse owners and renters - Black or African American residents 16 10.3% Owner occupied141 89.7% Renter occupiedHouse owners and renters - American Indian / Alaska Native residents 353 60.4% Owner occupied231 39.6% Renter occupiedHouse owners and renters - Asian residents 1,426 53.6% Owner occupied1,234 46.4% Renter occupiedHouse owners and renters - Other race residents 1,426 54.7% Owner occupied1,181 45.3% Renter occupiedHouse owners and renters - Two or more races residents 646 69.1% Owner occupied289 30.9% Renter occupiedHouse owners and renters - White alone residents 6,116 68.0% Owner occupied2,879 32.0% Renter occupiedHouse owners and renters - Hispanic or Latino residents 2,068 56.6% Owner occupied1,586 43.4% Renter occupied
Language usage in Wheeling
English speakers - Total 35.7% of residents of Wheeling speak English at home.
29.6% of residents speak Spanish at home 5,998 56.3% Speak English very well4,660 43.7% Speak English less than very well35.5% of residents speak other language at home 7,256 56.8% Speak English very well5,529 43.2% Speak English less than very well
English speakers - Born in the United States 76.7% of residents of Wheeling speak English at home.
17.4% of residents speak Spanish at home 474 86.7% Speak English very well73 13.3% Speak English less than very well5.4% of residents speak other language at home 134 79.3% Speak English very well35 20.7% Speak English less than very well
English speakers - Native, born elsewhere 38.4% of residents of Wheeling speak English at home.
48.3% of residents speak Spanish at home 119 64.3% Speak English very well66 35.7% Speak English less than very well13.1% of residents speak other language at home 33 66.0% Speak English very well17 34.0% Speak English less than very well
English speakers - Foreign-born 6.9% of residents of Wheeling speak English at home.
35.8% of residents speak Spanish at home 2,292 36.3% Speak English very well4,014 63.7% Speak English less than very well57.5% of residents speak other language at home 4,950 48.8% Speak English very well5,193 51.2% Speak English less than very well
White (Caucasian) - Speak only English Native:
82.2% (9,354)Foreign-born:
7.7% (429)
White (Caucasian) - Speak another language Native:
15.9% (1,814)Foreign-born:
91.8% (5,087)
Black or African American - Speak only English Native:
96.5% (377)Foreign-born:
17.9% (22)
Black or African American - Speak another language Native:
3.5% (14)Foreign-born:
77.5% (95)
American Indian / Alaska Native - Speak another language Native:
38.8% (226)Foreign-born:
100.0% (421)
Asian - Speak only English Native:
47.9% (618)Foreign-born:
8.1% (394)
Asian - Speak another language Native:
52.0% (671)Foreign-born:
92.4% (4,514)
Other race - Speak only English Native:
6.7% (241)Foreign-born:
4.9% (246)
Other race - Speak another language Native:
91.7% (3,280)Foreign-born:
95.1% (4,810)
Two or more races - Speak only English Native:
43.6% (620)Foreign-born:
9.2% (113)
Two or more races - Speak another language Native:
57.4% (817)Foreign-born:
90.8% (1,112)
White alone - Speak only English Native:
83.7% (9,235)Foreign-born:
7.2% (445)
White alone - Speak another language Native:
17.2% (1,894)Foreign-born:
93.7% (5,764)
Hispanic or Latino - Speak only English Native:
15.0% (758)Foreign-born:
4.4% (287)
Hispanic or Latino - Speak another language Native:
83.9% (4,247)Foreign-born:
95.6% (6,271)
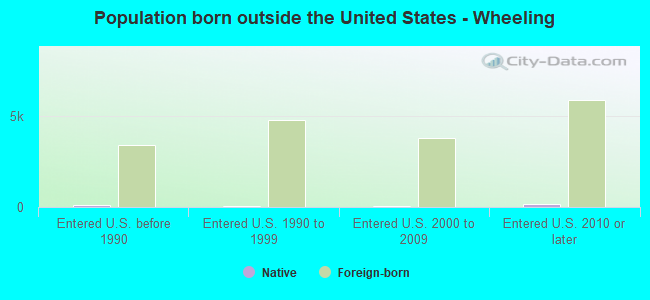
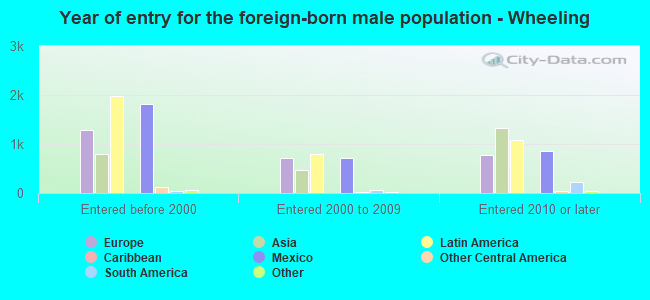
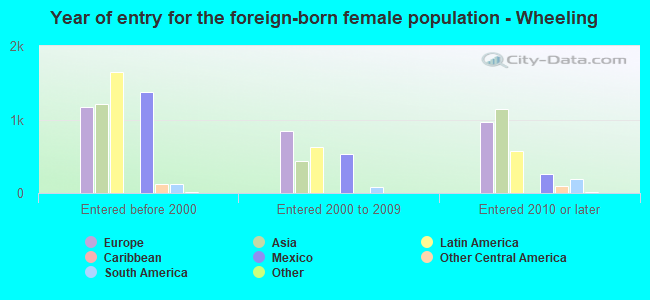
Foreign-born residents in Wheeling 17,682 residents are foreign born (16.9% Latin America , 14.8% Europe , 13.6% Asia ).
This city:
46.6%Illinois:
14.1%
Marital status for residents in Wheeling Marital status - White (Caucasian) population 15 years and over
Males 31.3% Never married54.6% Now married1.0% Separated2.5% Widowed10.7% DivorcedFemales 23.0% Never married45.2% Now married1.4% Separated9.3% Widowed21.1% DivorcedWomen who gave birth in the past 12 months Now married:
82.4% (119)Unmarried:
17.6% (25)
Women who did not give birth in the past 12 months Now married:
48.2% (1,739)Unmarried:
51.8% (1,869)
Marital status - Black or African American population 15 years and over
Males 74.9% Never married25.1% Now married0.0% Separated0.0% Widowed0.0% DivorcedFemales 38.4% Never married29.4% Now married0.0% Separated13.0% Widowed19.2% DivorcedWomen who did not give birth in the past 12 months Now married:
65.8% (49)Unmarried:
34.2% (25)
Marital status - American Indian / Alaska Native population 15 years and over
Males 57.9% Never married28.1% Now married13.0% Separated0.0% Widowed1.0% DivorcedFemales 14.6% Never married25.2% Now married5.4% Separated45.9% Widowed8.8% DivorcedWomen who did not give birth in the past 12 months Now married:
94.1% (116)Unmarried:
5.9% (7)
Marital status - Asian population 15 years and over
Males 26.2% Never married69.4% Now married0.5% Separated0.0% Widowed3.9% DivorcedFemales 16.6% Never married69.8% Now married1.4% Separated6.3% Widowed6.0% DivorcedWomen who gave birth in the past 12 months Now married:
100.0% (99)Unmarried:
0.0% (0)
Women who did not give birth in the past 12 months Now married:
69.0% (1,146)Unmarried:
31.0% (516)
Marital status - Other race population 15 years and over
Males 44.6% Never married44.1% Now married2.6% Separated3.1% Widowed5.6% DivorcedFemales 37.4% Never married43.2% Now married11.5% Separated0.7% Widowed7.2% DivorcedWomen who gave birth in the past 12 months Now married:
86.5% (36)Unmarried:
13.5% (6)
Women who did not give birth in the past 12 months Now married:
48.9% (1,081)Unmarried:
51.1% (1,132)
Marital status - Two or more races population 15 years and over
Males 37.0% Never married54.4% Now married0.0% Separated0.0% Widowed8.6% DivorcedFemales 36.2% Never married46.1% Now married6.4% Separated5.7% Widowed5.6% DivorcedWomen who gave birth in the past 12 months Now married:
100.0% (53)Unmarried:
0.0% (0)
Women who did not give birth in the past 12 months Now married:
36.2% (280)Unmarried:
63.8% (494)
Marital status - White alone, not Hispanic / Latino population 15 years and over
Males 28.6% Never married56.3% Now married1.1% Separated2.6% Widowed11.5% DivorcedFemales 21.8% Never married45.4% Now married1.2% Separated10.4% Widowed21.3% DivorcedWomen who gave birth in the past 12 months Now married:
100.0% (133)Unmarried:
0.0% (0)
Women who did not give birth in the past 12 months Now married:
49.6% (1,672)Unmarried:
50.4% (1,698)
Marital status - Hispanic or Latino population 15 years and over
Males 45.0% Never married45.1% Now married2.5% Separated2.3% Widowed5.1% DivorcedFemales 35.7% Never married44.6% Now married8.9% Separated0.8% Widowed10.0% DivorcedWomen who gave birth in the past 12 months Now married:
62.0% (57)Unmarried:
38.0% (35)
Women who did not give birth in the past 12 months Now married:
47.1% (1,520)Unmarried:
52.9% (1,705)
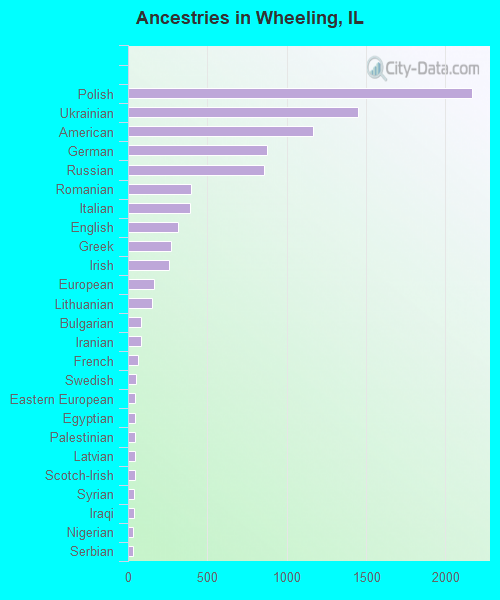
Ancestries in Wheeling
2,166 8.9% Polish1,449 5.9% Ukrainian1,166 4.8% American873 3.6% German857 3.5% Russian394 1.6% Romanian389 1.6% Italian315 1.3% English271 1.1% Greek260 1.1% Irish162 0.7% European153 0.6% Lithuanian83 0.3% Bulgarian81 0.3% Iranian64 0.3% French50 0.2% Swedish47 0.2% Eastern European42 0.2% Egyptian42 0.2% Palestinian42 0.2% Latvian41 0.2% Scotch-Irish37 0.2% Syrian36 0.1% Iraqi34 0.1% Nigerian29 0.1% Serbian29 0.1% Slavic29 0.1% Slovak28 0.1% Luxembourger26 0.1% Moroccan26 0.1% Israeli23 0.09% Turkish19 0.08% Portuguese18 0.07% Lebanese18 0.07% Austrian17 0.07% Danish17 0.07% Norwegian17 0.07% Croatian16 0.07% Armenian15 0.06% Dutch15 0.06% Scottish11 0.05% Finnish10 0.04% Jordanian10 0.04% Northern European10 0.04% South African10 0.04% Yugoslavian6 0.02% Czechoslovakian6 0.02% British4 0.02% Hungarian4 0.02% Czech
Geographical mobility in Wheeling Same house 1 year ago 16,011 88.4% White (Caucasian)417 78.4% Black or African American900 91.1% American Indian / Alaska Native5,229 80.2% Asian8,470 91.6% Other race2,601 90.6% Two or more races15,728 88.0% White alone, not Hispanic / Latino11,127 90.9% Hispanic or LatinoMoved within same county 1,317 7.3% White / Caucasian100 18.7% Black or African American787 12.1% Asian507 5.5% Other race64 2.2% Two or more races1,345 7.5% White alone, not Hispanic / Latino675 5.5% Hispanic or LatinoMoved within same state 210 1.2% White / Caucasian15 1.6% American Indian / Alaska Native158 2.4% Asian374 4.0% Other race114 4.0% Two or more races209 1.2% White alone, not Hispanic / Latino357 2.9% Hispanic or LatinoMoved from different state 239 1.3% White / Caucasian90 9.1% American Indian / Alaska Native98 1.5% Asian30 1.1% Two or more races233 1.3% White alone, not Hispanic / Latino68 0.6% Hispanic or LatinoMoved from abroad 306 1.7% White244 3.7% Asian16 0.6% Two or more races334 1.9% White alone, not Hispanic / Latino11 0.1% Hispanic or Latino
Children Nativity (place of birth) in Wheeling
Children under 6 years - Living with two parents Both parents native 370 100.0% NativeBoth parents foreign-born 989 92.7% Native78 7.3% Foreign-bornOne native, one foreign-born parent 453 100.0% NativeChildren under 6 years - Living with one parent Native parent 241 100.0% NativeForeign-born parent 105 100.0% NativeChildren 6 to 17 years - Living with two parents Both parents native 587 100.0% NativeBoth parents foreign-born 2,018 88.8% Native254 11.2% Foreign-bornOne native, one foreign-born parent 326 98.0% Native7 2.0% Foreign-bornChildren 6 to 17 years - Living with one parent Native parent 233 100.0% NativeForeign-born parent 737 51.9% Native683 48.1% Foreign-born
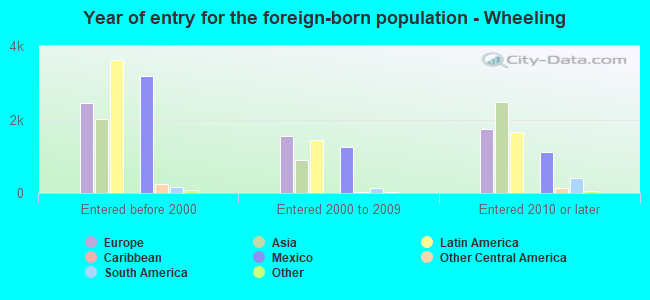
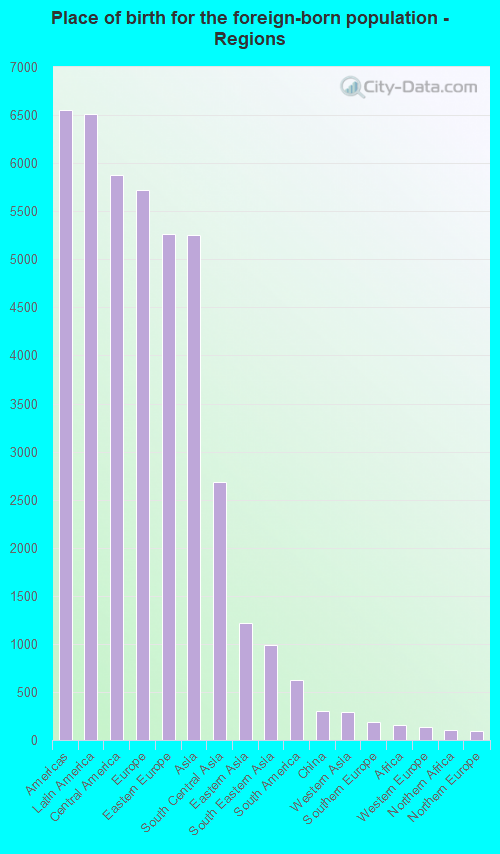
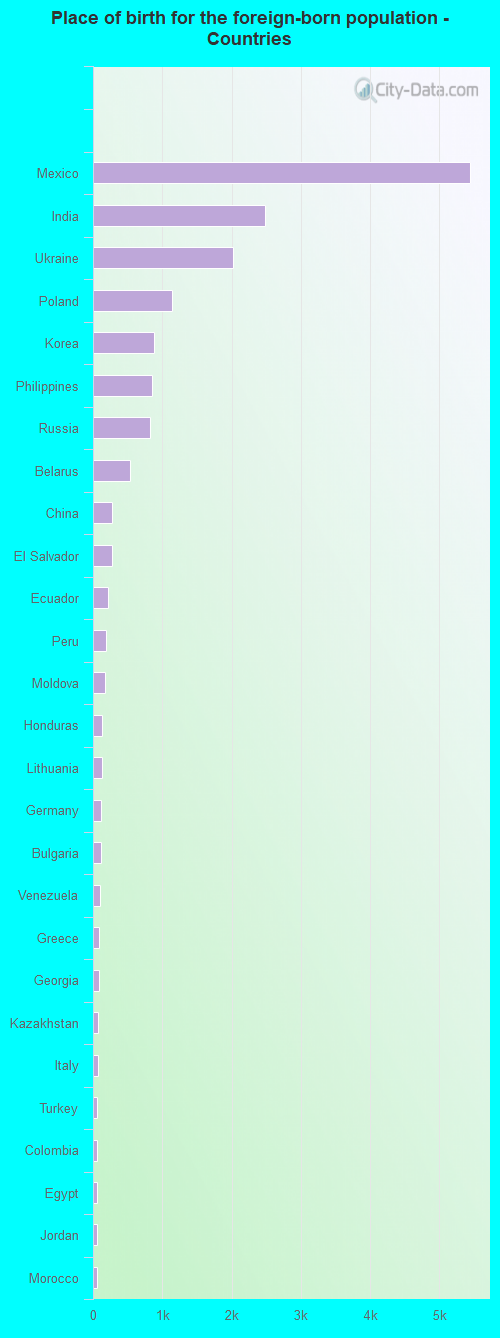
Place of birth for residents in Wheeling 6,554 Americas6,507 Latin America5,879 Central America5,719 Europe5,261 Eastern Europe5,248 Asia2,688 South Central Asia1,217 Eastern Asia993 South Eastern Asia621 South America301 China289 Western Asia191 Southern Europe160 Africa136 Western Europe106 Northern Africa94 Northern Europe46 Northern America34 Western Africa18 Southern Africa6 Caribbean5,444 Mexico2,481 India2,027 Ukraine1,145 Poland885 Korea857 Philippines822 Russia534 Belarus273 China271 El Salvador216 Ecuador189 Peru170 Moldova137 Honduras130 Lithuania115 Germany112 Bulgaria106 Venezuela91 Greece80 Georgia78 Kazakhstan75 Italy64 Turkey59 Colombia54 Egypt51 Jordan51 Morocco46 Canada46 Singapore40 Romania40 Iran39 Iraq38 Uzbekistan36 Pakistan34 Nigeria33 United Kingdom33 Latvia30 Japan26 England25 Thailand25 Vietnam25 Ireland24 Portugal24 Cambodia20 France20 Brazil18 South Africa15 Bolivia14 Guatemala14 Hong Kong12 Azerbaijan12 Nepal12 Taiwan11 Burma (Myanmar)11 Costa Rica11 Argentina10 Saudi Arabia9 Lebanon6 Czechoslovakia6 Cuba6 Kuwait5 Bosnia and Herzegovina5 Israel5 United Arab Emirates
Grandparents responsible for own grandchildren in Wheeling
Grandparents (30 to 59 years) White / Caucasian 18 20.8% Responsible for grandchildren68 79.2% Not responsible for grandchildrenAmerican Indian / Alaska Native 7 100.0% Not responsible for grandchildrenAsian 28 100.0% Not responsible for grandchildrenOther race 358 100.0% Not responsible for grandchildrenTwo or more races 48 100.0% Responsible for grandchildrenWhite alone, not Hispanic / Latino 40 100.0% Not responsible for grandchildrenHispanic or Latino 71 17.9% Responsible for grandchildren326 82.1% Not responsible for grandchildren
Grandparents (60 years and over) White / Caucasian 96 100.0% Not responsible for grandchildrenAsian 9 2.8% Responsible for grandchildren323 97.2% Not responsible for grandchildrenOther race 38 100.0% Not responsible for grandchildrenTwo or more races 72 100.0% Not responsible for grandchildrenWhite alone, not Hispanic / Latino 124 100.0% Not responsible for grandchildrenHispanic or Latino 84 100.0% Not responsible for grandchildren