Races in Wheeling, West Virginia (WV) Detailed Stats
Data:
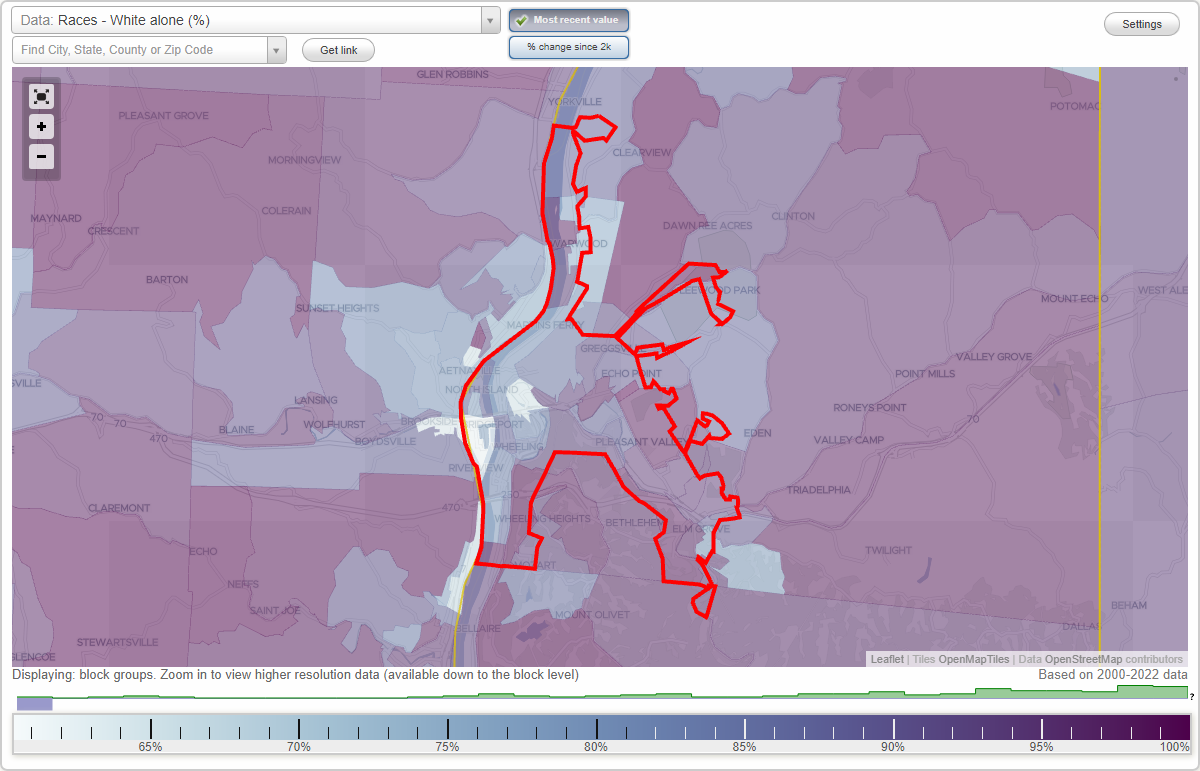
Races - White alone (%)
Races - White alone (% change since 2000)
Races - Black alone (%)
Races - Black alone (% change since 2000)
Races - American Indian alone (%)
Races - American Indian alone (% change since 2000)
Races - Asian alone (%)
Races - Asian alone (% change since 2000)
Races - Hispanic (%)
Races - Hispanic (% change since 2000)
Races - Native Hawaiian and Other Pacific Islander alone (%)
Races - Native Hawaiian and Other Pacific Islander alone (% change since 2000)
Races - Two or more races(%)
Races - Two or more races(% change since 2000)
Races - Other race alone (%)
Races - Other race alone (% change since 2000)
Racial diversity
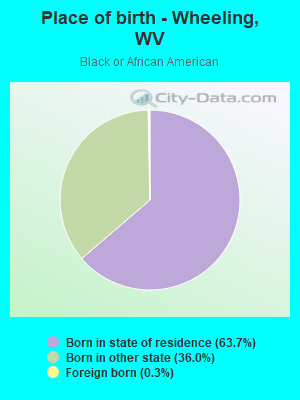
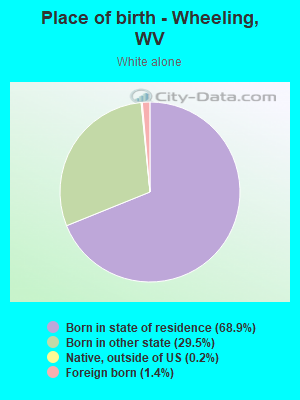
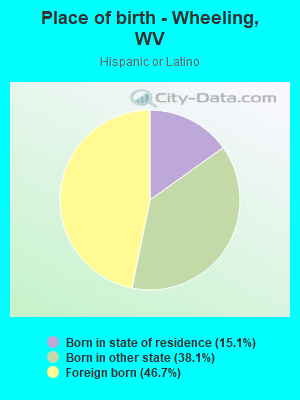
Place of birth - Born in state of residence (%)
Place of birth - Born in state of residence (%) - White
Place of birth - Born in state of residence (%) - Black or African American
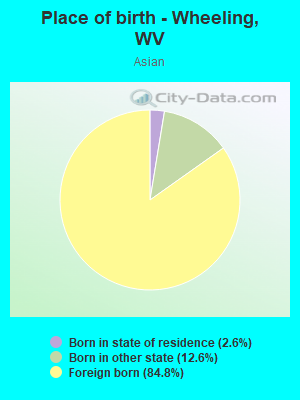
Place of birth - Born in state of residence (%) - Asian
Place of birth - Born in state of residence (%) - Hispanic or Latino
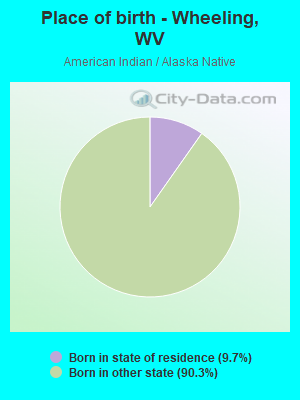
Place of birth - Born in state of residence (%) - American Indian and Alaska Native
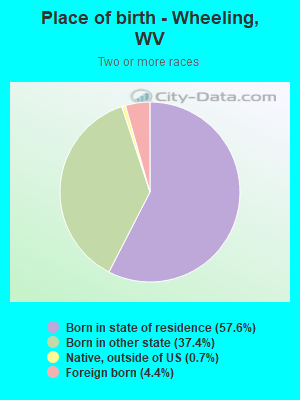
Place of birth - Born in state of residence (%) - Multirace
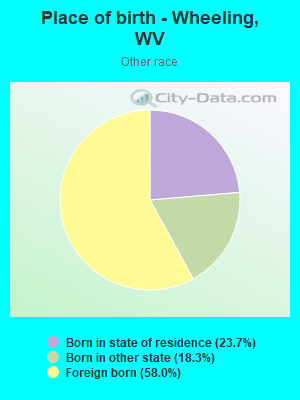
Place of birth - Born in state of residence (%) - Other Race
Place of birth - Born in other state (%)
Place of birth - Born in other state (%) - White
Place of birth - Born in other state (%) - Black or African American
Place of birth - Born in other state (%) - Asian
Place of birth - Born in other state (%) - Hispanic or Latino
Place of birth - Born in other state (%) - American Indian and Alaska Native
Place of birth - Born in other state (%) - Multirace
Place of birth - Born in other state (%) - Other Race
Place of birth - Native, outside of US (%)
Place of birth - Native, outside of US (%) - White
Place of birth - Native, outside of US (%) - Black or African American
Place of birth - Native, outside of US (%) - Asian
Place of birth - Native, outside of US (%) - Hispanic or Latino
Place of birth - Native, outside of US (%) - American Indian and Alaska Native
Place of birth - Native, outside of US (%) - Multirace
Place of birth - Native, outside of US (%) - Other Race
Place of birth - Foreign born (%)
Place of birth - Foreign born (%) - White
Place of birth - Foreign born (%) - Black or African American
Place of birth - Foreign born (%) - Asian
Place of birth - Foreign born (%) - Hispanic or Latino
Place of birth - Foreign born (%) - American Indian and Alaska Native
Place of birth - Foreign born (%) - Multirace
Place of birth - Foreign born (%) - Other Race
Residents speaking English at home (%)
Residents speaking English at home - Born in the United States (%)
Residents speaking English at home - Native, born elsewhere (%)
Residents speaking English at home - Foreign born (%)
Residents speaking Spanish at home (%)
Residents speaking Spanish at home - Born in the United States (%)
Residents speaking Spanish at home - Native, born elsewhere (%)
Residents speaking Spanish at home - Foreign born (%)
Residents speaking other language at home (%)
Residents speaking other language at home - Born in the United States (%)
Residents speaking other language at home - Native, born elsewhere (%)
Residents speaking other language at home - Foreign born (%)
Marital status - Never married (%)
Marital status - Now married (%)
Marital status - Separated (%)
Marital status - Widowed (%)
Marital status - Divorced (%)
Ancestries Reported - Arab (%)
Ancestries Reported - Czech (%)
Ancestries Reported - Danish (%)
Ancestries Reported - Dutch (%)
Ancestries Reported - English (%)
Ancestries Reported - French (%)
Ancestries Reported - French Canadian (%)
Ancestries Reported - German (%)
Ancestries Reported - Greek (%)
Ancestries Reported - Hungarian (%)
Ancestries Reported - Irish (%)
Ancestries Reported - Italian (%)
Ancestries Reported - Lithuanian (%)
Ancestries Reported - Norwegian (%)
Ancestries Reported - Polish (%)
Ancestries Reported - Portuguese (%)
Ancestries Reported - Russian (%)
Ancestries Reported - Scotch-Irish (%)
Ancestries Reported - Scottish (%)
Ancestries Reported - Slovak (%)
Ancestries Reported - Subsaharan African (%)
Ancestries Reported - Swedish (%)
Ancestries Reported - Swiss (%)
Ancestries Reported - Ukrainian (%)
Ancestries Reported - United States (%)
Ancestries Reported - Welsh (%)
Ancestries Reported - West Indian (%)
Ancestries Reported - Other (%)
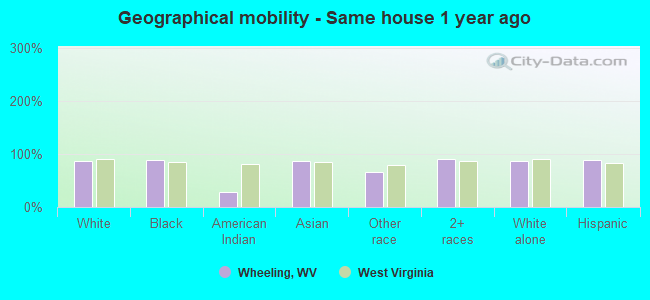
Geographical mobility - Same house 1 year ago (%)
Geographical mobility - Same house 1 year ago (%) - White
Geographical mobility - Same house 1 year ago (%) - Black or African American
Geographical mobility - Same house 1 year ago (%) - Asian
Geographical mobility - Same house 1 year ago (%) - Hispanic or Latino
Geographical mobility - Same house 1 year ago (%) - American Indian and Alaska Native
Geographical mobility - Same house 1 year ago (%) - Multirace
Geographical mobility - Same house 1 year ago (%) - Other Race
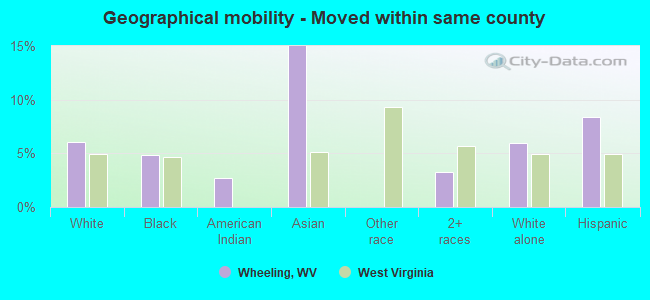
Geographical mobility - Moved within same county (%)
Geographical mobility - Moved within same county (%) - White
Geographical mobility - Moved within same county (%) - Black or African American
Geographical mobility - Moved within same county (%) - Asian
Geographical mobility - Moved within same county (%) - Hispanic or Latino
Geographical mobility - Moved within same county (%) - American Indian and Alaska Native
Geographical mobility - Moved within same county (%) - Multirace
Geographical mobility - Moved within same county (%) - Other Race
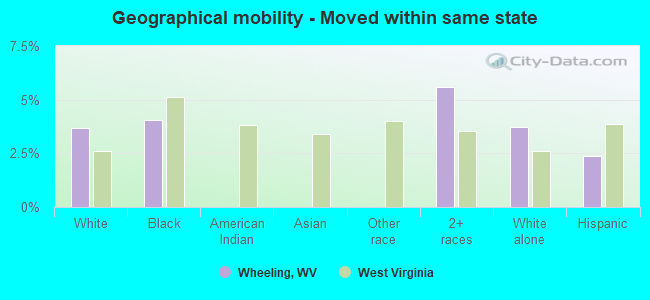
Geographical mobility - Moved from different county within same state (%)
Geographical mobility - Moved from different county within same state (%) - White
Geographical mobility - Moved from different county within same state (%) - Black or African American
Geographical mobility - Moved from different county within same state (%) - Asian
Geographical mobility - Moved from different county within same state (%) - Hispanic or Latino
Geographical mobility - Moved from different county within same state (%) - American Indian and Alaska Native
Geographical mobility - Moved from different county within same state (%) - Multirace
Geographical mobility - Moved from different county within same state (%) - Other Race
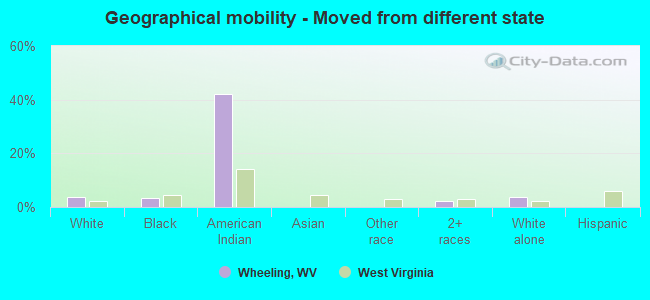
Geographical mobility - Moved from different state (%)
Geographical mobility - Moved from different state (%) - White
Geographical mobility - Moved from different state (%) - Black or African American
Geographical mobility - Moved from different state (%) - Asian
Geographical mobility - Moved from different state (%) - Hispanic or Latino
Geographical mobility - Moved from different state (%) - American Indian and Alaska Native
Geographical mobility - Moved from different state (%) - Multirace
Geographical mobility - Moved from different state (%) - Other Race
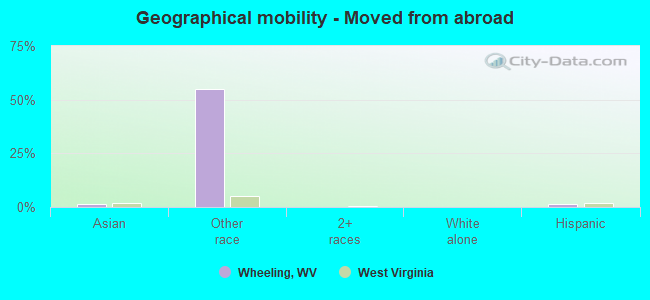
Geographical mobility - Moved from abroad (%)
Geographical mobility - Moved from abroad (%) - White
Geographical mobility - Moved from abroad (%) - Black or African American
Geographical mobility - Moved from abroad (%) - Asian
Geographical mobility - Moved from abroad (%) - Hispanic or Latino
Geographical mobility - Moved from abroad (%) - American Indian and Alaska Native
Geographical mobility - Moved from abroad (%) - Multirace
Geographical mobility - Moved from abroad (%) - Other Race
Place of birth for the foreign-born population - Ireland (%)
Place of birth for the foreign-born population - Denmark (%)
Place of birth for the foreign-born population - Norway (%)
Place of birth for the foreign-born population - Sweden (%)
Place of birth for the foreign-born population - United Kingdom (%)
Place of birth for the foreign-born population - England (%)
Place of birth for the foreign-born population - Scotland (%)
Place of birth for the foreign-born population - Other Northern Europe (%)
Place of birth for the foreign-born population - Austria (%)
Place of birth for the foreign-born population - Belgium (%)
Place of birth for the foreign-born population - France (%)
Place of birth for the foreign-born population - Germany (%)
Place of birth for the foreign-born population - Netherlands (%)
Place of birth for the foreign-born population - Switzerland (%)
Place of birth for the foreign-born population - Other Western Europe (%)
Place of birth for the foreign-born population - Greece (%)
Place of birth for the foreign-born population - Italy (%)
Place of birth for the foreign-born population - Portugal (%)
Place of birth for the foreign-born population - Spain (%)
Place of birth for the foreign-born population - Other Southern Europe (%)
Place of birth for the foreign-born population - Albania (%)
Place of birth for the foreign-born population - Belarus (%)
Place of birth for the foreign-born population - Bosnia and Herzegovina (%)
Place of birth for the foreign-born population - Bulgaria (%)
Place of birth for the foreign-born population - Croatia (%)
Place of birth for the foreign-born population - Czechoslovakia (%)
Place of birth for the foreign-born population - Hungary (%)
Place of birth for the foreign-born population - Latvia (%)
Place of birth for the foreign-born population - Lithuania (%)
Place of birth for the foreign-born population - North Macedonia (Macedonia) (%)
Place of birth for the foreign-born population - Moldova (%)
Place of birth for the foreign-born population - Poland (%)
Place of birth for the foreign-born population - Romania (%)
Place of birth for the foreign-born population - Russia (%)
Place of birth for the foreign-born population - Serbia (%)
Place of birth for the foreign-born population - Ukraine (%)
Place of birth for the foreign-born population - Other Eastern Europe (%)
Place of birth for the foreign-born population - China (%)
Place of birth for the foreign-born population - Hong Kong (%)
Place of birth for the foreign-born population - Taiwan (%)
Place of birth for the foreign-born population - Japan (%)
Place of birth for the foreign-born population - Korea (%)
Place of birth for the foreign-born population - Other Eastern Asia (%)
Place of birth for the foreign-born population - Afghanistan (%)
Place of birth for the foreign-born population - Bangladesh (%)
Place of birth for the foreign-born population - India (%)
Place of birth for the foreign-born population - Iran (%)
Place of birth for the foreign-born population - Kazakhstan (%)
Place of birth for the foreign-born population - Nepal (%)
Place of birth for the foreign-born population - Pakistan (%)
Place of birth for the foreign-born population - Sri Lanka (%)
Place of birth for the foreign-born population - Uzbekistan (%)
Place of birth for the foreign-born population - Other South Central Asia (%)
Place of birth for the foreign-born population - Burma (%)
Place of birth for the foreign-born population - Cambodia (%)
Place of birth for the foreign-born population - Indonesia (%)
Place of birth for the foreign-born population - Laos (%)
Place of birth for the foreign-born population - Malaysia (%)
Place of birth for the foreign-born population - Philippines (%)
Place of birth for the foreign-born population - Singapore (%)
Place of birth for the foreign-born population - Thailand (%)
Place of birth for the foreign-born population - Vietnam (%)
Place of birth for the foreign-born population - Other South Eastern Asia (%)
Place of birth for the foreign-born population - Armenia (%)
Place of birth for the foreign-born population - Iraq (%)
Place of birth for the foreign-born population - Israel (%)
Place of birth for the foreign-born population - Jordan (%)
Place of birth for the foreign-born population - Kuwait (%)
Place of birth for the foreign-born population - Lebanon (%)
Place of birth for the foreign-born population - Saudi Arabia (%)
Place of birth for the foreign-born population - Syria (%)
Place of birth for the foreign-born population - Turkey (%)
Place of birth for the foreign-born population - Yemen (%)
Place of birth for the foreign-born population - Other Western Asia (%)
Place of birth for the foreign-born population - Eritrea (%)
Place of birth for the foreign-born population - Ethiopia (%)
Place of birth for the foreign-born population - Kenya (%)
Place of birth for the foreign-born population - Somalia (%)
Place of birth for the foreign-born population - Uganda (%)
Place of birth for the foreign-born population - Zimbabwe (%)
Place of birth for the foreign-born population - Other Eastern Africa (%)
Place of birth for the foreign-born population - Cameroon (%)
Place of birth for the foreign-born population - Congo (%)
Place of birth for the foreign-born population - Democratic Republic of Congo (Zaire) (%)
Place of birth for the foreign-born population - Other Middle Africa (%)
Place of birth for the foreign-born population - Egypt (%)
Place of birth for the foreign-born population - Morocco (%)
Place of birth for the foreign-born population - Sudan (%)
Place of birth for the foreign-born population - Other Northern Africa (%)
Place of birth for the foreign-born population - South Africa (%)
Place of birth for the foreign-born population - Other Southern Africa (%)
Place of birth for the foreign-born population - Cabo Verde (%)
Place of birth for the foreign-born population - Ghana (%)
Place of birth for the foreign-born population - Liberia (%)
Place of birth for the foreign-born population - Nigeria (%)
Place of birth for the foreign-born population - Senegal (%)
Place of birth for the foreign-born population - Sierra Leone (%)
Place of birth for the foreign-born population - Other Western Africa (%)
Place of birth for the foreign-born population - Australia (%)
Place of birth for the foreign-born population - New Zealand (%)
Place of birth for the foreign-born population - Fiji (%)
Place of birth for the foreign-born population - Micronesia (%)
Place of birth for the foreign-born population - Bahamas (%)
Place of birth for the foreign-born population - Barbados (%)
Place of birth for the foreign-born population - Cuba (%)
Place of birth for the foreign-born population - Dominica (%)
Place of birth for the foreign-born population - Dominican Republic (%)
Place of birth for the foreign-born population - Grenada (%)
Place of birth for the foreign-born population - Haiti (%)
Place of birth for the foreign-born population - Jamaica (%)
Place of birth for the foreign-born population - St. Vincent and the Grenadines (%)
Place of birth for the foreign-born population - Trinidad and Tobago (%)
Place of birth for the foreign-born population - West Indies (%)
Place of birth for the foreign-born population - Other Caribbean (%)
Place of birth for the foreign-born population - Belize (%)
Place of birth for the foreign-born population - Costa Rica (%)
Place of birth for the foreign-born population - El Salvador (%)
Place of birth for the foreign-born population - Guatemala (%)
Place of birth for the foreign-born population - Honduras (%)
Place of birth for the foreign-born population - Mexico (%)
Place of birth for the foreign-born population - Nicaragua (%)
Place of birth for the foreign-born population - Panama (%)
Place of birth for the foreign-born population - Other Central America (%)
Place of birth for the foreign-born population - Argentina (%)
Place of birth for the foreign-born population - Bolivia (%)
Place of birth for the foreign-born population - Brazil (%)
Place of birth for the foreign-born population - Chile (%)
Place of birth for the foreign-born population - Colombia (%)
Place of birth for the foreign-born population - Ecuador (%)
Place of birth for the foreign-born population - Guyana (%)
Place of birth for the foreign-born population - Peru (%)
Place of birth for the foreign-born population - Uruguay (%)
Place of birth for the foreign-born population - Venezuela (%)
Place of birth for the foreign-born population - Other South America (%)
Place of birth for the foreign-born population - Canada (%)
Place of birth for the foreign-born population - Other Northern America (%)
Place of birth for the foreign-born population - Other (%)
Latest news about races in Wheeling, WV collected exclusively by city-data.com from local newspapers, TV, and radio stations
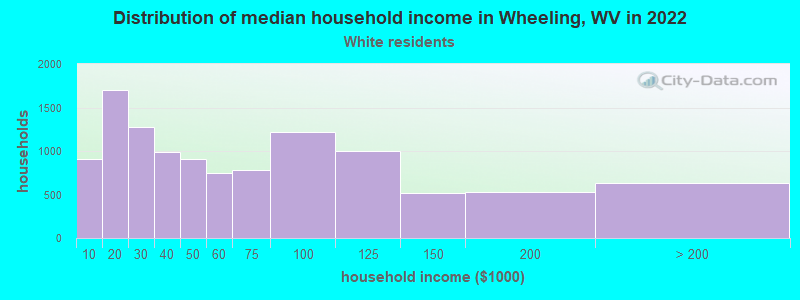
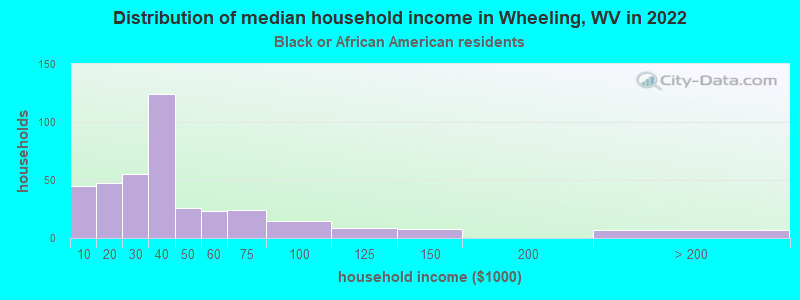
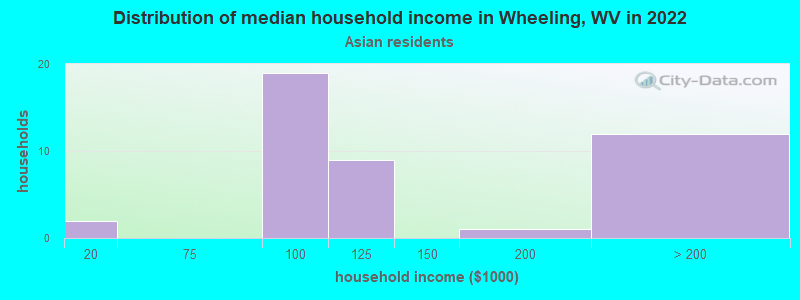
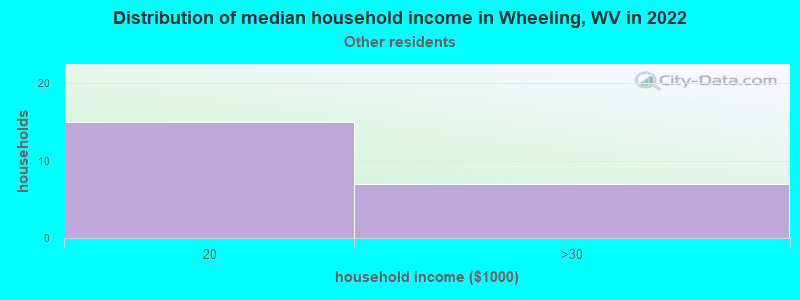
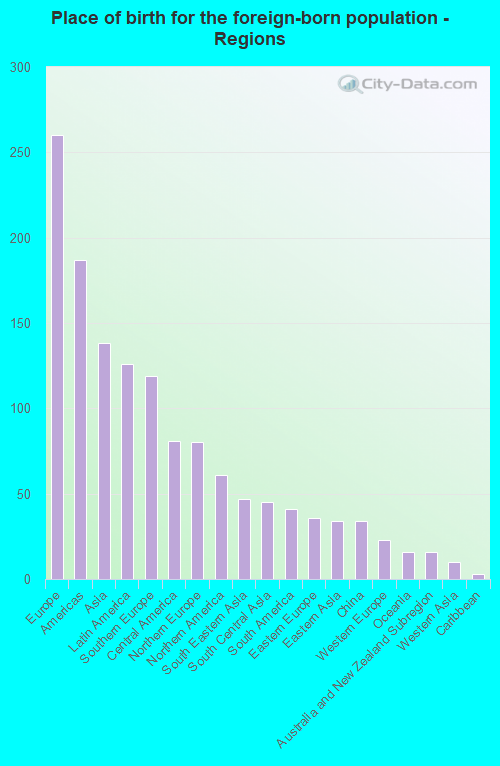
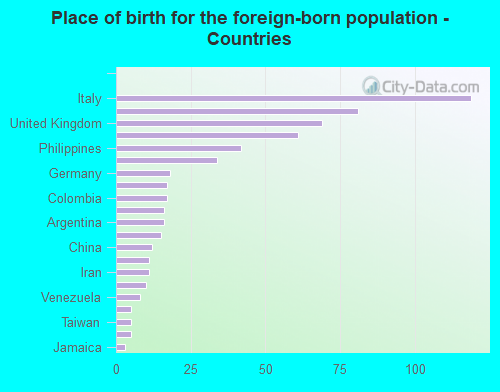
According to 2022 data, the most numerous races in Wheeling, WV are White alone (23,683 residents), Two or more races (1,292 residents), and Black alone (1,143 residents). 97.3% of Wheeling residents speak English at home. 2.3% of Wheeling, WV residents are foreign-born (0.9% born in Europe, 0.5% born in Asia, 0.5% born in Latin America), which is 55.8% greater than the foreign-born rate of 1.0% across the entire state of West Virginia.
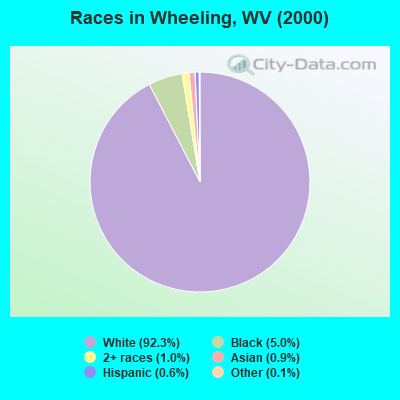
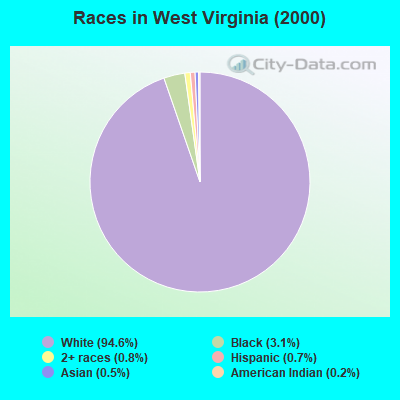
Race distribution in Wheeling
2000 2022
1,709,966 94.6% White alone 56,825 3.1% Black alone 14,983 0.8% Two or more races 12,279 0.7% Hispanic 9,356 0.5% Asian alone 3,456 0.2% American Indian alone 1,144 0.06% Other race alone 335 0.02% Native Hawaiian and Other
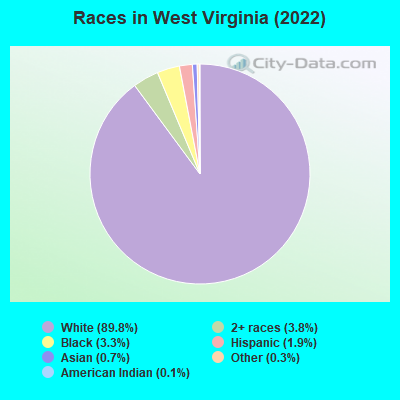
1,594,128 89.8% White alone 66,932 3.8% Two or more races 59,390 3.3% Black alone 34,343 1.9% Hispanic 13,134 0.7% Asian alone 5,238 0.3% Other race alone 1,880 0.1% American Indian alone 111 0.01% Native Hawaiian and Other
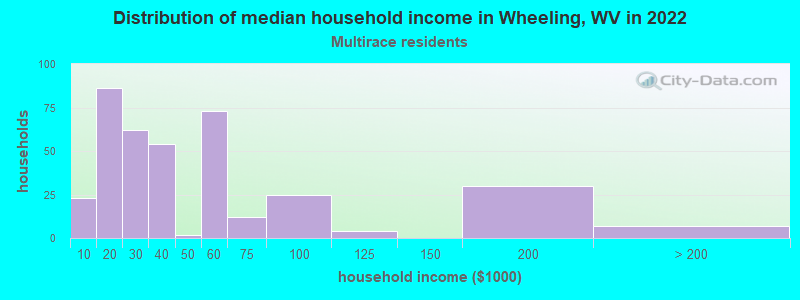
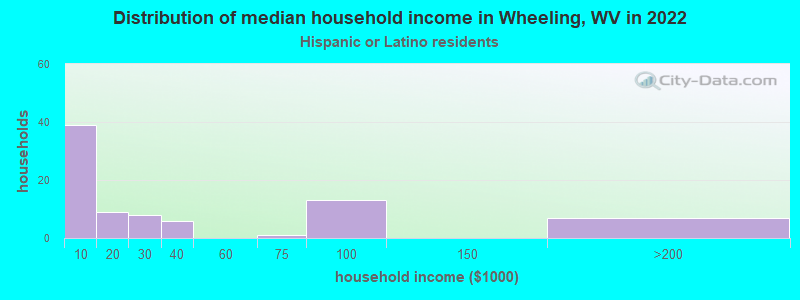
Income and house value in Wheeling Median household income in 2022 $47,083 White non-Hispanic householders$27,863 Black householders$34,694 Two or more races householdersMedian 2022 house value $140,410 White Non-Hispanic householders$73,429 Black or African American householders$197,614 American Indian or Alaska Native householders $308,070 Asian householders$156,011 Two or more races householders$276,660 Hispanic or Latino householders
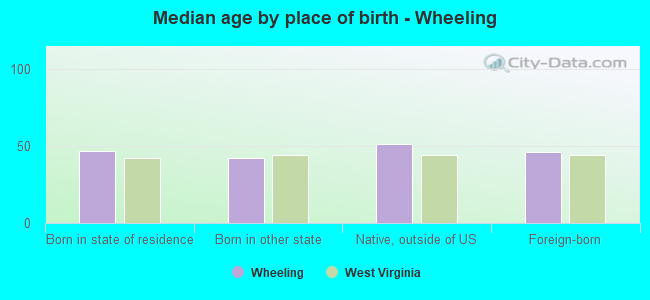
Median age by race in Wheeling
47.0 Median age for White residents44.8 48.9 32.7 Median age for Black or African American residents39.4 23.1 14.6 Median age for American Indian / Alaska Native residents10.3 33.1 45.4 Median age for Asian residents65.3 48.4 -827,078,733.5 Median age for Native Hawaiian / Pacific Islander residents-668,724,279.2 -670,599,802.7 41.7 Median age for Other race residents-764,285,713.5 39.5 25.5 Median age for Two or more races residents23.8 31.0 47.0 Median age for White alone residents45.1 48.9 24.6 Median age for Hispanic or Latino residents25.3 41.9
Owner/renter occupied households by race in Wheeling
House owners and renters - White residents 7,075 63.4% Owner occupied4,088 36.6% Renter occupiedHouse owners and renters - Black or African American residents 101 27.1% Owner occupied272 72.9% Renter occupiedHouse owners and renters - American Indian / Alaska Native residents 12 100.0% Renter occupiedHouse owners and renters - Asian residents 36 73.5% Owner occupied13 26.5% Renter occupiedHouse owners and renters - Other race residents 15 71.4% Owner occupied6 28.6% Renter occupiedHouse owners and renters - Two or more races residents 98 23.5% Owner occupied318 76.5% Renter occupiedHouse owners and renters - White alone residents 7,080 63.6% Owner occupied4,052 36.4% Renter occupiedHouse owners and renters - Hispanic or Latino residents 39 46.6% Owner occupied45 53.4% Renter occupied
Language usage in Wheeling
English speakers - Total 97.3% of residents of Wheeling speak English at home.
1.1% of residents speak Spanish at home 172 64.7% Speak English very well94 35.3% Speak English less than very well1.6% of residents speak other language at home 249 60.1% Speak English very well165 39.9% Speak English less than very well
English speakers - Born in the United States 98.4% of residents of Wheeling speak English at home.
0.8% of residents speak Spanish at home 60 100.0% Speak English very well0.8% of residents speak other language at home 52 88.1% Speak English very well7 11.9% Speak English less than very well
English speakers - Native, born elsewhere 98.4% of residents of Wheeling speak English at home.
English speakers - Foreign-born 47.0% of residents of Wheeling speak English at home.
14.8% of residents speak Spanish at home 41 43.2% Speak English very well54 56.8% Speak English less than very well37.6% of residents speak other language at home 100 41.5% Speak English very well141 58.5% Speak English less than very well
White (Caucasian) - Speak only English Native:
98.8% (21,950)Foreign-born:
66.4% (237)
White (Caucasian) - Speak another language Native:
1.1% (242)Foreign-born:
37.4% (134)
Black or African American - Speak only English Native:
100.0% (1,026)Foreign-born:
88.1% (3)
Asian - Speak only English Native:
100.0% (17)Foreign-born:
33.4% (39)
Other race - Speak only English Native:
90.1% (39)Foreign-born:
21.1% (12)
Two or more races - Speak only English Native:
94.0% (1,250)Foreign-born:
6.0% (4)
Two or more races - Speak another language Native:
5.8% (77)Foreign-born:
100.0% (65)
White alone - Speak only English Native:
98.8% (21,924)Foreign-born:
62.3% (202)
White alone - Speak another language Native:
1.1% (245)Foreign-born:
36.8% (119)
Hispanic or Latino - Speak only English Native:
80.9% (133)Foreign-born:
21.6% (28)
Hispanic or Latino - Speak another language Native:
11.8% (19)Foreign-born:
72.2% (95)
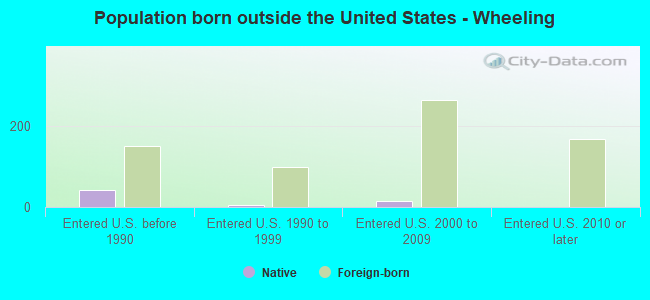
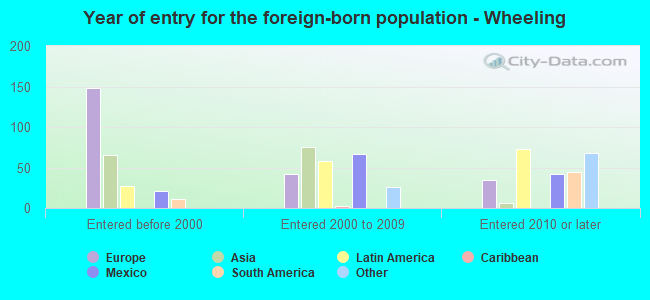
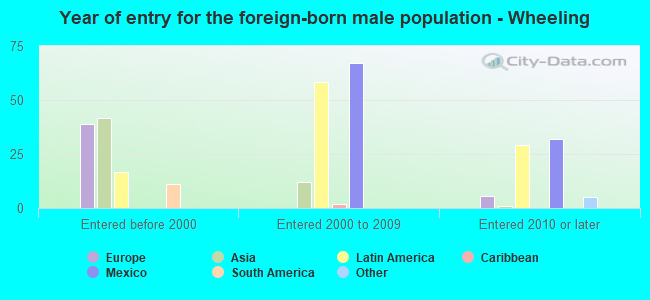
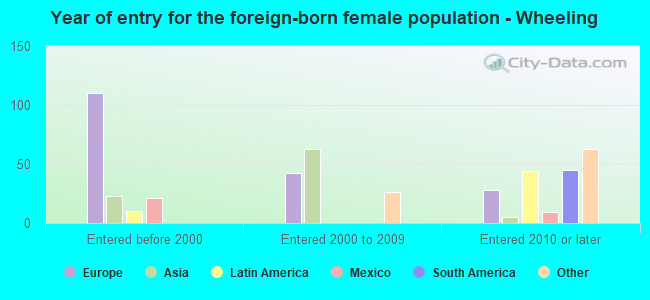
Foreign-born residents in Wheeling 602 residents are foreign born (0.9% Europe , 0.5% Asia , 0.5% Latin America ).
This city:
2.3%West Virginia:
1.6%
Marital status for residents in Wheeling Marital status - White (Caucasian) population 15 years and over
Males 38.3% Never married44.3% Now married1.1% Separated3.3% Widowed12.9% DivorcedFemales 30.7% Never married36.2% Now married2.4% Separated15.1% Widowed15.6% DivorcedWomen who gave birth in the past 12 months Now married:
65.7% (126)Unmarried:
34.3% (66)
Women who did not give birth in the past 12 months Now married:
34.6% (1,556)Unmarried:
65.4% (2,947)
Marital status - Black or African American population 15 years and over
Males 50.6% Never married28.0% Now married6.6% Separated0.6% Widowed14.2% DivorcedFemales 60.1% Never married17.9% Now married0.3% Separated12.8% Widowed8.9% DivorcedWomen who gave birth in the past 12 months Now married:
0.0% (0)Unmarried:
100.0% (5)
Women who did not give birth in the past 12 months Now married:
0.6% (1)Unmarried:
99.4% (183)
Marital status - American Indian / Alaska Native population 15 years and over
Males 0.0% Never married0.0% Now married100.0% Separated0.0% Widowed0.0% DivorcedFemales 63.6% Never married27.3% Now married0.0% Separated9.1% Widowed0.0% DivorcedWomen who did not give birth in the past 12 months Now married:
0.0% (0)Unmarried:
100.0% (17)
Marital status - Asian population 15 years and over
Males 14.3% Never married85.7% Now married0.0% Separated0.0% Widowed0.0% DivorcedFemales 6.6% Never married93.4% Now married0.0% Separated0.0% Widowed0.0% DivorcedWomen who did not give birth in the past 12 months Now married:
90.7% (49)Unmarried:
9.3% (5)
Marital status - Other race population 15 years and over
Males 76.9% Never married23.1% Now married0.0% Separated0.0% Widowed0.0% DivorcedFemales 33.8% Never married47.9% Now married0.0% Separated18.3% Widowed0.0% DivorcedWomen who did not give birth in the past 12 months Now married:
58.6% (34)Unmarried:
41.4% (24)
Marital status - Two or more races population 15 years and over
Males 70.5% Never married16.9% Now married0.0% Separated0.0% Widowed12.6% DivorcedFemales 53.5% Never married29.4% Now married0.0% Separated9.9% Widowed7.2% DivorcedWomen who gave birth in the past 12 months Now married:
0.0% (0)Unmarried:
100.0% (29)
Women who did not give birth in the past 12 months Now married:
29.1% (113)Unmarried:
70.9% (276)
Marital status - White alone, not Hispanic / Latino population 15 years and over
Males 38.4% Never married44.6% Now married0.8% Separated3.3% Widowed12.9% DivorcedFemales 30.7% Never married36.2% Now married2.4% Separated15.2% Widowed15.6% DivorcedWomen who gave birth in the past 12 months Now married:
65.7% (127)Unmarried:
34.3% (66)
Women who did not give birth in the past 12 months Now married:
34.5% (1,554)Unmarried:
65.5% (2,948)
Marital status - Hispanic or Latino population 15 years and over
Males 41.5% Never married25.9% Now married24.4% Separated0.0% Widowed8.1% DivorcedFemales 22.2% Never married65.7% Now married0.0% Separated12.0% Widowed0.0% DivorcedWomen who did not give birth in the past 12 months Now married:
68.4% (51)Unmarried:
31.6% (24)
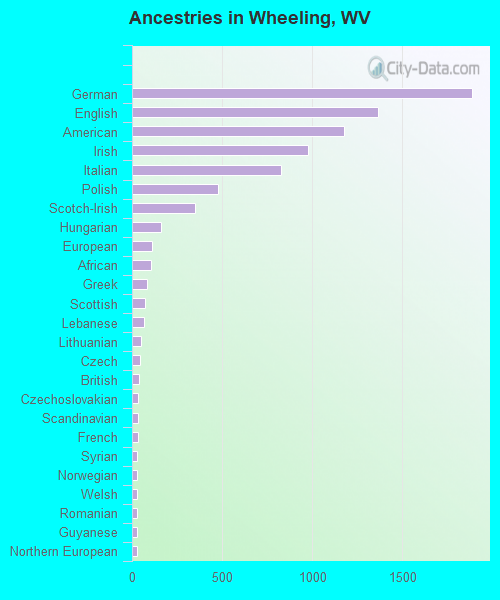
Ancestries in Wheeling
1,887 19.5% German1,363 14.1% English1,177 12.2% American975 10.1% Irish829 8.6% Italian477 4.9% Polish352 3.6% Scotch-Irish161 1.7% Hungarian113 1.2% European106 1.1% African81 0.8% Greek74 0.8% Scottish67 0.7% Lebanese50 0.5% Lithuanian42 0.4% Czech41 0.4% British36 0.4% Czechoslovakian35 0.4% Scandinavian34 0.4% French29 0.3% Syrian29 0.3% Norwegian28 0.3% Welsh27 0.3% Romanian25 0.3% Guyanese25 0.3% Northern European21 0.2% Croatian20 0.2% Slovak16 0.2% French Canadian15 0.2% Basque12 0.1% Dutch12 0.1% Eastern European11 0.1% Ukrainian11 0.1% Iranian8 0.08% Slovene7 0.07% Russian6 0.06% Austrian5 0.05% Haitian3 0.03% Serbian3 0.03% Jamaican1 0.01% Canadian
Geographical mobility in Wheeling Same house 1 year ago 20,268 86.4% White (Caucasian)985 88.3% Black or African American21 28.1% American Indian / Alaska Native118 86.5% Asian63 65.7% Other race1,335 89.7% Two or more races20,210 86.4% White alone, not Hispanic / Latino254 87.8% Hispanic or LatinoMoved within same county 1,420 6.1% White / Caucasian54 4.8% Black or African American2 2.7% American Indian / Alaska Native20 15.0% Asian49 3.3% Two or more races1,400 6.0% White alone, not Hispanic / Latino24 8.4% Hispanic or LatinoMoved within same state 868 3.7% White / Caucasian45 4.1% Black or African American83 5.6% Two or more races870 3.7% White alone, not Hispanic / Latino7 2.4% Hispanic or LatinoMoved from different state 840 3.6% White / Caucasian38 3.4% Black or African American31 42.1% American Indian / Alaska Native32 2.1% Two or more races863 3.7% White alone, not Hispanic / LatinoMoved from abroad 28 0.1% White2 1.2% Asian53 54.8% Other race3 0.2% Two or more races27 0.1% White alone, not Hispanic / Latino4 1.4% Hispanic or Latino
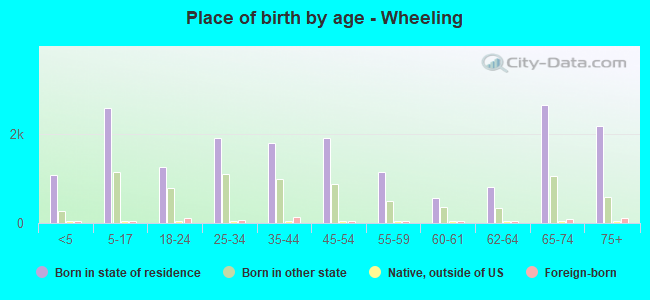
Children Nativity (place of birth) in Wheeling
Children under 6 years - Living with two parents Both parents native 880 100.0% NativeBoth parents foreign-born 5 100.0% NativeChildren under 6 years - Living with one parent Native parent 560 100.0% NativeChildren 6 to 17 years - Living with two parents Both parents native 1,702 100.0% NativeBoth parents foreign-born 4 100.0% NativeOne native, one foreign-born parent 90 100.0% NativeChildren 6 to 17 years - Living with one parent Native parent 1,568 100.0% NativeForeign-born parent 17 48.9% Native18 51.1% Foreign-born
Grandparents responsible for own grandchildren in Wheeling
Grandparents (30 to 59 years) White / Caucasian 25 35.3% Responsible for grandchildren45 64.7% Not responsible for grandchildrenBlack or African American 16 58.9% Responsible for grandchildren11 41.1% Not responsible for grandchildrenTwo or more races 7 28.5% Responsible for grandchildren18 71.5% Not responsible for grandchildrenWhite alone, not Hispanic / Latino 25 35.3% Responsible for grandchildren45 64.7% Not responsible for grandchildrenGrandparents (60 years and over) White / Caucasian 107 40.2% Responsible for grandchildren159 59.8% Not responsible for grandchildrenBlack or African American 1 1.9% Responsible for grandchildren46 98.1% Not responsible for grandchildrenTwo or more races 1 3.6% Responsible for grandchildren29 96.4% Not responsible for grandchildrenWhite alone, not Hispanic / Latino 106 39.9% Responsible for grandchildren160 60.1% Not responsible for grandchildren