Races in White Plains, New York (NY) Detailed Stats
Data:
Races - White alone (%)
Races - White alone (% change since 2000)
Races - Black alone (%)
Races - Black alone (% change since 2000)
Races - American Indian alone (%)
Races - American Indian alone (% change since 2000)
Races - Asian alone (%)
Races - Asian alone (% change since 2000)
Races - Hispanic (%)
Races - Hispanic (% change since 2000)
Races - Native Hawaiian and Other Pacific Islander alone (%)
Races - Native Hawaiian and Other Pacific Islander alone (% change since 2000)
Races - Two or more races(%)
Races - Two or more races(% change since 2000)
Races - Other race alone (%)
Races - Other race alone (% change since 2000)
Racial diversity
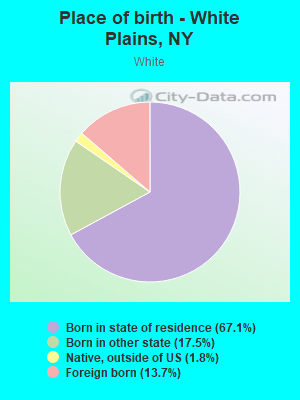
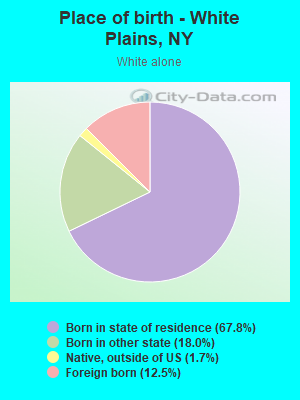
Place of birth - Born in state of residence (%)
Place of birth - Born in state of residence (%) - White
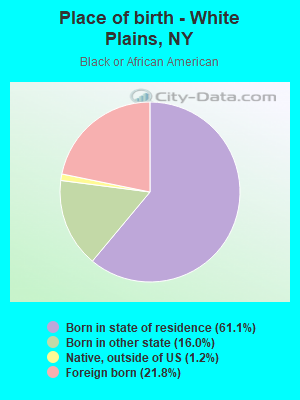
Place of birth - Born in state of residence (%) - Black or African American
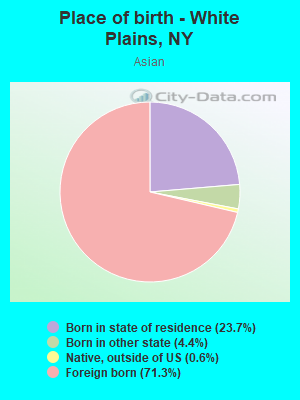
Place of birth - Born in state of residence (%) - Asian
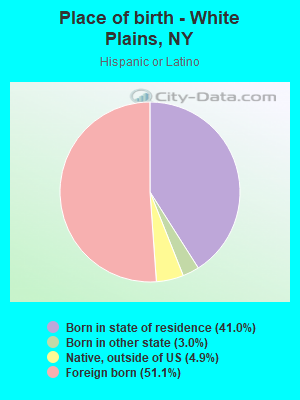
Place of birth - Born in state of residence (%) - Hispanic or Latino
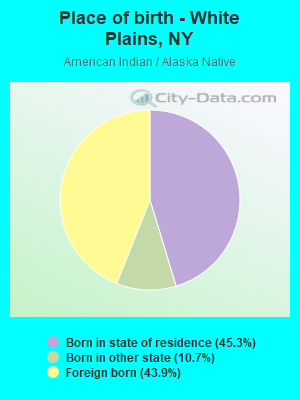
Place of birth - Born in state of residence (%) - American Indian and Alaska Native
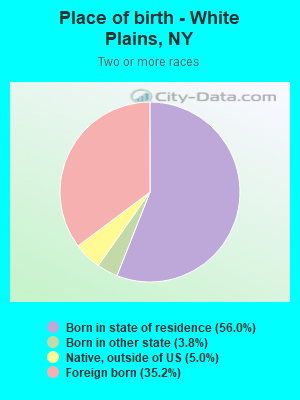
Place of birth - Born in state of residence (%) - Multirace
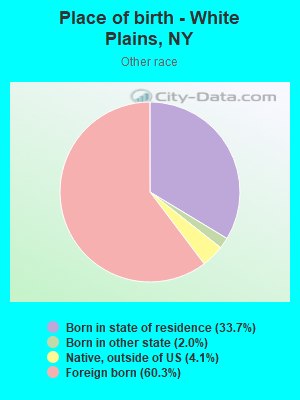
Place of birth - Born in state of residence (%) - Other Race
Place of birth - Born in other state (%)
Place of birth - Born in other state (%) - White
Place of birth - Born in other state (%) - Black or African American
Place of birth - Born in other state (%) - Asian
Place of birth - Born in other state (%) - Hispanic or Latino
Place of birth - Born in other state (%) - American Indian and Alaska Native
Place of birth - Born in other state (%) - Multirace
Place of birth - Born in other state (%) - Other Race
Place of birth - Native, outside of US (%)
Place of birth - Native, outside of US (%) - White
Place of birth - Native, outside of US (%) - Black or African American
Place of birth - Native, outside of US (%) - Asian
Place of birth - Native, outside of US (%) - Hispanic or Latino
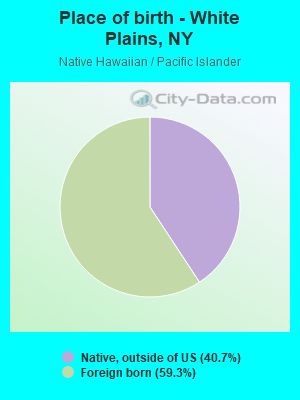
Place of birth - Native, outside of US (%) - American Indian and Alaska Native
Place of birth - Native, outside of US (%) - Multirace
Place of birth - Native, outside of US (%) - Other Race
Place of birth - Foreign born (%)
Place of birth - Foreign born (%) - White
Place of birth - Foreign born (%) - Black or African American
Place of birth - Foreign born (%) - Asian
Place of birth - Foreign born (%) - Hispanic or Latino
Place of birth - Foreign born (%) - American Indian and Alaska Native
Place of birth - Foreign born (%) - Multirace
Place of birth - Foreign born (%) - Other Race
Residents speaking English at home (%)
Residents speaking English at home - Born in the United States (%)
Residents speaking English at home - Native, born elsewhere (%)
Residents speaking English at home - Foreign born (%)
Residents speaking Spanish at home (%)
Residents speaking Spanish at home - Born in the United States (%)
Residents speaking Spanish at home - Native, born elsewhere (%)
Residents speaking Spanish at home - Foreign born (%)
Residents speaking other language at home (%)
Residents speaking other language at home - Born in the United States (%)
Residents speaking other language at home - Native, born elsewhere (%)
Residents speaking other language at home - Foreign born (%)
Marital status - Never married (%)
Marital status - Now married (%)
Marital status - Separated (%)
Marital status - Widowed (%)
Marital status - Divorced (%)
Ancestries Reported - Arab (%)
Ancestries Reported - Czech (%)
Ancestries Reported - Danish (%)
Ancestries Reported - Dutch (%)
Ancestries Reported - English (%)
Ancestries Reported - French (%)
Ancestries Reported - French Canadian (%)
Ancestries Reported - German (%)
Ancestries Reported - Greek (%)
Ancestries Reported - Hungarian (%)
Ancestries Reported - Irish (%)
Ancestries Reported - Italian (%)
Ancestries Reported - Lithuanian (%)
Ancestries Reported - Norwegian (%)
Ancestries Reported - Polish (%)
Ancestries Reported - Portuguese (%)
Ancestries Reported - Russian (%)
Ancestries Reported - Scotch-Irish (%)
Ancestries Reported - Scottish (%)
Ancestries Reported - Slovak (%)
Ancestries Reported - Subsaharan African (%)
Ancestries Reported - Swedish (%)
Ancestries Reported - Swiss (%)
Ancestries Reported - Ukrainian (%)
Ancestries Reported - United States (%)
Ancestries Reported - Welsh (%)
Ancestries Reported - West Indian (%)
Ancestries Reported - Other (%)
Geographical mobility - Same house 1 year ago (%)
Geographical mobility - Same house 1 year ago (%) - White
Geographical mobility - Same house 1 year ago (%) - Black or African American
Geographical mobility - Same house 1 year ago (%) - Asian
Geographical mobility - Same house 1 year ago (%) - Hispanic or Latino
Geographical mobility - Same house 1 year ago (%) - American Indian and Alaska Native
Geographical mobility - Same house 1 year ago (%) - Multirace
Geographical mobility - Same house 1 year ago (%) - Other Race
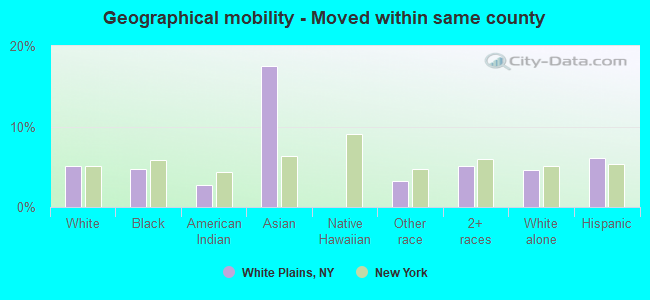
Geographical mobility - Moved within same county (%)
Geographical mobility - Moved within same county (%) - White
Geographical mobility - Moved within same county (%) - Black or African American
Geographical mobility - Moved within same county (%) - Asian
Geographical mobility - Moved within same county (%) - Hispanic or Latino
Geographical mobility - Moved within same county (%) - American Indian and Alaska Native
Geographical mobility - Moved within same county (%) - Multirace
Geographical mobility - Moved within same county (%) - Other Race
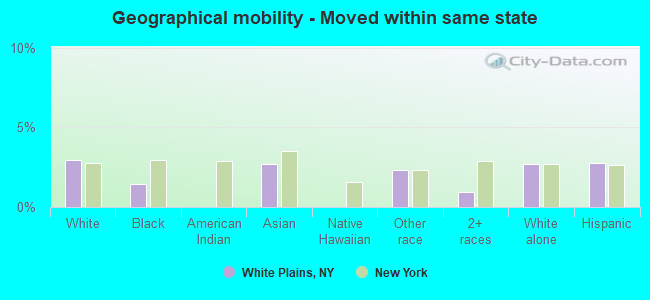
Geographical mobility - Moved from different county within same state (%)
Geographical mobility - Moved from different county within same state (%) - White
Geographical mobility - Moved from different county within same state (%) - Black or African American
Geographical mobility - Moved from different county within same state (%) - Asian
Geographical mobility - Moved from different county within same state (%) - Hispanic or Latino
Geographical mobility - Moved from different county within same state (%) - American Indian and Alaska Native
Geographical mobility - Moved from different county within same state (%) - Multirace
Geographical mobility - Moved from different county within same state (%) - Other Race
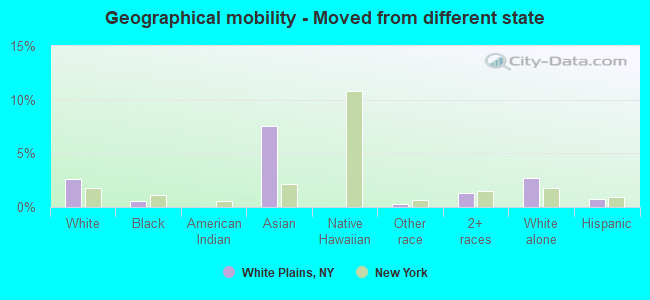
Geographical mobility - Moved from different state (%)
Geographical mobility - Moved from different state (%) - White
Geographical mobility - Moved from different state (%) - Black or African American
Geographical mobility - Moved from different state (%) - Asian
Geographical mobility - Moved from different state (%) - Hispanic or Latino
Geographical mobility - Moved from different state (%) - American Indian and Alaska Native
Geographical mobility - Moved from different state (%) - Multirace
Geographical mobility - Moved from different state (%) - Other Race
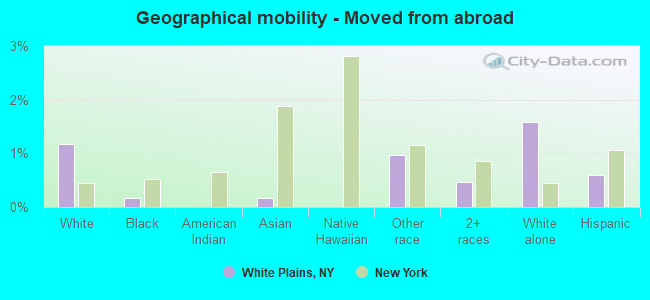
Geographical mobility - Moved from abroad (%)
Geographical mobility - Moved from abroad (%) - White
Geographical mobility - Moved from abroad (%) - Black or African American
Geographical mobility - Moved from abroad (%) - Asian
Geographical mobility - Moved from abroad (%) - Hispanic or Latino
Geographical mobility - Moved from abroad (%) - American Indian and Alaska Native
Geographical mobility - Moved from abroad (%) - Multirace
Geographical mobility - Moved from abroad (%) - Other Race
Place of birth for the foreign-born population - Ireland (%)
Place of birth for the foreign-born population - Denmark (%)
Place of birth for the foreign-born population - Norway (%)
Place of birth for the foreign-born population - Sweden (%)
Place of birth for the foreign-born population - United Kingdom (%)
Place of birth for the foreign-born population - England (%)
Place of birth for the foreign-born population - Scotland (%)
Place of birth for the foreign-born population - Other Northern Europe (%)
Place of birth for the foreign-born population - Austria (%)
Place of birth for the foreign-born population - Belgium (%)
Place of birth for the foreign-born population - France (%)
Place of birth for the foreign-born population - Germany (%)
Place of birth for the foreign-born population - Netherlands (%)
Place of birth for the foreign-born population - Switzerland (%)
Place of birth for the foreign-born population - Other Western Europe (%)
Place of birth for the foreign-born population - Greece (%)
Place of birth for the foreign-born population - Italy (%)
Place of birth for the foreign-born population - Portugal (%)
Place of birth for the foreign-born population - Spain (%)
Place of birth for the foreign-born population - Other Southern Europe (%)
Place of birth for the foreign-born population - Albania (%)
Place of birth for the foreign-born population - Belarus (%)
Place of birth for the foreign-born population - Bosnia and Herzegovina (%)
Place of birth for the foreign-born population - Bulgaria (%)
Place of birth for the foreign-born population - Croatia (%)
Place of birth for the foreign-born population - Czechoslovakia (%)
Place of birth for the foreign-born population - Hungary (%)
Place of birth for the foreign-born population - Latvia (%)
Place of birth for the foreign-born population - Lithuania (%)
Place of birth for the foreign-born population - North Macedonia (Macedonia) (%)
Place of birth for the foreign-born population - Moldova (%)
Place of birth for the foreign-born population - Poland (%)
Place of birth for the foreign-born population - Romania (%)
Place of birth for the foreign-born population - Russia (%)
Place of birth for the foreign-born population - Serbia (%)
Place of birth for the foreign-born population - Ukraine (%)
Place of birth for the foreign-born population - Other Eastern Europe (%)
Place of birth for the foreign-born population - China (%)
Place of birth for the foreign-born population - Hong Kong (%)
Place of birth for the foreign-born population - Taiwan (%)
Place of birth for the foreign-born population - Japan (%)
Place of birth for the foreign-born population - Korea (%)
Place of birth for the foreign-born population - Other Eastern Asia (%)
Place of birth for the foreign-born population - Afghanistan (%)
Place of birth for the foreign-born population - Bangladesh (%)
Place of birth for the foreign-born population - India (%)
Place of birth for the foreign-born population - Iran (%)
Place of birth for the foreign-born population - Kazakhstan (%)
Place of birth for the foreign-born population - Nepal (%)
Place of birth for the foreign-born population - Pakistan (%)
Place of birth for the foreign-born population - Sri Lanka (%)
Place of birth for the foreign-born population - Uzbekistan (%)
Place of birth for the foreign-born population - Other South Central Asia (%)
Place of birth for the foreign-born population - Burma (%)
Place of birth for the foreign-born population - Cambodia (%)
Place of birth for the foreign-born population - Indonesia (%)
Place of birth for the foreign-born population - Laos (%)
Place of birth for the foreign-born population - Malaysia (%)
Place of birth for the foreign-born population - Philippines (%)
Place of birth for the foreign-born population - Singapore (%)
Place of birth for the foreign-born population - Thailand (%)
Place of birth for the foreign-born population - Vietnam (%)
Place of birth for the foreign-born population - Other South Eastern Asia (%)
Place of birth for the foreign-born population - Armenia (%)
Place of birth for the foreign-born population - Iraq (%)
Place of birth for the foreign-born population - Israel (%)
Place of birth for the foreign-born population - Jordan (%)
Place of birth for the foreign-born population - Kuwait (%)
Place of birth for the foreign-born population - Lebanon (%)
Place of birth for the foreign-born population - Saudi Arabia (%)
Place of birth for the foreign-born population - Syria (%)
Place of birth for the foreign-born population - Turkey (%)
Place of birth for the foreign-born population - Yemen (%)
Place of birth for the foreign-born population - Other Western Asia (%)
Place of birth for the foreign-born population - Eritrea (%)
Place of birth for the foreign-born population - Ethiopia (%)
Place of birth for the foreign-born population - Kenya (%)
Place of birth for the foreign-born population - Somalia (%)
Place of birth for the foreign-born population - Uganda (%)
Place of birth for the foreign-born population - Zimbabwe (%)
Place of birth for the foreign-born population - Other Eastern Africa (%)
Place of birth for the foreign-born population - Cameroon (%)
Place of birth for the foreign-born population - Congo (%)
Place of birth for the foreign-born population - Democratic Republic of Congo (Zaire) (%)
Place of birth for the foreign-born population - Other Middle Africa (%)
Place of birth for the foreign-born population - Egypt (%)
Place of birth for the foreign-born population - Morocco (%)
Place of birth for the foreign-born population - Sudan (%)
Place of birth for the foreign-born population - Other Northern Africa (%)
Place of birth for the foreign-born population - South Africa (%)
Place of birth for the foreign-born population - Other Southern Africa (%)
Place of birth for the foreign-born population - Cabo Verde (%)
Place of birth for the foreign-born population - Ghana (%)
Place of birth for the foreign-born population - Liberia (%)
Place of birth for the foreign-born population - Nigeria (%)
Place of birth for the foreign-born population - Senegal (%)
Place of birth for the foreign-born population - Sierra Leone (%)
Place of birth for the foreign-born population - Other Western Africa (%)
Place of birth for the foreign-born population - Australia (%)
Place of birth for the foreign-born population - New Zealand (%)
Place of birth for the foreign-born population - Fiji (%)
Place of birth for the foreign-born population - Micronesia (%)
Place of birth for the foreign-born population - Bahamas (%)
Place of birth for the foreign-born population - Barbados (%)
Place of birth for the foreign-born population - Cuba (%)
Place of birth for the foreign-born population - Dominica (%)
Place of birth for the foreign-born population - Dominican Republic (%)
Place of birth for the foreign-born population - Grenada (%)
Place of birth for the foreign-born population - Haiti (%)
Place of birth for the foreign-born population - Jamaica (%)
Place of birth for the foreign-born population - St. Vincent and the Grenadines (%)
Place of birth for the foreign-born population - Trinidad and Tobago (%)
Place of birth for the foreign-born population - West Indies (%)
Place of birth for the foreign-born population - Other Caribbean (%)
Place of birth for the foreign-born population - Belize (%)
Place of birth for the foreign-born population - Costa Rica (%)
Place of birth for the foreign-born population - El Salvador (%)
Place of birth for the foreign-born population - Guatemala (%)
Place of birth for the foreign-born population - Honduras (%)
Place of birth for the foreign-born population - Mexico (%)
Place of birth for the foreign-born population - Nicaragua (%)
Place of birth for the foreign-born population - Panama (%)
Place of birth for the foreign-born population - Other Central America (%)
Place of birth for the foreign-born population - Argentina (%)
Place of birth for the foreign-born population - Bolivia (%)
Place of birth for the foreign-born population - Brazil (%)
Place of birth for the foreign-born population - Chile (%)
Place of birth for the foreign-born population - Colombia (%)
Place of birth for the foreign-born population - Ecuador (%)
Place of birth for the foreign-born population - Guyana (%)
Place of birth for the foreign-born population - Peru (%)
Place of birth for the foreign-born population - Uruguay (%)
Place of birth for the foreign-born population - Venezuela (%)
Place of birth for the foreign-born population - Other South America (%)
Place of birth for the foreign-born population - Canada (%)
Place of birth for the foreign-born population - Other Northern America (%)
Place of birth for the foreign-born population - Other (%)
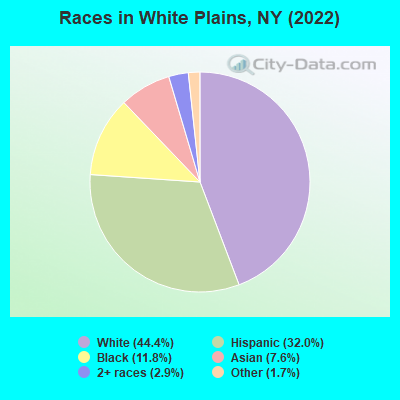
According to 2022 data, the most numerous races in White Plains, NY are White alone (26,194 residents), Hispanic (18,857 residents), and Black alone (6,966 residents). 60.2% of White Plains residents speak English at home. 30.8% of White Plains, NY residents are foreign-born (18.9% born in Latin America, 6.0% born in Asia, 4.6% born in Europe), which is 28.5% greater than the foreign-born rate of 22.0% across the entire state of New York.
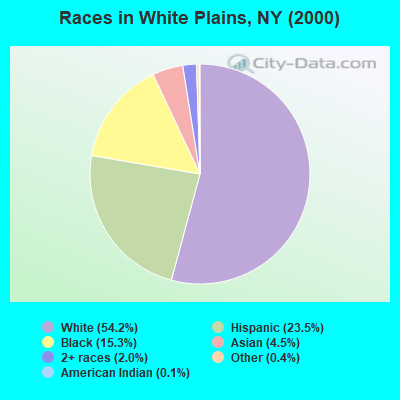
Race distribution in White Plains
2000 2022
28,743 54.2% White alone 12,476 23.5% Hispanic 8,138 15.3% Black alone 2,371 4.5% Asian alone 1,046 2.0% Two or more races 214 0.4% Other race alone 70 0.1% American Indian alone 19 0.04% Native Hawaiian and Other
26,194 44.4% White alone 18,857 32.0% Hispanic 6,966 11.8% Black alone 4,454 7.6% Asian alone 1,726 2.9% Two or more races 1,031 1.7% Other race alone
2000 2022
11,760,981 62.0% White alone 2,867,583 15.1% Hispanic 2,812,623 14.8% Black alone 1,035,926 5.5% Asian alone 366,116 1.9% Two or more races 75,499 0.4% Other race alone 52,499 0.3% American Indian alone 5,230 0.03% Native Hawaiian and Other
10,408,933 52.9% White alone 3,867,299 19.7% Hispanic 2,633,840 13.4% Black alone 1,776,286 9.0% Asian alone 732,670 3.7% Two or more races 216,110 1.1% Other race alone 35,082 0.2% American Indian alone 6,931 0.04% Native Hawaiian and Other
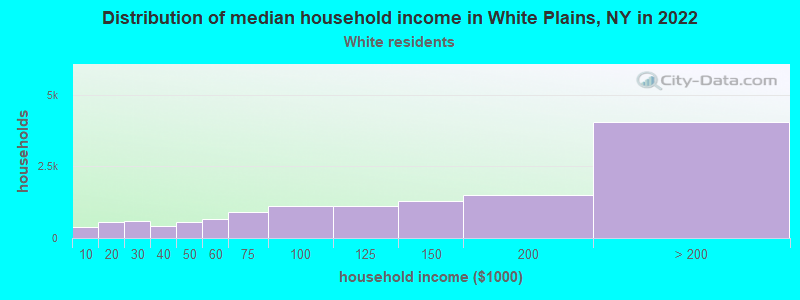
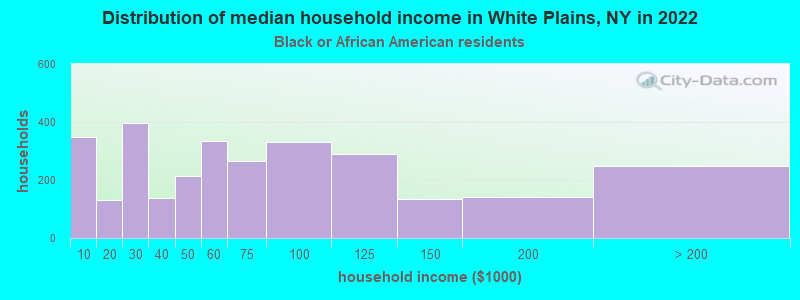
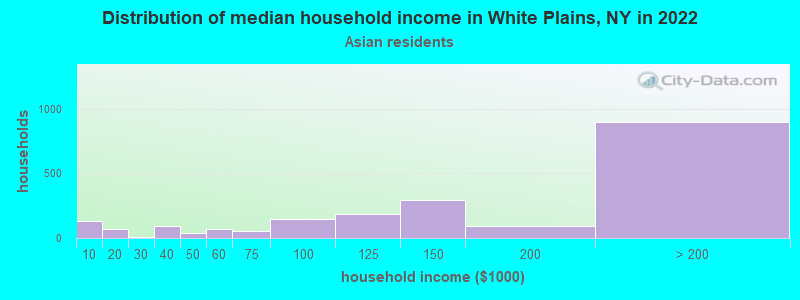
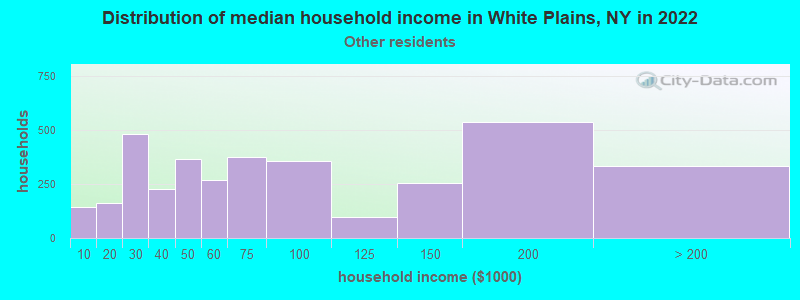
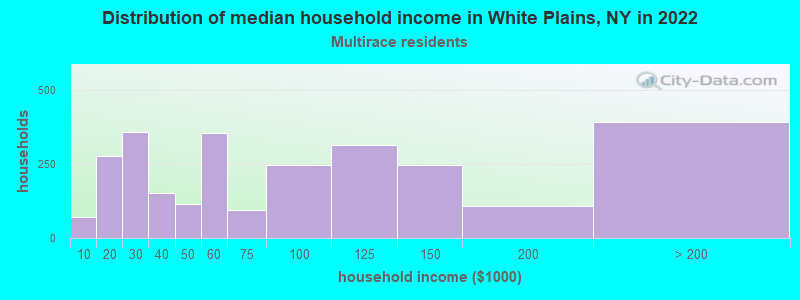
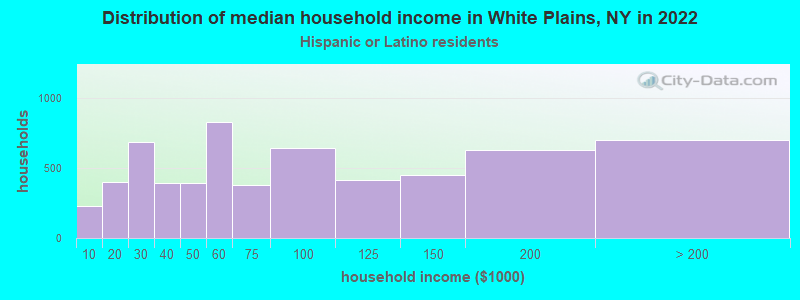
Income and house value in White Plains Median household income in 2022 $129,425 White non-Hispanic householders$56,881 Black householders$135,632 Asian householders$62,040 Some other race householders$70,784 Two or more races householders$67,131 Hispanic or Latino race householdersMedian 2022 house value $817,204 White Non-Hispanic householders$566,748 Black or African American householders $946,345 Asian householders$610,716 Some other race householders$760,575 Two or more races householders$644,325 Hispanic or Latino householders
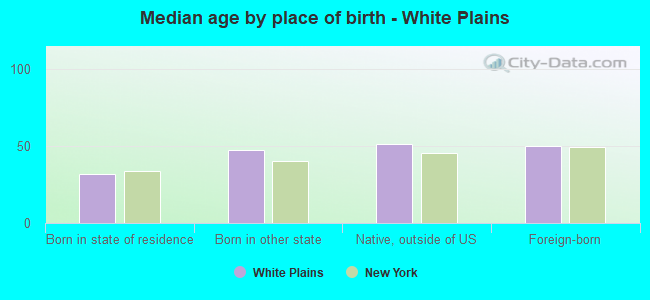
Median age by race in White Plains
46.6 Median age for White residents43.8 49.4 41.4 Median age for Black or African American residents37.9 43.0 21.8 Median age for American Indian / Alaska Native residents50.9 18.6 37.3 Median age for Asian residents36.9 37.9 -487,992,314.6 Median age for Native Hawaiian / Pacific Islander residents-477,502,295.2 -666,666,666.0 39.5 Median age for Other race residents39.6 39.0 39.5 Median age for Two or more races residents34.3 48.5 48.7 Median age for White alone residents44.8 52.1 38.7 Median age for Hispanic or Latino residents38.5 38.9
Owner/renter occupied households by race in White Plains
House owners and renters - White residents 8,826 67.6% Owner occupied4,221 32.4% Renter occupiedHouse owners and renters - Black or African American residents 1,260 43.5% Owner occupied1,635 56.5% Renter occupiedHouse owners and renters - American Indian / Alaska Native residents 39 100.0% Renter occupiedHouse owners and renters - Asian residents 889 44.6% Owner occupied1,107 55.4% Renter occupiedHouse owners and renters - Other race residents 1,141 31.2% Owner occupied2,513 68.8% Renter occupiedHouse owners and renters - Two or more races residents 1,047 38.8% Owner occupied1,651 61.2% Renter occupiedHouse owners and renters - White alone residents 8,438 68.1% Owner occupied3,945 31.9% Renter occupiedHouse owners and renters - Hispanic or Latino residents 2,147 34.6% Owner occupied4,062 65.4% Renter occupied
Language usage in White Plains
English speakers - Total 60.2% of residents of White Plains speak English at home.
26.3% of residents speak Spanish at home 7,555 51.1% Speak English very well7,242 48.9% Speak English less than very well13.5% of residents speak other language at home 5,421 71.5% Speak English very well2,160 28.5% Speak English less than very well
English speakers - Born in the United States 93.2% of residents of White Plains speak English at home.
4.0% of residents speak Spanish at home 236 91.1% Speak English very well23 8.9% Speak English less than very well3.5% of residents speak other language at home 228 100.0% Speak English very well
English speakers - Native, born elsewhere 29.7% of residents of White Plains speak English at home.
62.1% of residents speak Spanish at home 666 77.3% Speak English very well196 22.7% Speak English less than very well11.2% of residents speak other language at home 116 74.4% Speak English very well40 25.6% Speak English less than very well
English speakers - Foreign-born 19.6% of residents of White Plains speak English at home.
49.3% of residents speak Spanish at home 2,860 31.6% Speak English very well6,181 68.4% Speak English less than very well30.1% of residents speak other language at home 3,687 66.9% Speak English very well1,825 33.1% Speak English less than very well
White (Caucasian) - Speak only English Native:
90.6% (21,297)Foreign-born:
39.3% (1,525)
White (Caucasian) - Speak another language Native:
9.2% (2,154)Foreign-born:
61.5% (2,389)
Black or African American - Speak only English Native:
93.8% (4,925)Foreign-born:
52.6% (830)
Black or African American - Speak another language Native:
6.6% (344)Foreign-born:
45.9% (724)
American Indian / Alaska Native - Speak another language Native:
100.0% (126)Foreign-born:
100.0% (93)
Asian - Speak only English Native:
70.8% (787)Foreign-born:
19.6% (641)
Asian - Speak another language Native:
29.0% (323)Foreign-born:
80.5% (2,630)
Native Hawaiian / Pacific Islander - Speak another language Native:
42.9% (6)Foreign-born:
83.4% (13)
Other race - Speak only English Native:
22.3% (927)Foreign-born:
4.7% (326)
Other race - Speak another language Native:
78.4% (3,252)Foreign-born:
93.7% (6,519)
Two or more races - Speak only English Native:
59.7% (2,333)Foreign-born:
7.6% (196)
Two or more races - Speak another language Native:
40.2% (1,572)Foreign-born:
92.8% (2,389)
White alone - Speak only English Native:
92.1% (20,211)Foreign-born:
44.5% (1,456)
White alone - Speak another language Native:
7.8% (1,711)Foreign-born:
56.4% (1,848)
Hispanic or Latino - Speak only English Native:
35.8% (2,927)Foreign-born:
4.4% (422)
Hispanic or Latino - Speak another language Native:
64.1% (5,246)Foreign-born:
94.9% (9,174)
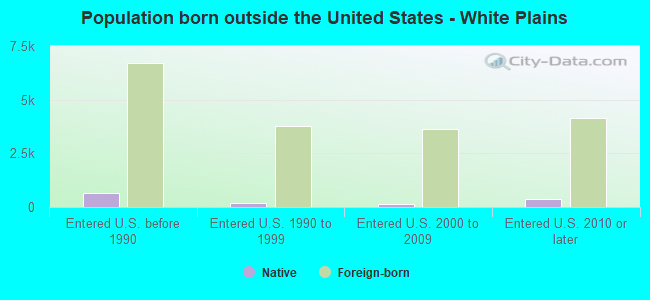
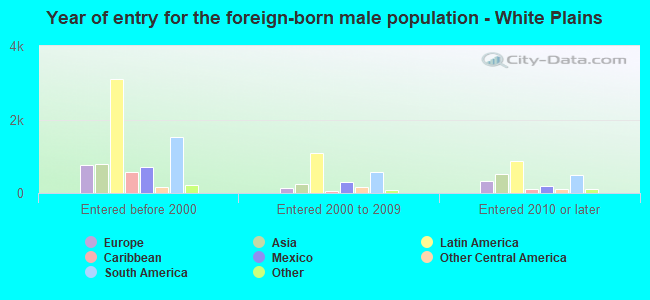
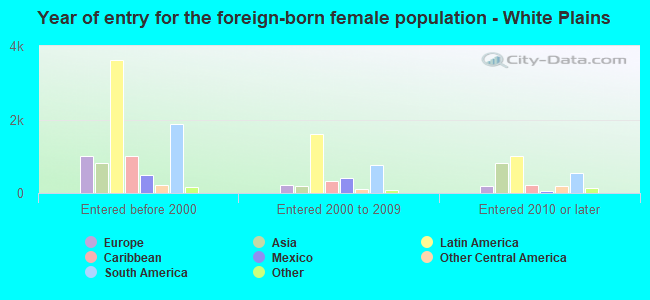
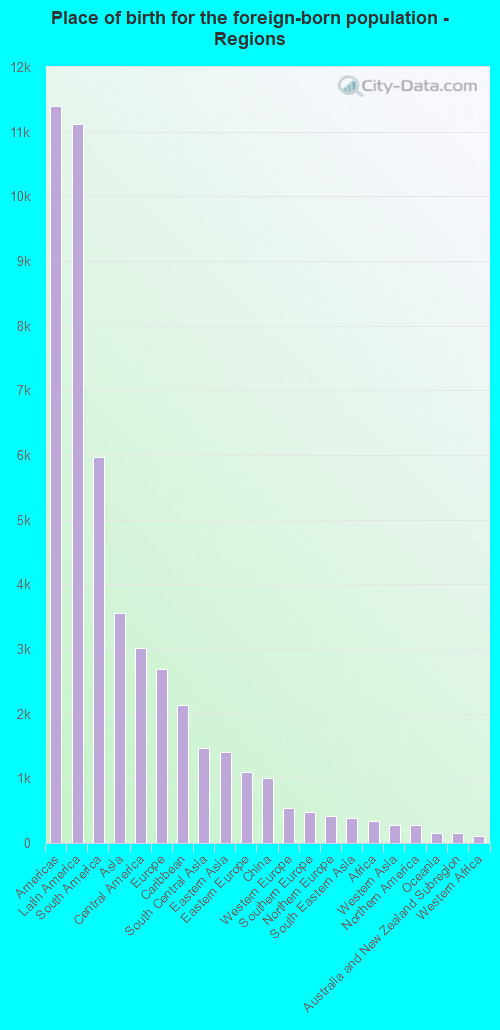
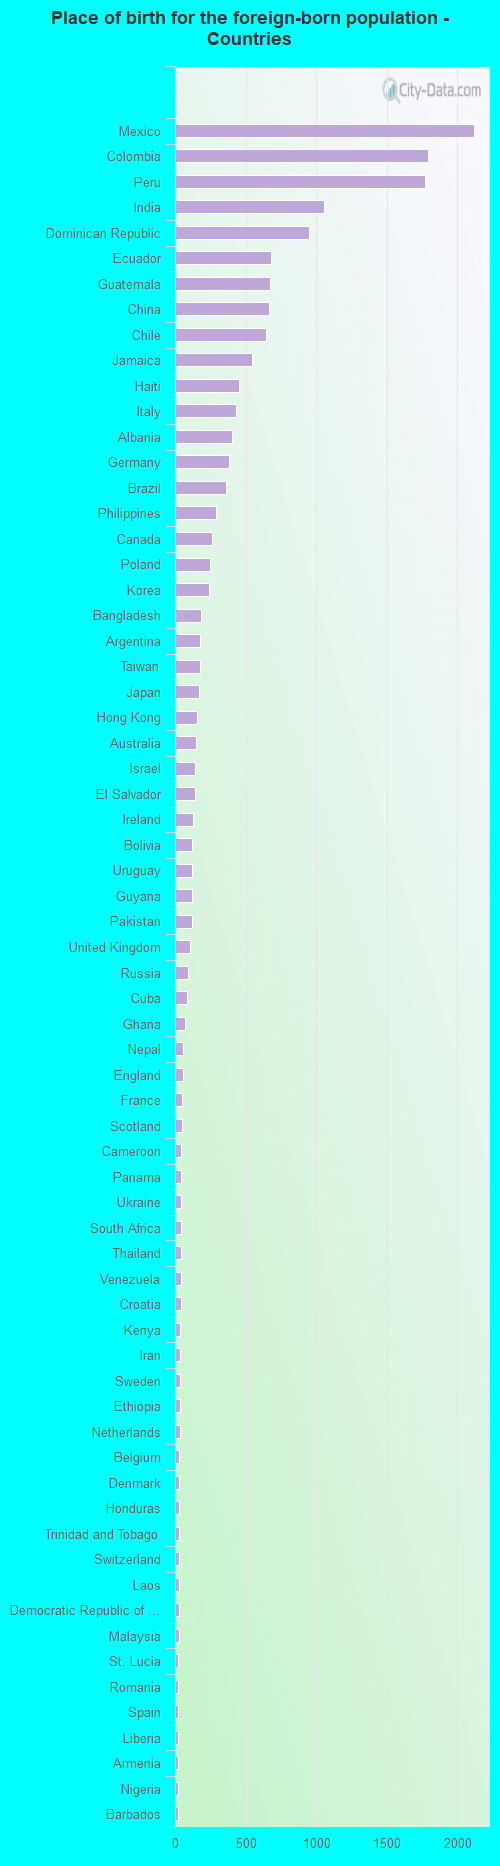
Foreign-born residents in White Plains 18,136 residents are foreign born (18.9% Latin America , 6.0% Asia , 4.6% Europe ).
This city:
30.8%New York:
22.6%
Marital status for residents in White Plains Marital status - White (Caucasian) population 15 years and over
Males 37.4% Never married52.8% Now married0.8% Separated3.4% Widowed5.6% DivorcedFemales 34.6% Never married47.5% Now married1.5% Separated9.7% Widowed6.7% DivorcedWomen who gave birth in the past 12 months Now married:
88.2% (232)Unmarried:
11.8% (31)
Women who did not give birth in the past 12 months Now married:
37.7% (2,067)Unmarried:
62.3% (3,415)
Marital status - Black or African American population 15 years and over
Males 46.9% Never married38.5% Now married0.9% Separated4.8% Widowed8.9% DivorcedFemales 51.8% Never married27.6% Now married1.7% Separated7.4% Widowed11.5% DivorcedWomen who did not give birth in the past 12 months Now married:
26.3% (572)Unmarried:
73.7% (1,608)
Marital status - American Indian / Alaska Native population 15 years and over
Males 49.1% Never married50.9% Now married0.0% Separated0.0% Widowed0.0% DivorcedFemales 50.0% Never married50.0% Now married0.0% Separated0.0% Widowed0.0% DivorcedWomen who did not give birth in the past 12 months Now married:
0.0% (0)Unmarried:
100.0% (31)
Marital status - Asian population 15 years and over
Males 34.6% Never married59.2% Now married0.5% Separated0.3% Widowed5.4% DivorcedFemales 26.7% Never married59.7% Now married0.6% Separated6.3% Widowed6.8% DivorcedWomen who gave birth in the past 12 months Now married:
100.0% (36)Unmarried:
0.0% (0)
Women who did not give birth in the past 12 months Now married:
56.4% (755)Unmarried:
43.6% (583)
Marital status - Other race population 15 years and over
Males 32.8% Never married51.6% Now married6.4% Separated0.6% Widowed8.6% DivorcedFemales 36.0% Never married39.7% Now married6.9% Separated3.8% Widowed13.6% DivorcedWomen who gave birth in the past 12 months Now married:
59.5% (57)Unmarried:
40.5% (39)
Women who did not give birth in the past 12 months Now married:
45.8% (1,358)Unmarried:
54.2% (1,610)
Marital status - Two or more races population 15 years and over
Males 42.2% Never married52.7% Now married1.8% Separated0.0% Widowed3.3% DivorcedFemales 40.2% Never married28.8% Now married4.4% Separated13.5% Widowed13.1% DivorcedWomen who gave birth in the past 12 months Now married:
51.9% (18)Unmarried:
48.1% (16)
Women who did not give birth in the past 12 months Now married:
30.0% (391)Unmarried:
70.0% (914)
Marital status - White alone, not Hispanic / Latino population 15 years and over
Males 36.2% Never married54.0% Now married0.6% Separated3.9% Widowed5.4% DivorcedFemales 31.9% Never married49.2% Now married1.4% Separated10.5% Widowed6.9% DivorcedWomen who gave birth in the past 12 months Now married:
84.6% (182)Unmarried:
15.4% (33)
Women who did not give birth in the past 12 months Now married:
41.5% (1,970)Unmarried:
58.5% (2,781)
Marital status - Hispanic or Latino population 15 years and over
Males 37.9% Never married49.3% Now married5.0% Separated0.4% Widowed7.3% DivorcedFemales 39.4% Never married37.8% Now married5.2% Separated6.1% Widowed11.5% DivorcedWomen who gave birth in the past 12 months Now married:
73.9% (133)Unmarried:
26.1% (47)
Women who did not give birth in the past 12 months Now married:
37.9% (1,687)Unmarried:
62.1% (2,763)
Ancestries in White Plains
3,192 9.0% Italian2,197 6.2% American1,796 5.0% Irish1,223 3.4% Albanian1,043 2.9% Eastern European848 2.4% German838 2.4% Jamaican612 1.7% Haitian608 1.7% Polish553 1.6% Russian395 1.1% African360 1.0% European334 0.9% English274 0.8% Brazilian170 0.5% Scottish162 0.5% Ukrainian92 0.3% Canadian90 0.3% Serbian86 0.2% Guyanese83 0.2% Israeli71 0.2% Australian68 0.2% Hungarian66 0.2% Lithuanian64 0.2% Egyptian62 0.2% Portuguese54 0.2% Greek49 0.1% Croatian49 0.1% Norwegian46 0.1% Swiss45 0.1% Romanian45 0.1% Armenian44 0.1% Cypriot42 0.1% Slovak41 0.1% Trinidadian and Tobagonian36 0.1% Swedish31 0.09% British30 0.08% Turkish30 0.08% Dutch30 0.08% French29 0.08% French Canadian28 0.08% Czech27 0.08% Ethiopian27 0.08% Danish25 0.07% Austrian24 0.07% Iranian23 0.06% Barbadian20 0.06% Kenyan19 0.05% Northern European18 0.05% British West Indian16 0.04% South African14 0.04% Bahamian13 0.04% Czechoslovakian12 0.03% Ghanaian11 0.03% Belgian11 0.03% Arab11 0.03% Lebanese11 0.03% Scotch-Irish9 0.03% Estonian8 0.02% Finnish5 0.01% Maltese5 0.01% Moroccan4 0.01% West Indian3 0.01% Syrian
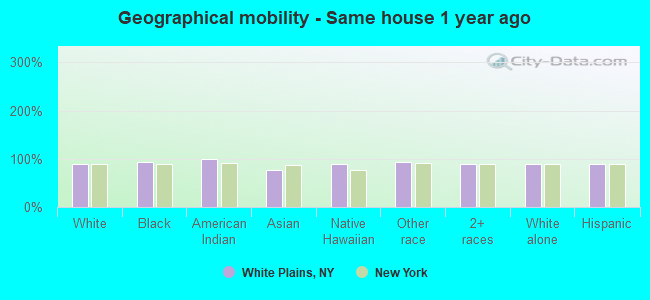
Geographical mobility in White Plains Same house 1 year ago 25,131 88.6% White (Caucasian)6,823 93.8% Black or African American160 99.2% American Indian / Alaska Native3,502 77.0% Asian27 89.7% Native Hawaiian / Pacific Islander10,723 92.8% Other race6,276 88.9% Two or more races23,156 89.0% White alone, not Hispanic / Latino16,581 89.1% Hispanic or LatinoMoved within same county 1,447 5.1% White / Caucasian343 4.7% Black or African American4 2.7% American Indian / Alaska Native799 17.6% Asian371 3.2% Other race359 5.1% Two or more races1,210 4.6% White alone, not Hispanic / Latino1,126 6.0% Hispanic or LatinoMoved within same state 835 2.9% White / Caucasian104 1.4% Black or African American123 2.7% Asian269 2.3% Other race66 0.9% Two or more races700 2.7% White alone, not Hispanic / Latino509 2.7% Hispanic or LatinoMoved from different state 732 2.6% White / Caucasian44 0.6% Black or African American345 7.6% Asian29 0.3% Other race95 1.3% Two or more races713 2.7% White alone, not Hispanic / Latino143 0.8% Hispanic or LatinoMoved from abroad 334 1.2% White12 0.2% Black or African American8 0.2% Asian113 1.0% Other race33 0.5% Two or more races413 1.6% White alone, not Hispanic / Latino111 0.6% Hispanic or Latino
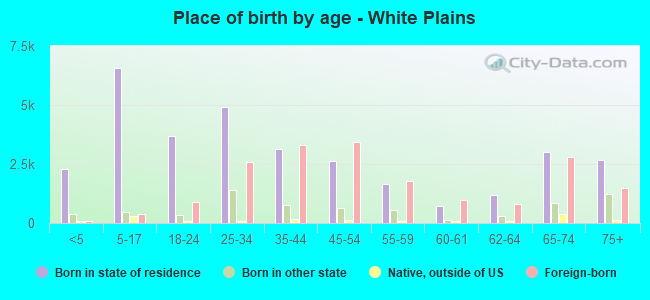
Children Nativity (place of birth) in White Plains
Children under 6 years - Living with two parents Both parents native 1,204 99.9% Native1 0.1% Foreign-bornBoth parents foreign-born 486 94.1% Native30 5.9% Foreign-bornOne native, one foreign-born parent 551 100.0% NativeChildren under 6 years - Living with one parent Native parent 251 100.0% NativeForeign-born parent 602 100.0% NativeChildren 6 to 17 years - Living with two parents Both parents native 1,768 100.0% NativeBoth parents foreign-born 1,990 93.9% Native130 6.1% Foreign-bornOne native, one foreign-born parent 954 100.0% NativeChildren 6 to 17 years - Living with one parent Native parent 821 100.0% NativeForeign-born parent 960 55.8% Native760 44.2% Foreign-born
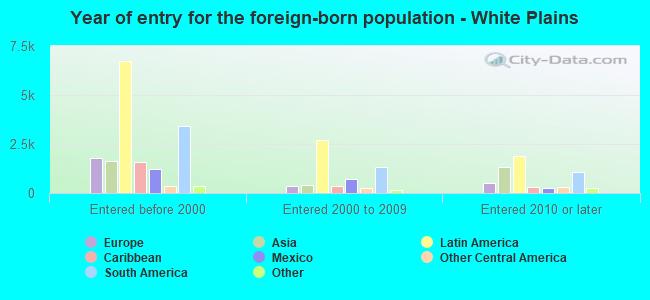
Place of birth for residents in White Plains 11,391 Americas11,120 Latin America5,963 South America3,550 Asia3,018 Central America2,698 Europe2,138 Caribbean1,473 South Central Asia1,410 Eastern Asia1,101 Eastern Europe999 China534 Western Europe483 Southern Europe419 Northern Europe393 South Eastern Asia343 Africa272 Western Asia271 Northern America152 Oceania152 Australia and New Zealand Subregion112 Western Africa83 Eastern Africa71 Middle Africa40 Southern Africa20 Northern Africa2,119 Mexico1,790 Colombia1,772 Peru1,058 India949 Dominican Republic680 Ecuador672 Guatemala667 China642 Chile549 Jamaica453 Haiti433 Italy405 Albania386 Germany362 Brazil288 Philippines261 Canada249 Poland240 Korea182 Bangladesh178 Argentina174 Taiwan170 Japan158 Hong Kong152 Australia142 Israel139 El Salvador126 Ireland120 Bolivia120 Uruguay118 Guyana117 Pakistan106 United Kingdom90 Russia87 Cuba70 Ghana57 Nepal56 England50 France50 Scotland45 Cameroon42 Panama40 Ukraine40 South Africa40 Thailand40 Venezuela39 Croatia38 Kenya36 Iran35 Sweden35 Ethiopia34 Netherlands31 Belgium30 Denmark29 Honduras27 Trinidad and Tobago26 Switzerland26 Laos25 Democratic Republic of Congo (Zaire)25 Malaysia24 St. Lucia22 Romania22 Spain21 Liberia21 Armenia20 Nigeria20 Barbados17 Kuwait17 Lebanon16 Portugal15 Serbia15 Czechoslovakia14 Costa Rica13 Bahamas12 Algeria12 United Arab Emirates10 Kazakhstan10 Grenada10 Greece10 Turkey9 Uzbekistan8 Zimbabwe7 Morocco6 Hungary5 Cambodia5 Syria5 Vietnam3 Austria
Grandparents responsible for own grandchildren in White Plains
Grandparents (30 to 59 years) White / Caucasian 10 15.0% Responsible for grandchildren54 85.0% Not responsible for grandchildrenAsian 2 100.0% Responsible for grandchildrenOther race 30 14.4% Responsible for grandchildren178 85.6% Not responsible for grandchildrenTwo or more races 73 100.0% Not responsible for grandchildrenWhite alone, not Hispanic / Latino 15 69.3% Responsible for grandchildren7 30.7% Not responsible for grandchildrenHispanic or Latino 239 100.0% Not responsible for grandchildrenGrandparents (60 years and over) White / Caucasian 18 23.5% Responsible for grandchildren60 76.5% Not responsible for grandchildrenAsian 5 20.7% Responsible for grandchildren21 79.3% Not responsible for grandchildrenOther race 628 100.0% Not responsible for grandchildrenTwo or more races 95 88.7% Responsible for grandchildren12 11.3% Not responsible for grandchildrenWhite alone, not Hispanic / Latino 18 28.6% Responsible for grandchildren45 71.4% Not responsible for grandchildrenHispanic or Latino 62 10.9% Responsible for grandchildren506 89.1% Not responsible for grandchildren