Races in White Settlement, Texas (TX) Detailed Stats
Data:
Races - White alone (%)
Races - White alone (% change since 2000)
Races - Black alone (%)
Races - Black alone (% change since 2000)
Races - American Indian alone (%)
Races - American Indian alone (% change since 2000)
Races - Asian alone (%)
Races - Asian alone (% change since 2000)
Races - Hispanic (%)
Races - Hispanic (% change since 2000)
Races - Native Hawaiian and Other Pacific Islander alone (%)
Races - Native Hawaiian and Other Pacific Islander alone (% change since 2000)
Races - Two or more races(%)
Races - Two or more races(% change since 2000)
Races - Other race alone (%)
Races - Other race alone (% change since 2000)
Racial diversity
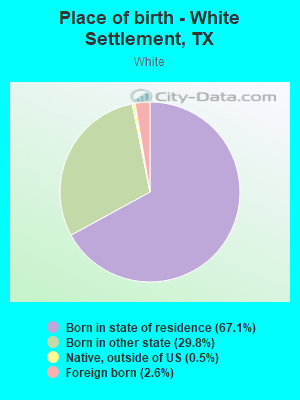
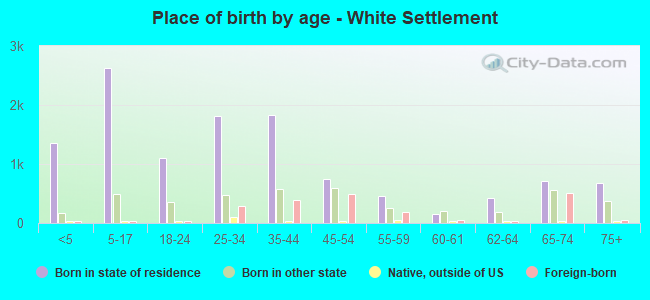
Place of birth - Born in state of residence (%)
Place of birth - Born in state of residence (%) - White
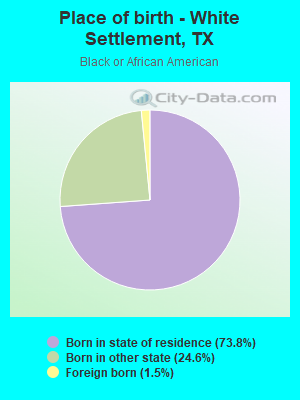
Place of birth - Born in state of residence (%) - Black or African American
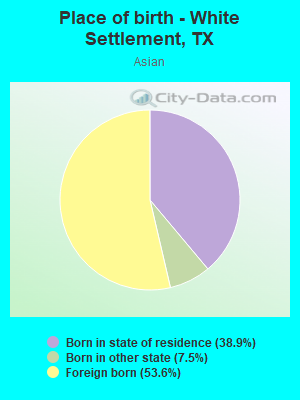
Place of birth - Born in state of residence (%) - Asian
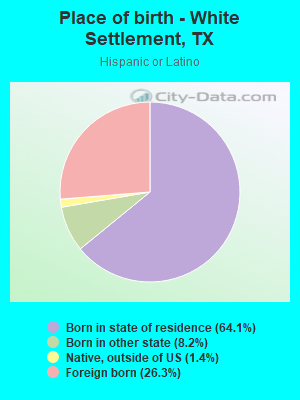
Place of birth - Born in state of residence (%) - Hispanic or Latino
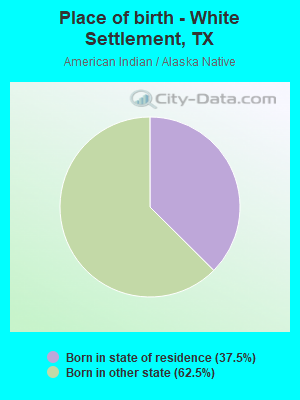
Place of birth - Born in state of residence (%) - American Indian and Alaska Native
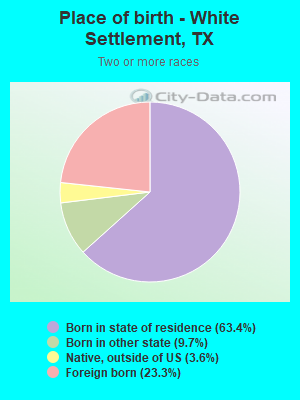
Place of birth - Born in state of residence (%) - Multirace
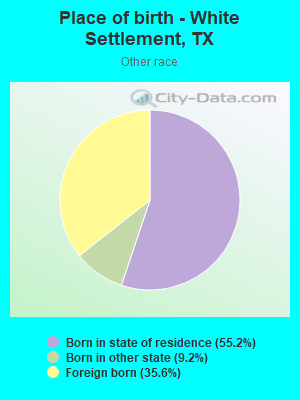
Place of birth - Born in state of residence (%) - Other Race
Place of birth - Born in other state (%)
Place of birth - Born in other state (%) - White
Place of birth - Born in other state (%) - Black or African American
Place of birth - Born in other state (%) - Asian
Place of birth - Born in other state (%) - Hispanic or Latino
Place of birth - Born in other state (%) - American Indian and Alaska Native
Place of birth - Born in other state (%) - Multirace
Place of birth - Born in other state (%) - Other Race
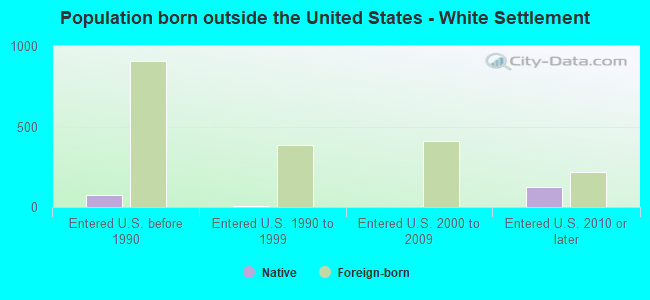
Place of birth - Native, outside of US (%)
Place of birth - Native, outside of US (%) - White
Place of birth - Native, outside of US (%) - Black or African American
Place of birth - Native, outside of US (%) - Asian
Place of birth - Native, outside of US (%) - Hispanic or Latino
Place of birth - Native, outside of US (%) - American Indian and Alaska Native
Place of birth - Native, outside of US (%) - Multirace
Place of birth - Native, outside of US (%) - Other Race
Place of birth - Foreign born (%)
Place of birth - Foreign born (%) - White
Place of birth - Foreign born (%) - Black or African American
Place of birth - Foreign born (%) - Asian
Place of birth - Foreign born (%) - Hispanic or Latino
Place of birth - Foreign born (%) - American Indian and Alaska Native
Place of birth - Foreign born (%) - Multirace
Place of birth - Foreign born (%) - Other Race
Residents speaking English at home (%)
Residents speaking English at home - Born in the United States (%)
Residents speaking English at home - Native, born elsewhere (%)
Residents speaking English at home - Foreign born (%)
Residents speaking Spanish at home (%)
Residents speaking Spanish at home - Born in the United States (%)
Residents speaking Spanish at home - Native, born elsewhere (%)
Residents speaking Spanish at home - Foreign born (%)
Residents speaking other language at home (%)
Residents speaking other language at home - Born in the United States (%)
Residents speaking other language at home - Native, born elsewhere (%)
Residents speaking other language at home - Foreign born (%)
Marital status - Never married (%)
Marital status - Now married (%)
Marital status - Separated (%)
Marital status - Widowed (%)
Marital status - Divorced (%)
Ancestries Reported - Arab (%)
Ancestries Reported - Czech (%)
Ancestries Reported - Danish (%)
Ancestries Reported - Dutch (%)
Ancestries Reported - English (%)
Ancestries Reported - French (%)
Ancestries Reported - French Canadian (%)
Ancestries Reported - German (%)
Ancestries Reported - Greek (%)
Ancestries Reported - Hungarian (%)
Ancestries Reported - Irish (%)
Ancestries Reported - Italian (%)
Ancestries Reported - Lithuanian (%)
Ancestries Reported - Norwegian (%)
Ancestries Reported - Polish (%)
Ancestries Reported - Portuguese (%)
Ancestries Reported - Russian (%)
Ancestries Reported - Scotch-Irish (%)
Ancestries Reported - Scottish (%)
Ancestries Reported - Slovak (%)
Ancestries Reported - Subsaharan African (%)
Ancestries Reported - Swedish (%)
Ancestries Reported - Swiss (%)
Ancestries Reported - Ukrainian (%)
Ancestries Reported - United States (%)
Ancestries Reported - Welsh (%)
Ancestries Reported - West Indian (%)
Ancestries Reported - Other (%)
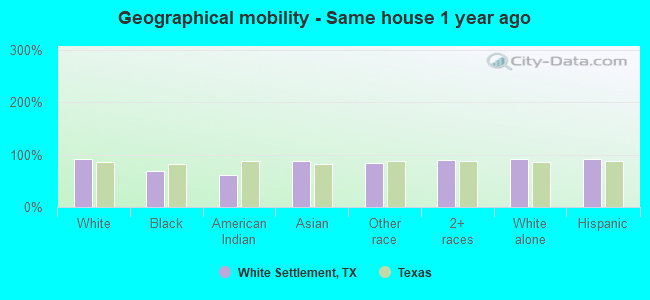
Geographical mobility - Same house 1 year ago (%)
Geographical mobility - Same house 1 year ago (%) - White
Geographical mobility - Same house 1 year ago (%) - Black or African American
Geographical mobility - Same house 1 year ago (%) - Asian
Geographical mobility - Same house 1 year ago (%) - Hispanic or Latino
Geographical mobility - Same house 1 year ago (%) - American Indian and Alaska Native
Geographical mobility - Same house 1 year ago (%) - Multirace
Geographical mobility - Same house 1 year ago (%) - Other Race
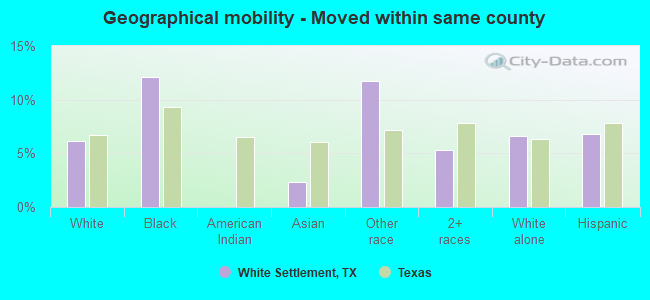
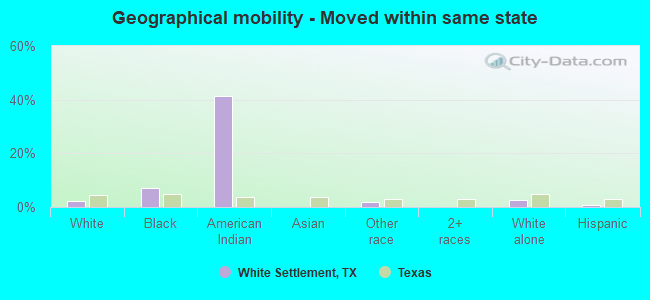
Geographical mobility - Moved within same county (%)
Geographical mobility - Moved within same county (%) - White
Geographical mobility - Moved within same county (%) - Black or African American
Geographical mobility - Moved within same county (%) - Asian
Geographical mobility - Moved within same county (%) - Hispanic or Latino
Geographical mobility - Moved within same county (%) - American Indian and Alaska Native
Geographical mobility - Moved within same county (%) - Multirace
Geographical mobility - Moved within same county (%) - Other Race
Geographical mobility - Moved from different county within same state (%)
Geographical mobility - Moved from different county within same state (%) - White
Geographical mobility - Moved from different county within same state (%) - Black or African American
Geographical mobility - Moved from different county within same state (%) - Asian
Geographical mobility - Moved from different county within same state (%) - Hispanic or Latino
Geographical mobility - Moved from different county within same state (%) - American Indian and Alaska Native
Geographical mobility - Moved from different county within same state (%) - Multirace
Geographical mobility - Moved from different county within same state (%) - Other Race
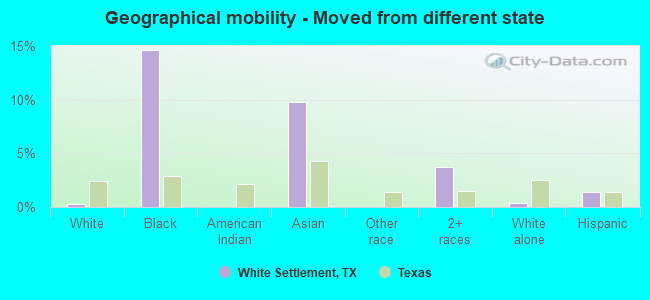
Geographical mobility - Moved from different state (%)
Geographical mobility - Moved from different state (%) - White
Geographical mobility - Moved from different state (%) - Black or African American
Geographical mobility - Moved from different state (%) - Asian
Geographical mobility - Moved from different state (%) - Hispanic or Latino
Geographical mobility - Moved from different state (%) - American Indian and Alaska Native
Geographical mobility - Moved from different state (%) - Multirace
Geographical mobility - Moved from different state (%) - Other Race
Geographical mobility - Moved from abroad (%)
Geographical mobility - Moved from abroad (%) - White
Geographical mobility - Moved from abroad (%) - Black or African American
Geographical mobility - Moved from abroad (%) - Asian
Geographical mobility - Moved from abroad (%) - Hispanic or Latino
Geographical mobility - Moved from abroad (%) - American Indian and Alaska Native
Geographical mobility - Moved from abroad (%) - Multirace
Geographical mobility - Moved from abroad (%) - Other Race
Place of birth for the foreign-born population - Ireland (%)
Place of birth for the foreign-born population - Denmark (%)
Place of birth for the foreign-born population - Norway (%)
Place of birth for the foreign-born population - Sweden (%)
Place of birth for the foreign-born population - United Kingdom (%)
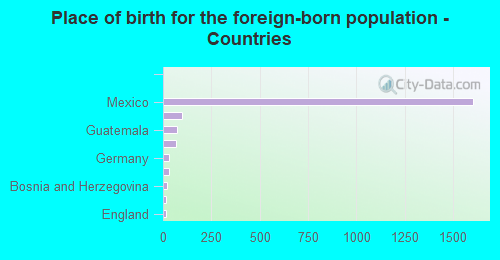
Place of birth for the foreign-born population - England (%)
Place of birth for the foreign-born population - Scotland (%)
Place of birth for the foreign-born population - Other Northern Europe (%)
Place of birth for the foreign-born population - Austria (%)
Place of birth for the foreign-born population - Belgium (%)
Place of birth for the foreign-born population - France (%)
Place of birth for the foreign-born population - Germany (%)
Place of birth for the foreign-born population - Netherlands (%)
Place of birth for the foreign-born population - Switzerland (%)
Place of birth for the foreign-born population - Other Western Europe (%)
Place of birth for the foreign-born population - Greece (%)
Place of birth for the foreign-born population - Italy (%)
Place of birth for the foreign-born population - Portugal (%)
Place of birth for the foreign-born population - Spain (%)
Place of birth for the foreign-born population - Other Southern Europe (%)
Place of birth for the foreign-born population - Albania (%)
Place of birth for the foreign-born population - Belarus (%)
Place of birth for the foreign-born population - Bosnia and Herzegovina (%)
Place of birth for the foreign-born population - Bulgaria (%)
Place of birth for the foreign-born population - Croatia (%)
Place of birth for the foreign-born population - Czechoslovakia (%)
Place of birth for the foreign-born population - Hungary (%)
Place of birth for the foreign-born population - Latvia (%)
Place of birth for the foreign-born population - Lithuania (%)
Place of birth for the foreign-born population - North Macedonia (Macedonia) (%)
Place of birth for the foreign-born population - Moldova (%)
Place of birth for the foreign-born population - Poland (%)
Place of birth for the foreign-born population - Romania (%)
Place of birth for the foreign-born population - Russia (%)
Place of birth for the foreign-born population - Serbia (%)
Place of birth for the foreign-born population - Ukraine (%)
Place of birth for the foreign-born population - Other Eastern Europe (%)
Place of birth for the foreign-born population - China (%)
Place of birth for the foreign-born population - Hong Kong (%)
Place of birth for the foreign-born population - Taiwan (%)
Place of birth for the foreign-born population - Japan (%)
Place of birth for the foreign-born population - Korea (%)
Place of birth for the foreign-born population - Other Eastern Asia (%)
Place of birth for the foreign-born population - Afghanistan (%)
Place of birth for the foreign-born population - Bangladesh (%)
Place of birth for the foreign-born population - India (%)
Place of birth for the foreign-born population - Iran (%)
Place of birth for the foreign-born population - Kazakhstan (%)
Place of birth for the foreign-born population - Nepal (%)
Place of birth for the foreign-born population - Pakistan (%)
Place of birth for the foreign-born population - Sri Lanka (%)
Place of birth for the foreign-born population - Uzbekistan (%)
Place of birth for the foreign-born population - Other South Central Asia (%)
Place of birth for the foreign-born population - Burma (%)
Place of birth for the foreign-born population - Cambodia (%)
Place of birth for the foreign-born population - Indonesia (%)
Place of birth for the foreign-born population - Laos (%)
Place of birth for the foreign-born population - Malaysia (%)
Place of birth for the foreign-born population - Philippines (%)
Place of birth for the foreign-born population - Singapore (%)
Place of birth for the foreign-born population - Thailand (%)
Place of birth for the foreign-born population - Vietnam (%)
Place of birth for the foreign-born population - Other South Eastern Asia (%)
Place of birth for the foreign-born population - Armenia (%)
Place of birth for the foreign-born population - Iraq (%)
Place of birth for the foreign-born population - Israel (%)
Place of birth for the foreign-born population - Jordan (%)
Place of birth for the foreign-born population - Kuwait (%)
Place of birth for the foreign-born population - Lebanon (%)
Place of birth for the foreign-born population - Saudi Arabia (%)
Place of birth for the foreign-born population - Syria (%)
Place of birth for the foreign-born population - Turkey (%)
Place of birth for the foreign-born population - Yemen (%)
Place of birth for the foreign-born population - Other Western Asia (%)
Place of birth for the foreign-born population - Eritrea (%)
Place of birth for the foreign-born population - Ethiopia (%)
Place of birth for the foreign-born population - Kenya (%)
Place of birth for the foreign-born population - Somalia (%)
Place of birth for the foreign-born population - Uganda (%)
Place of birth for the foreign-born population - Zimbabwe (%)
Place of birth for the foreign-born population - Other Eastern Africa (%)
Place of birth for the foreign-born population - Cameroon (%)
Place of birth for the foreign-born population - Congo (%)
Place of birth for the foreign-born population - Democratic Republic of Congo (Zaire) (%)
Place of birth for the foreign-born population - Other Middle Africa (%)
Place of birth for the foreign-born population - Egypt (%)
Place of birth for the foreign-born population - Morocco (%)
Place of birth for the foreign-born population - Sudan (%)
Place of birth for the foreign-born population - Other Northern Africa (%)
Place of birth for the foreign-born population - South Africa (%)
Place of birth for the foreign-born population - Other Southern Africa (%)
Place of birth for the foreign-born population - Cabo Verde (%)
Place of birth for the foreign-born population - Ghana (%)
Place of birth for the foreign-born population - Liberia (%)
Place of birth for the foreign-born population - Nigeria (%)
Place of birth for the foreign-born population - Senegal (%)
Place of birth for the foreign-born population - Sierra Leone (%)
Place of birth for the foreign-born population - Other Western Africa (%)
Place of birth for the foreign-born population - Australia (%)
Place of birth for the foreign-born population - New Zealand (%)
Place of birth for the foreign-born population - Fiji (%)
Place of birth for the foreign-born population - Micronesia (%)
Place of birth for the foreign-born population - Bahamas (%)
Place of birth for the foreign-born population - Barbados (%)
Place of birth for the foreign-born population - Cuba (%)
Place of birth for the foreign-born population - Dominica (%)
Place of birth for the foreign-born population - Dominican Republic (%)
Place of birth for the foreign-born population - Grenada (%)
Place of birth for the foreign-born population - Haiti (%)
Place of birth for the foreign-born population - Jamaica (%)
Place of birth for the foreign-born population - St. Vincent and the Grenadines (%)
Place of birth for the foreign-born population - Trinidad and Tobago (%)
Place of birth for the foreign-born population - West Indies (%)
Place of birth for the foreign-born population - Other Caribbean (%)
Place of birth for the foreign-born population - Belize (%)
Place of birth for the foreign-born population - Costa Rica (%)
Place of birth for the foreign-born population - El Salvador (%)
Place of birth for the foreign-born population - Guatemala (%)
Place of birth for the foreign-born population - Honduras (%)
Place of birth for the foreign-born population - Mexico (%)
Place of birth for the foreign-born population - Nicaragua (%)
Place of birth for the foreign-born population - Panama (%)
Place of birth for the foreign-born population - Other Central America (%)
Place of birth for the foreign-born population - Argentina (%)
Place of birth for the foreign-born population - Bolivia (%)
Place of birth for the foreign-born population - Brazil (%)
Place of birth for the foreign-born population - Chile (%)
Place of birth for the foreign-born population - Colombia (%)
Place of birth for the foreign-born population - Ecuador (%)
Place of birth for the foreign-born population - Guyana (%)
Place of birth for the foreign-born population - Peru (%)
Place of birth for the foreign-born population - Uruguay (%)
Place of birth for the foreign-born population - Venezuela (%)
Place of birth for the foreign-born population - Other South America (%)
Place of birth for the foreign-born population - Canada (%)
Place of birth for the foreign-born population - Other Northern America (%)
Place of birth for the foreign-born population - Other (%)
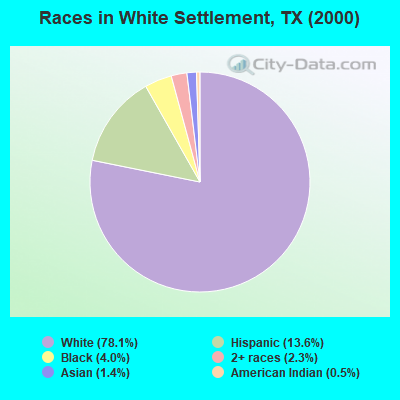
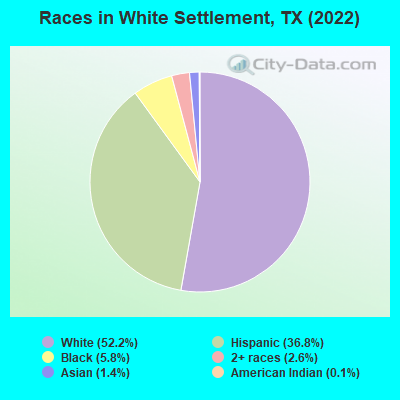
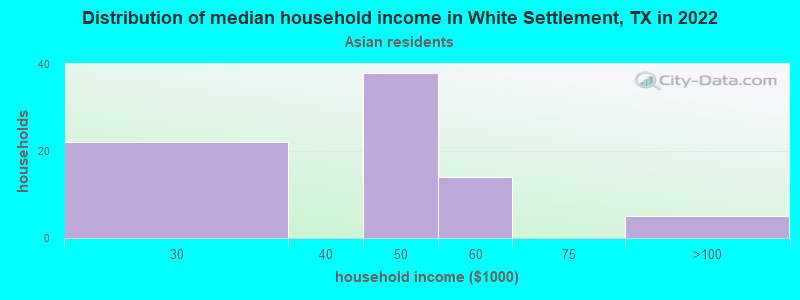
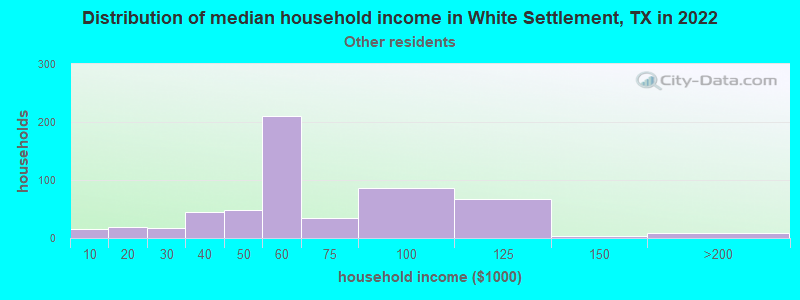
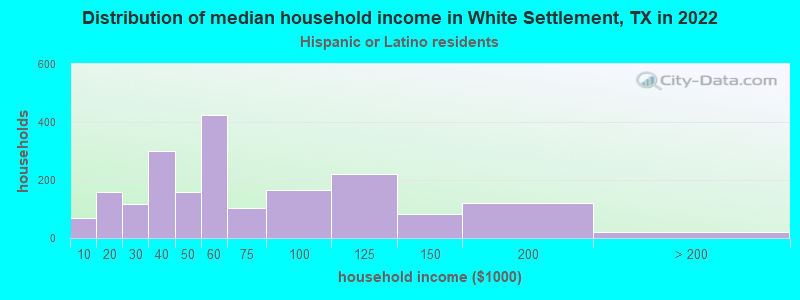
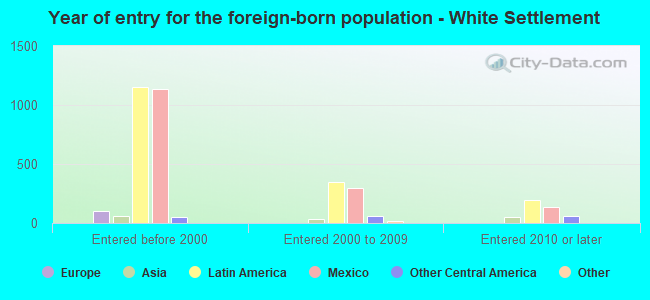
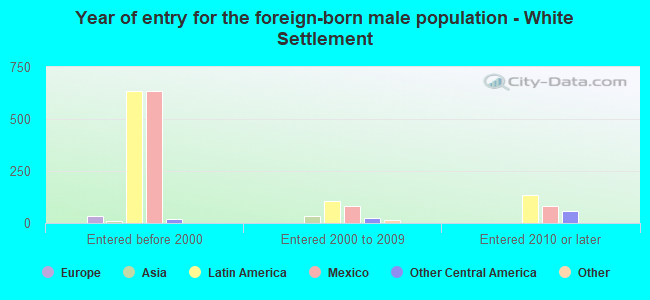
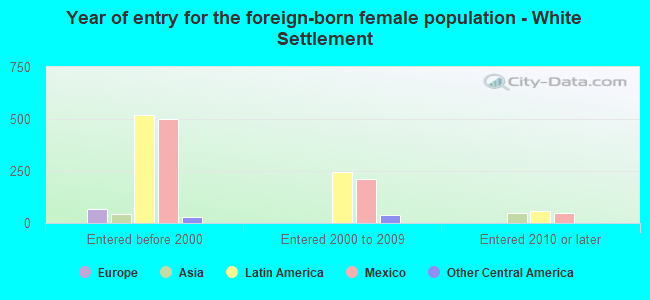
According to 2022 data, the most numerous races in White Settlement, TX are Hispanic (6,783 residents), White alone (9,637 residents), and Black alone (1,072 residents). 73.1% of White Settlement residents speak English at home. 11.0% of White Settlement, TX residents are foreign-born (9.5% born in Latin America), which is 55.1% less than the foreign-born rate of 17.0% across the entire state of Texas.
Race distribution in White Settlement
2000 2022
10,933,313 52.4% White alone 6,669,666 32.0% Hispanic 2,364,255 11.3% Black alone 554,445 2.7% Asian alone 230,567 1.1% Two or more races 68,859 0.3% American Indian alone 19,958 0.10% Other race alone 10,757 0.05% Native Hawaiian and Other
12,070,642 40.2% Hispanic 11,683,430 38.9% White alone 3,508,706 11.7% Black alone 1,608,173 5.4% Asian alone 956,560 3.2% Two or more races 125,763 0.4% Other race alone 47,023 0.2% American Indian alone 29,275 0.10% Native Hawaiian and Other
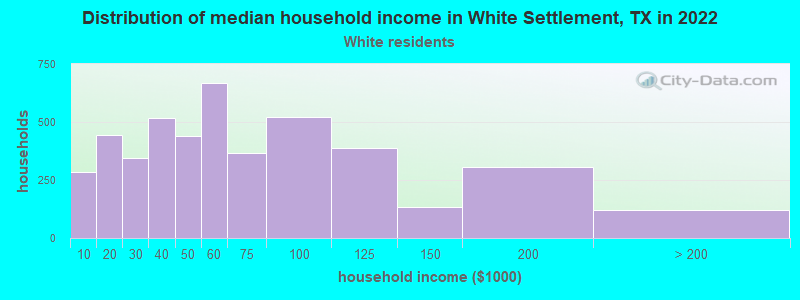
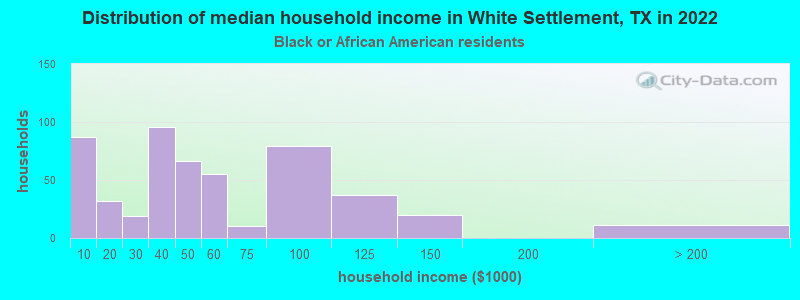
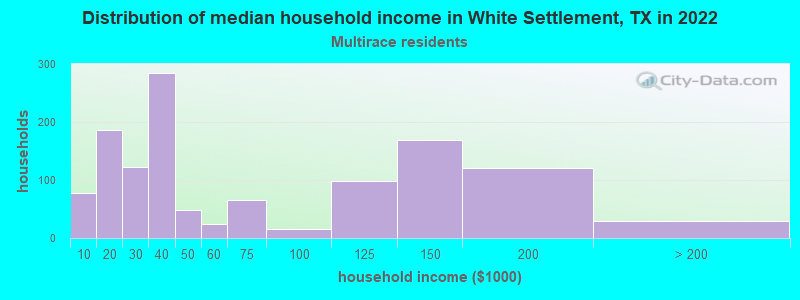
Income and house value in White Settlement Median household income in 2022 $50,515 White non-Hispanic householders$43,082 Black householders$51,645 Asian householders$50,934 Some other race householders$37,184 Two or more races householders$51,690 Hispanic or Latino race householdersMedian 2022 house value $190,325 White Non-Hispanic householders$316,444 Black or African American householders$286,634 American Indian or Alaska Native householders$193,382 Some other race householders$139,113 Two or more races householders$172,362 Hispanic or Latino householders
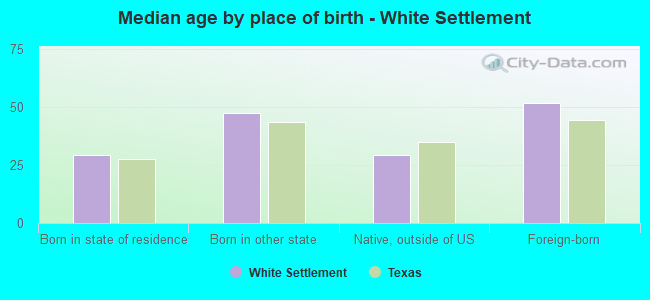
Median age by race in White Settlement
40.5 Median age for White residents38.9 42.2 25.4 Median age for Black or African American residents26.7 25.0 -831,349,205.5 Median age for American Indian / Alaska Native residents-867,996,200.5 -763,406,939.3 38.3 Median age for Asian residents35.7 44.7 -565,040,649.8 Median age for Native Hawaiian / Pacific Islander residents-550,102,248.9 -551,928,782.8 37.1 Median age for Other race residents36.2 41.7 27.2 Median age for Two or more races residents22.5 27.3 41.4 Median age for White alone residents39.6 43.4 29.3 Median age for Hispanic or Latino residents27.4 30.2
Owner/renter occupied households by race in White Settlement
House owners and renters - White residents 2,791 62.4% Owner occupied1,684 37.6% Renter occupiedHouse owners and renters - Black or African American residents 103 21.0% Owner occupied387 79.0% Renter occupiedHouse owners and renters - American Indian / Alaska Native residents 42 100.0% Owner occupiedHouse owners and renters - Asian residents 53 67.9% Owner occupied25 32.1% Renter occupiedHouse owners and renters - Other race residents 499 76.5% Owner occupied153 23.5% Renter occupiedHouse owners and renters - Two or more races residents 826 67.3% Owner occupied401 32.7% Renter occupiedHouse owners and renters - White alone residents 2,536 58.9% Owner occupied1,768 41.1% Renter occupiedHouse owners and renters - Hispanic or Latino residents 1,433 72.8% Owner occupied535 27.2% Renter occupied
Language usage in White Settlement
English speakers - Total 73.1% of residents of White Settlement speak English at home.
25.7% of residents speak Spanish at home 2,635 60.7% Speak English very well1,705 39.3% Speak English less than very well1.3% of residents speak other language at home 89 41.2% Speak English very well127 58.8% Speak English less than very well
English speakers - Born in the United States 91.8% of residents of White Settlement speak English at home.
7.4% of residents speak Spanish at home 262 86.8% Speak English very well40 13.2% Speak English less than very well0.3% of residents speak other language at home 11 100.0% Speak English very well
English speakers - Native, born elsewhere 55.1% of residents of White Settlement speak English at home.
35.3% of residents speak Spanish at home 10 15.2% Speak English very well56 84.8% Speak English less than very well
English speakers - Foreign-born 8.7% of residents of White Settlement speak English at home.
85.3% of residents speak Spanish at home 412 24.3% Speak English very well1,284 75.7% Speak English less than very well6.8% of residents speak other language at home 59 43.4% Speak English very well77 56.6% Speak English less than very well
White (Caucasian) - Speak only English Native:
96.4% (9,364)Foreign-born:
20.6% (57)
White (Caucasian) - Speak another language Native:
4.9% (473)Foreign-born:
76.9% (215)
Asian - Speak only English Native:
77.0% (75)Foreign-born:
43.4% (61)
Asian - Speak another language Native:
28.1% (27)Foreign-born:
60.8% (86)
Other race - Speak only English Native:
34.3% (300)Foreign-born:
1.2% (7)
Other race - Speak another language Native:
65.0% (568)Foreign-born:
96.7% (537)
Two or more races - Speak only English Native:
36.2% (1,096)Foreign-born:
5.0% (56)
Two or more races - Speak another language Native:
70.6% (2,137)Foreign-born:
94.8% (1,066)
White alone - Speak only English Native:
99.1% (8,943)Foreign-born:
89.7% (63)
White alone - Speak another language Native:
1.1% (100)Foreign-born:
22.2% (16)
Hispanic or Latino - Speak only English Native:
37.9% (1,584)Foreign-born:
2.9% (51)
Hispanic or Latino - Speak another language Native:
62.3% (2,606)Foreign-born:
97.3% (1,715)
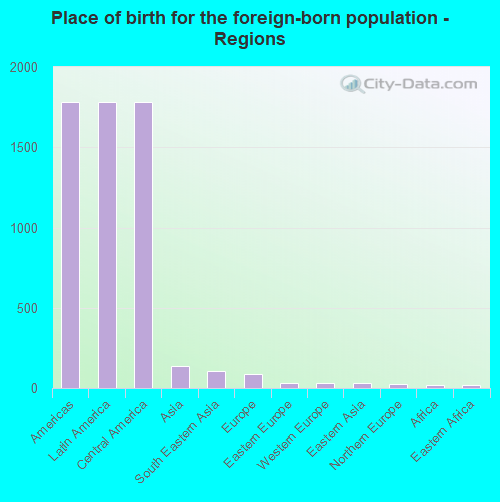
Foreign-born residents in White Settlement 2,023 residents are foreign born (9.5% Latin America ).
This city:
11.0%Texas:
17.1%
Marital status for residents in White Settlement Marital status - White (Caucasian) population 15 years and over
Males 30.4% Never married48.3% Now married1.4% Separated3.1% Widowed16.8% DivorcedFemales 32.7% Never married34.6% Now married1.9% Separated11.7% Widowed19.0% DivorcedWomen who gave birth in the past 12 months Now married:
100.0% (108)Unmarried:
0.0% (0)
Women who did not give birth in the past 12 months Now married:
35.9% (973)Unmarried:
64.1% (1,740)
Marital status - Black or African American population 15 years and over
Males 48.3% Never married32.1% Now married3.4% Separated1.9% Widowed14.3% DivorcedFemales 79.6% Never married1.5% Now married2.3% Separated7.2% Widowed9.4% DivorcedWomen who did not give birth in the past 12 months Now married:
2.9% (13)Unmarried:
97.1% (425)
Marital status - American Indian / Alaska Native population 15 years and over
Males 0.0% Never married100.0% Now married0.0% Separated0.0% Widowed0.0% DivorcedFemales 100.0% Never married0.0% Now married0.0% Separated0.0% Widowed0.0% DivorcedWomen who did not give birth in the past 12 months Now married:
0.0% (0)Unmarried:
100.0% (17)
Marital status - Asian population 15 years and over
Males 31.1% Never married56.3% Now married0.0% Separated0.0% Widowed12.6% DivorcedFemales 0.0% Never married89.0% Now married0.0% Separated11.0% Widowed0.0% DivorcedWomen who did not give birth in the past 12 months Now married:
100.0% (54)Unmarried:
0.0% (0)
Marital status - Other race population 15 years and over
Males 29.6% Never married57.6% Now married0.0% Separated1.9% Widowed10.9% DivorcedFemales 18.9% Never married75.0% Now married0.9% Separated5.2% Widowed0.0% DivorcedWomen who gave birth in the past 12 months Now married:
100.0% (29)Unmarried:
0.0% (0)
Women who did not give birth in the past 12 months Now married:
67.6% (184)Unmarried:
32.4% (88)
Marital status - Two or more races population 15 years and over
Males 42.7% Never married46.9% Now married0.4% Separated7.8% Widowed2.2% DivorcedFemales 40.7% Never married35.3% Now married3.9% Separated16.3% Widowed3.8% DivorcedWomen who did not give birth in the past 12 months Now married:
45.8% (562)Unmarried:
54.2% (665)
Marital status - White alone, not Hispanic / Latino population 15 years and over
Males 31.6% Never married43.4% Now married1.7% Separated3.6% Widowed19.7% DivorcedFemales 33.7% Never married32.1% Now married1.7% Separated12.9% Widowed19.6% DivorcedWomen who gave birth in the past 12 months Now married:
100.0% (86)Unmarried:
0.0% (0)
Women who did not give birth in the past 12 months Now married:
32.1% (799)Unmarried:
67.9% (1,690)
Marital status - Hispanic or Latino population 15 years and over
Males 29.3% Never married62.9% Now married0.0% Separated3.4% Widowed4.4% DivorcedFemales 28.7% Never married51.6% Now married3.2% Separated10.1% Widowed6.5% DivorcedWomen who gave birth in the past 12 months Now married:
100.0% (72)Unmarried:
0.0% (0)
Women who did not give birth in the past 12 months Now married:
53.6% (872)Unmarried:
46.4% (754)
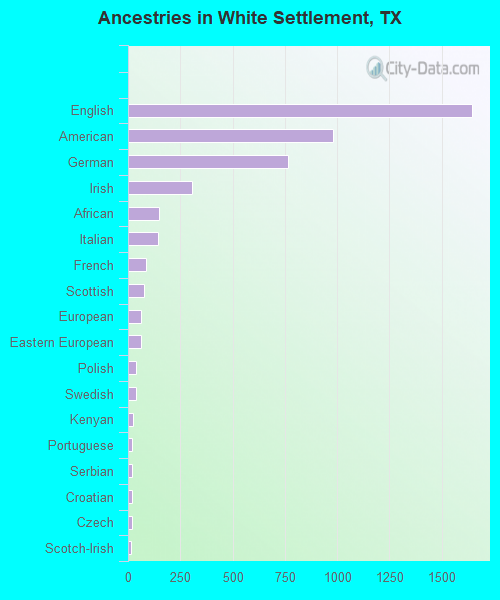
Ancestries in White Settlement
1,644 15.6% English980 9.3% American767 7.3% German308 2.9% Irish148 1.4% African145 1.4% Italian85 0.8% French75 0.7% Scottish64 0.6% European61 0.6% Eastern European39 0.4% Polish38 0.4% Swedish24 0.2% Kenyan19 0.2% Portuguese18 0.2% Serbian17 0.2% Croatian17 0.2% Czech15 0.1% Scotch-Irish12 0.1% Canadian7 0.07% Lithuanian5 0.05% Norwegian3 0.03% Danish
Children Nativity (place of birth) in White Settlement
Children under 6 years - Living with two parents Both parents native 778 100.0% NativeBoth parents foreign-born 216 100.0% NativeOne native, one foreign-born parent 245 100.0% NativeChildren under 6 years - Living with one parent Native parent 577 100.0% NativeChildren 6 to 17 years - Living with two parents Both parents native 1,108 99.8% Native2 0.2% Foreign-bornBoth parents foreign-born 364 90.5% Native38 9.5% Foreign-bornOne native, one foreign-born parent 213 100.0% NativeChildren 6 to 17 years - Living with one parent Native parent 1,010 100.0% NativeForeign-born parent 19 49.9% Native19 50.1% Foreign-born
Grandparents responsible for own grandchildren in White Settlement
Grandparents (30 to 59 years) White / Caucasian 100 58.1% Responsible for grandchildren72 41.9% Not responsible for grandchildrenOther race 17 100.0% Not responsible for grandchildrenWhite alone, not Hispanic / Latino 120 56.8% Responsible for grandchildren91 43.2% Not responsible for grandchildrenHispanic or Latino 21 100.0% Not responsible for grandchildrenGrandparents (60 years and over) White / Caucasian 60 38.3% Responsible for grandchildren97 61.7% Not responsible for grandchildrenOther race 322 100.0% Not responsible for grandchildrenWhite alone, not Hispanic / Latino 65 56.1% Responsible for grandchildren51 43.9% Not responsible for grandchildrenHispanic or Latino 477 100.0% Not responsible for grandchildren