Races in Wichita, Kansas (KS) Detailed Stats
Data:
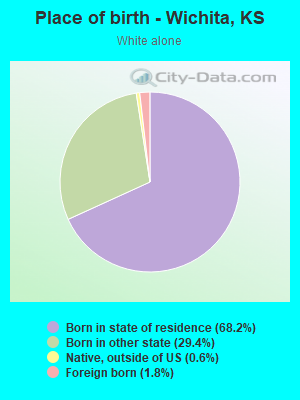
Races - White alone (%)
Races - White alone (% change since 2000)
Races - Black alone (%)
Races - Black alone (% change since 2000)
Races - American Indian alone (%)
Races - American Indian alone (% change since 2000)
Races - Asian alone (%)
Races - Asian alone (% change since 2000)
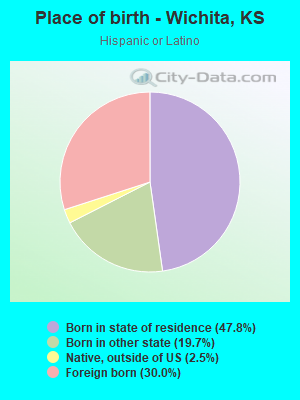
Races - Hispanic (%)
Races - Hispanic (% change since 2000)
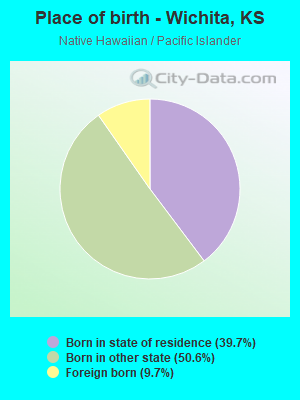
Races - Native Hawaiian and Other Pacific Islander alone (%)
Races - Native Hawaiian and Other Pacific Islander alone (% change since 2000)
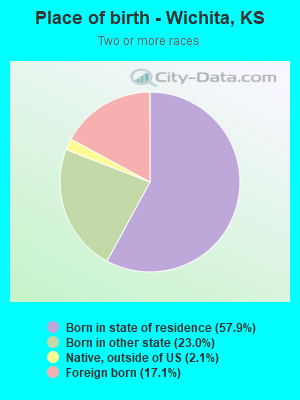
Races - Two or more races(%)
Races - Two or more races(% change since 2000)
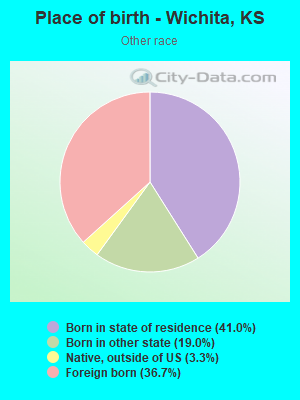
Races - Other race alone (%)
Races - Other race alone (% change since 2000)
Racial diversity
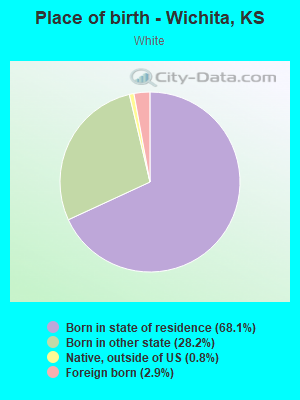
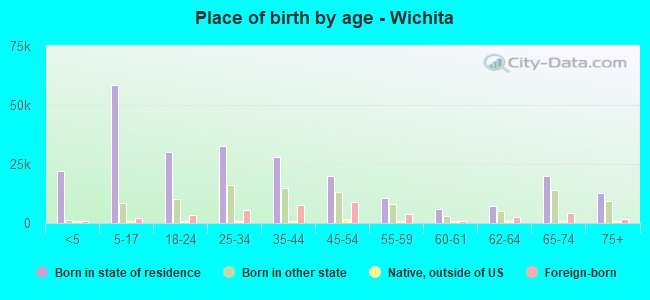
Place of birth - Born in state of residence (%)
Place of birth - Born in state of residence (%) - White
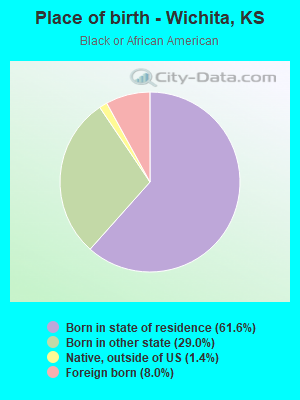
Place of birth - Born in state of residence (%) - Black or African American
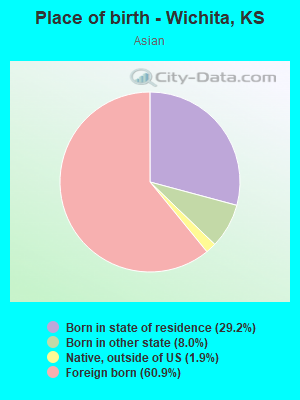
Place of birth - Born in state of residence (%) - Asian
Place of birth - Born in state of residence (%) - Hispanic or Latino
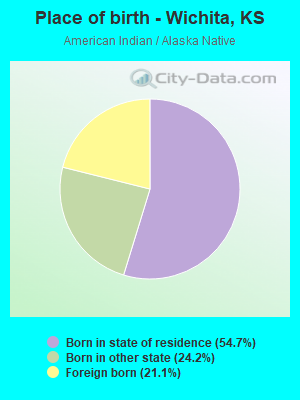
Place of birth - Born in state of residence (%) - American Indian and Alaska Native
Place of birth - Born in state of residence (%) - Multirace
Place of birth - Born in state of residence (%) - Other Race
Place of birth - Born in other state (%)
Place of birth - Born in other state (%) - White
Place of birth - Born in other state (%) - Black or African American
Place of birth - Born in other state (%) - Asian
Place of birth - Born in other state (%) - Hispanic or Latino
Place of birth - Born in other state (%) - American Indian and Alaska Native
Place of birth - Born in other state (%) - Multirace
Place of birth - Born in other state (%) - Other Race
Place of birth - Native, outside of US (%)
Place of birth - Native, outside of US (%) - White
Place of birth - Native, outside of US (%) - Black or African American
Place of birth - Native, outside of US (%) - Asian
Place of birth - Native, outside of US (%) - Hispanic or Latino
Place of birth - Native, outside of US (%) - American Indian and Alaska Native
Place of birth - Native, outside of US (%) - Multirace
Place of birth - Native, outside of US (%) - Other Race
Place of birth - Foreign born (%)
Place of birth - Foreign born (%) - White
Place of birth - Foreign born (%) - Black or African American
Place of birth - Foreign born (%) - Asian
Place of birth - Foreign born (%) - Hispanic or Latino
Place of birth - Foreign born (%) - American Indian and Alaska Native
Place of birth - Foreign born (%) - Multirace
Place of birth - Foreign born (%) - Other Race
Residents speaking English at home (%)
Residents speaking English at home - Born in the United States (%)
Residents speaking English at home - Native, born elsewhere (%)
Residents speaking English at home - Foreign born (%)
Residents speaking Spanish at home (%)
Residents speaking Spanish at home - Born in the United States (%)
Residents speaking Spanish at home - Native, born elsewhere (%)
Residents speaking Spanish at home - Foreign born (%)
Residents speaking other language at home (%)
Residents speaking other language at home - Born in the United States (%)
Residents speaking other language at home - Native, born elsewhere (%)
Residents speaking other language at home - Foreign born (%)
Marital status - Never married (%)
Marital status - Now married (%)
Marital status - Separated (%)
Marital status - Widowed (%)
Marital status - Divorced (%)
Ancestries Reported - Arab (%)
Ancestries Reported - Czech (%)
Ancestries Reported - Danish (%)
Ancestries Reported - Dutch (%)
Ancestries Reported - English (%)
Ancestries Reported - French (%)
Ancestries Reported - French Canadian (%)
Ancestries Reported - German (%)
Ancestries Reported - Greek (%)
Ancestries Reported - Hungarian (%)
Ancestries Reported - Irish (%)
Ancestries Reported - Italian (%)
Ancestries Reported - Lithuanian (%)
Ancestries Reported - Norwegian (%)
Ancestries Reported - Polish (%)
Ancestries Reported - Portuguese (%)
Ancestries Reported - Russian (%)
Ancestries Reported - Scotch-Irish (%)
Ancestries Reported - Scottish (%)
Ancestries Reported - Slovak (%)
Ancestries Reported - Subsaharan African (%)
Ancestries Reported - Swedish (%)
Ancestries Reported - Swiss (%)
Ancestries Reported - Ukrainian (%)
Ancestries Reported - United States (%)
Ancestries Reported - Welsh (%)
Ancestries Reported - West Indian (%)
Ancestries Reported - Other (%)
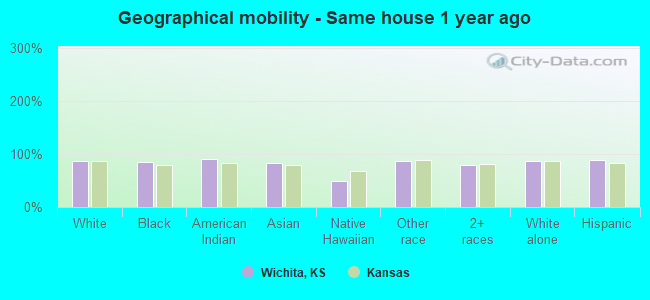
Geographical mobility - Same house 1 year ago (%)
Geographical mobility - Same house 1 year ago (%) - White
Geographical mobility - Same house 1 year ago (%) - Black or African American
Geographical mobility - Same house 1 year ago (%) - Asian
Geographical mobility - Same house 1 year ago (%) - Hispanic or Latino
Geographical mobility - Same house 1 year ago (%) - American Indian and Alaska Native
Geographical mobility - Same house 1 year ago (%) - Multirace
Geographical mobility - Same house 1 year ago (%) - Other Race
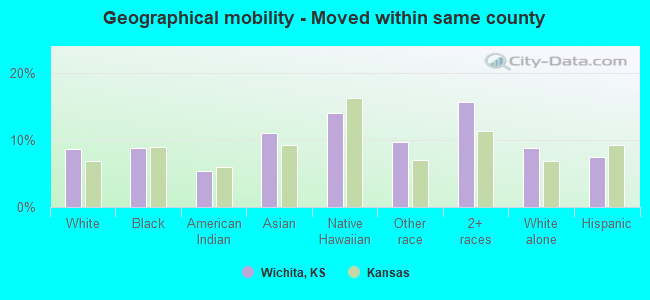
Geographical mobility - Moved within same county (%)
Geographical mobility - Moved within same county (%) - White
Geographical mobility - Moved within same county (%) - Black or African American
Geographical mobility - Moved within same county (%) - Asian
Geographical mobility - Moved within same county (%) - Hispanic or Latino
Geographical mobility - Moved within same county (%) - American Indian and Alaska Native
Geographical mobility - Moved within same county (%) - Multirace
Geographical mobility - Moved within same county (%) - Other Race
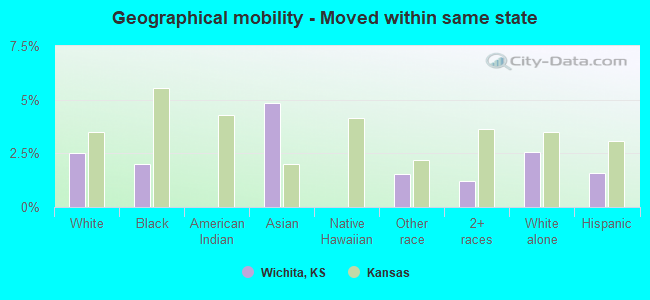
Geographical mobility - Moved from different county within same state (%)
Geographical mobility - Moved from different county within same state (%) - White
Geographical mobility - Moved from different county within same state (%) - Black or African American
Geographical mobility - Moved from different county within same state (%) - Asian
Geographical mobility - Moved from different county within same state (%) - Hispanic or Latino
Geographical mobility - Moved from different county within same state (%) - American Indian and Alaska Native
Geographical mobility - Moved from different county within same state (%) - Multirace
Geographical mobility - Moved from different county within same state (%) - Other Race
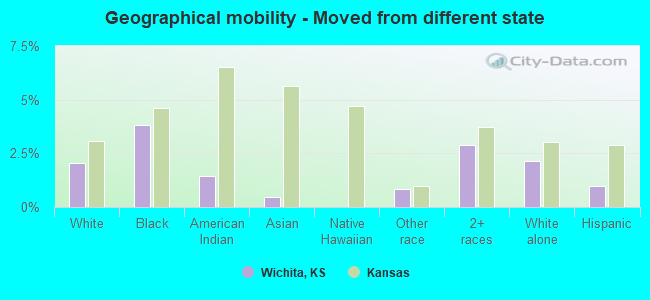
Geographical mobility - Moved from different state (%)
Geographical mobility - Moved from different state (%) - White
Geographical mobility - Moved from different state (%) - Black or African American
Geographical mobility - Moved from different state (%) - Asian
Geographical mobility - Moved from different state (%) - Hispanic or Latino
Geographical mobility - Moved from different state (%) - American Indian and Alaska Native
Geographical mobility - Moved from different state (%) - Multirace
Geographical mobility - Moved from different state (%) - Other Race
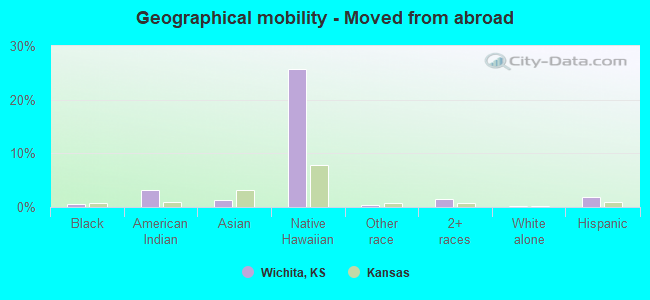
Geographical mobility - Moved from abroad (%)
Geographical mobility - Moved from abroad (%) - White
Geographical mobility - Moved from abroad (%) - Black or African American
Geographical mobility - Moved from abroad (%) - Asian
Geographical mobility - Moved from abroad (%) - Hispanic or Latino
Geographical mobility - Moved from abroad (%) - American Indian and Alaska Native
Geographical mobility - Moved from abroad (%) - Multirace
Geographical mobility - Moved from abroad (%) - Other Race
Place of birth for the foreign-born population - Ireland (%)
Place of birth for the foreign-born population - Denmark (%)
Place of birth for the foreign-born population - Norway (%)
Place of birth for the foreign-born population - Sweden (%)
Place of birth for the foreign-born population - United Kingdom (%)
Place of birth for the foreign-born population - England (%)
Place of birth for the foreign-born population - Scotland (%)
Place of birth for the foreign-born population - Other Northern Europe (%)
Place of birth for the foreign-born population - Austria (%)
Place of birth for the foreign-born population - Belgium (%)
Place of birth for the foreign-born population - France (%)
Place of birth for the foreign-born population - Germany (%)
Place of birth for the foreign-born population - Netherlands (%)
Place of birth for the foreign-born population - Switzerland (%)
Place of birth for the foreign-born population - Other Western Europe (%)
Place of birth for the foreign-born population - Greece (%)
Place of birth for the foreign-born population - Italy (%)
Place of birth for the foreign-born population - Portugal (%)
Place of birth for the foreign-born population - Spain (%)
Place of birth for the foreign-born population - Other Southern Europe (%)
Place of birth for the foreign-born population - Albania (%)
Place of birth for the foreign-born population - Belarus (%)
Place of birth for the foreign-born population - Bosnia and Herzegovina (%)
Place of birth for the foreign-born population - Bulgaria (%)
Place of birth for the foreign-born population - Croatia (%)
Place of birth for the foreign-born population - Czechoslovakia (%)
Place of birth for the foreign-born population - Hungary (%)
Place of birth for the foreign-born population - Latvia (%)
Place of birth for the foreign-born population - Lithuania (%)
Place of birth for the foreign-born population - North Macedonia (Macedonia) (%)
Place of birth for the foreign-born population - Moldova (%)
Place of birth for the foreign-born population - Poland (%)
Place of birth for the foreign-born population - Romania (%)
Place of birth for the foreign-born population - Russia (%)
Place of birth for the foreign-born population - Serbia (%)
Place of birth for the foreign-born population - Ukraine (%)
Place of birth for the foreign-born population - Other Eastern Europe (%)
Place of birth for the foreign-born population - China (%)
Place of birth for the foreign-born population - Hong Kong (%)
Place of birth for the foreign-born population - Taiwan (%)
Place of birth for the foreign-born population - Japan (%)
Place of birth for the foreign-born population - Korea (%)
Place of birth for the foreign-born population - Other Eastern Asia (%)
Place of birth for the foreign-born population - Afghanistan (%)
Place of birth for the foreign-born population - Bangladesh (%)
Place of birth for the foreign-born population - India (%)
Place of birth for the foreign-born population - Iran (%)
Place of birth for the foreign-born population - Kazakhstan (%)
Place of birth for the foreign-born population - Nepal (%)
Place of birth for the foreign-born population - Pakistan (%)
Place of birth for the foreign-born population - Sri Lanka (%)
Place of birth for the foreign-born population - Uzbekistan (%)
Place of birth for the foreign-born population - Other South Central Asia (%)
Place of birth for the foreign-born population - Burma (%)
Place of birth for the foreign-born population - Cambodia (%)
Place of birth for the foreign-born population - Indonesia (%)
Place of birth for the foreign-born population - Laos (%)
Place of birth for the foreign-born population - Malaysia (%)
Place of birth for the foreign-born population - Philippines (%)
Place of birth for the foreign-born population - Singapore (%)
Place of birth for the foreign-born population - Thailand (%)
Place of birth for the foreign-born population - Vietnam (%)
Place of birth for the foreign-born population - Other South Eastern Asia (%)
Place of birth for the foreign-born population - Armenia (%)
Place of birth for the foreign-born population - Iraq (%)
Place of birth for the foreign-born population - Israel (%)
Place of birth for the foreign-born population - Jordan (%)
Place of birth for the foreign-born population - Kuwait (%)
Place of birth for the foreign-born population - Lebanon (%)
Place of birth for the foreign-born population - Saudi Arabia (%)
Place of birth for the foreign-born population - Syria (%)
Place of birth for the foreign-born population - Turkey (%)
Place of birth for the foreign-born population - Yemen (%)
Place of birth for the foreign-born population - Other Western Asia (%)
Place of birth for the foreign-born population - Eritrea (%)
Place of birth for the foreign-born population - Ethiopia (%)
Place of birth for the foreign-born population - Kenya (%)
Place of birth for the foreign-born population - Somalia (%)
Place of birth for the foreign-born population - Uganda (%)
Place of birth for the foreign-born population - Zimbabwe (%)
Place of birth for the foreign-born population - Other Eastern Africa (%)
Place of birth for the foreign-born population - Cameroon (%)
Place of birth for the foreign-born population - Congo (%)
Place of birth for the foreign-born population - Democratic Republic of Congo (Zaire) (%)
Place of birth for the foreign-born population - Other Middle Africa (%)
Place of birth for the foreign-born population - Egypt (%)
Place of birth for the foreign-born population - Morocco (%)
Place of birth for the foreign-born population - Sudan (%)
Place of birth for the foreign-born population - Other Northern Africa (%)
Place of birth for the foreign-born population - South Africa (%)
Place of birth for the foreign-born population - Other Southern Africa (%)
Place of birth for the foreign-born population - Cabo Verde (%)
Place of birth for the foreign-born population - Ghana (%)
Place of birth for the foreign-born population - Liberia (%)
Place of birth for the foreign-born population - Nigeria (%)
Place of birth for the foreign-born population - Senegal (%)
Place of birth for the foreign-born population - Sierra Leone (%)
Place of birth for the foreign-born population - Other Western Africa (%)
Place of birth for the foreign-born population - Australia (%)
Place of birth for the foreign-born population - New Zealand (%)
Place of birth for the foreign-born population - Fiji (%)
Place of birth for the foreign-born population - Micronesia (%)
Place of birth for the foreign-born population - Bahamas (%)
Place of birth for the foreign-born population - Barbados (%)
Place of birth for the foreign-born population - Cuba (%)
Place of birth for the foreign-born population - Dominica (%)
Place of birth for the foreign-born population - Dominican Republic (%)
Place of birth for the foreign-born population - Grenada (%)
Place of birth for the foreign-born population - Haiti (%)
Place of birth for the foreign-born population - Jamaica (%)
Place of birth for the foreign-born population - St. Vincent and the Grenadines (%)
Place of birth for the foreign-born population - Trinidad and Tobago (%)
Place of birth for the foreign-born population - West Indies (%)
Place of birth for the foreign-born population - Other Caribbean (%)
Place of birth for the foreign-born population - Belize (%)
Place of birth for the foreign-born population - Costa Rica (%)
Place of birth for the foreign-born population - El Salvador (%)
Place of birth for the foreign-born population - Guatemala (%)
Place of birth for the foreign-born population - Honduras (%)
Place of birth for the foreign-born population - Mexico (%)
Place of birth for the foreign-born population - Nicaragua (%)
Place of birth for the foreign-born population - Panama (%)
Place of birth for the foreign-born population - Other Central America (%)
Place of birth for the foreign-born population - Argentina (%)
Place of birth for the foreign-born population - Bolivia (%)
Place of birth for the foreign-born population - Brazil (%)
Place of birth for the foreign-born population - Chile (%)
Place of birth for the foreign-born population - Colombia (%)
Place of birth for the foreign-born population - Ecuador (%)
Place of birth for the foreign-born population - Guyana (%)
Place of birth for the foreign-born population - Peru (%)
Place of birth for the foreign-born population - Uruguay (%)
Place of birth for the foreign-born population - Venezuela (%)
Place of birth for the foreign-born population - Other South America (%)
Place of birth for the foreign-born population - Canada (%)
Place of birth for the foreign-born population - Other Northern America (%)
Place of birth for the foreign-born population - Other (%)
Latest news about races in Wichita, KS collected exclusively by city-data.com from local newspapers, TV, and radio stations
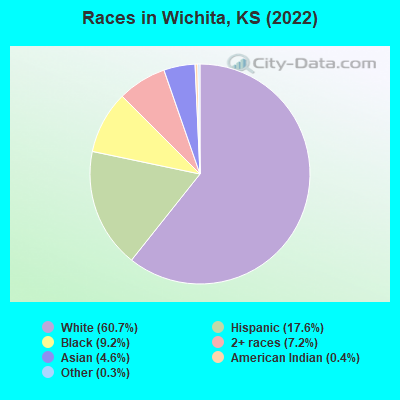
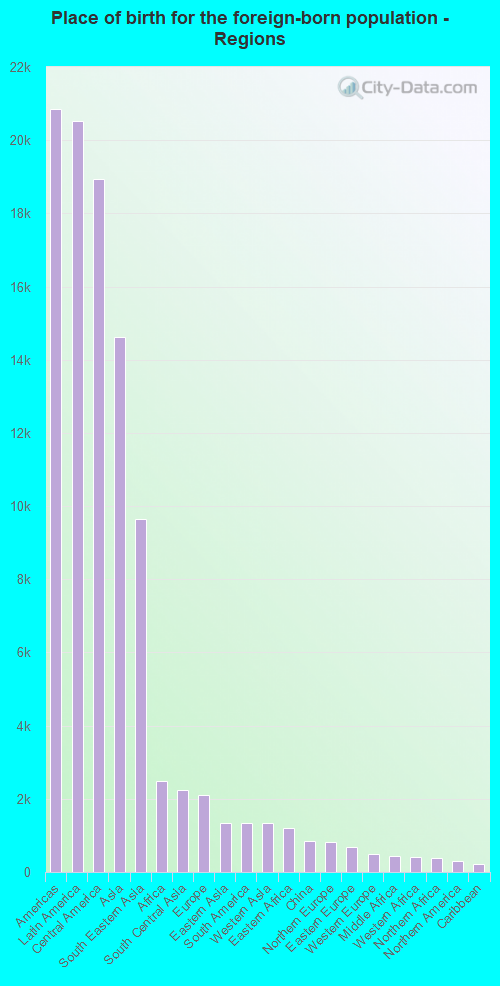
According to 2022 data, the most numerous races in Wichita, KS are White alone (240,632 residents), Hispanic (69,637 residents), and Black alone (36,371 residents). 83.9% of Wichita residents speak English at home. 10.1% of Wichita, KS residents are foreign-born (5.1% born in Latin America, 3.6% born in Asia), which is 30.5% greater than the foreign-born rate of 7.0% across the entire state of Kansas.
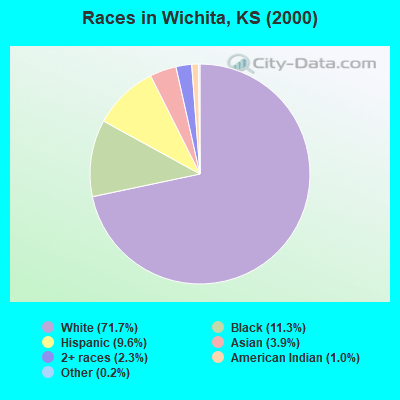
Race distribution in Wichita
2000 2022
246,924 71.7% White alone 38,732 11.3% Black alone 33,112 9.6% Hispanic 13,543 3.9% Asian alone 7,752 2.3% Two or more races 3,525 1.0% American Indian alone 528 0.2% Other race alone 168 0.05% Native Hawaiian and Other
240,632 60.7% White alone 69,637 17.6% Hispanic 36,371 9.2% Black alone 28,465 7.2% Two or more races 18,237 4.6% Asian alone 1,389 0.4% American Indian alone 1,276 0.3% Other race alone 198 0.05% Native Hawaiian and Other
2000 2022
2,233,997 83.1% White alone 188,252 7.0% Hispanic 151,407 5.6% Black alone 46,301 1.7% Asian alone 42,508 1.6% Two or more races 22,322 0.8% American Indian alone 2,477 0.09% Other race alone 1,154 0.04% Native Hawaiian and Other
2,147,943 73.1% White alone 381,746 13.0% Hispanic 147,666 5.0% Black alone 145,362 4.9% Two or more races 85,085 2.9% Asian alone 13,263 0.5% Other race alone 12,065 0.4% American Indian alone 4,020 0.1% Native Hawaiian and Other
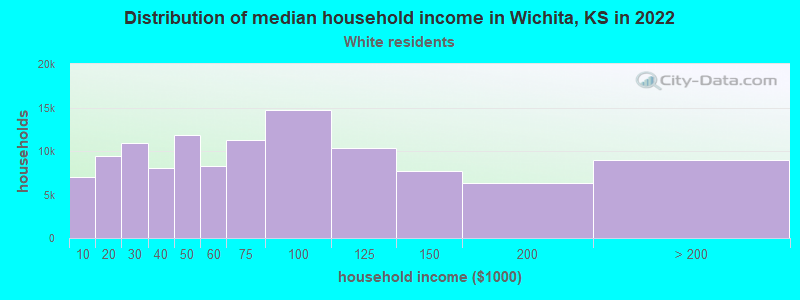
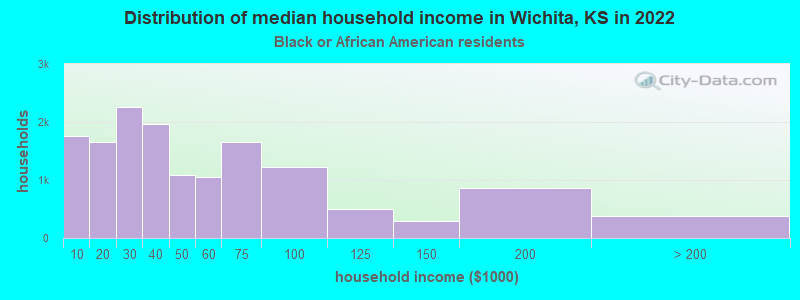
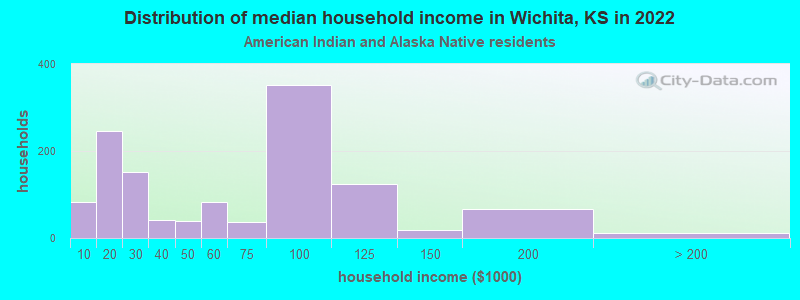
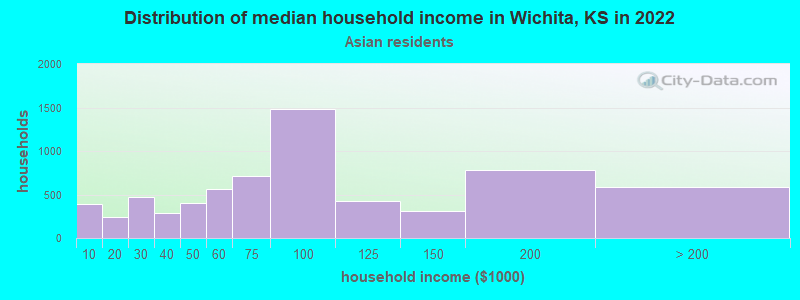
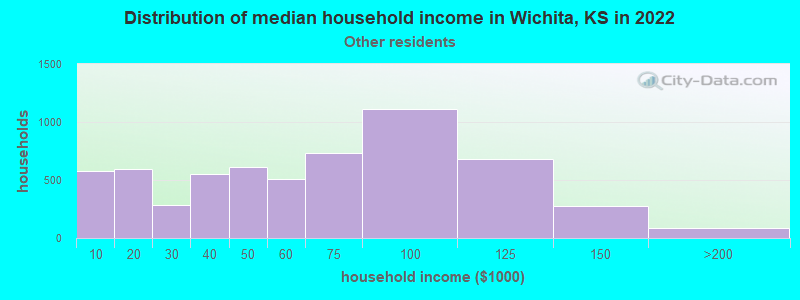
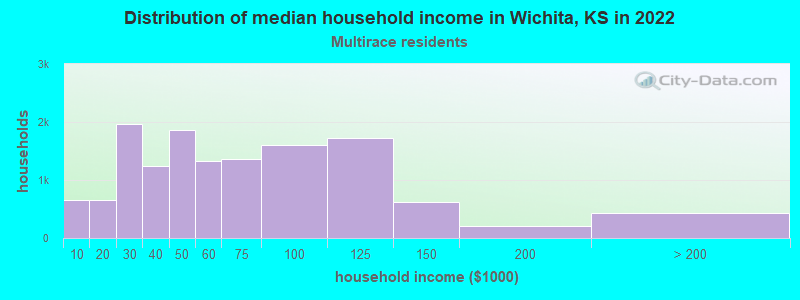
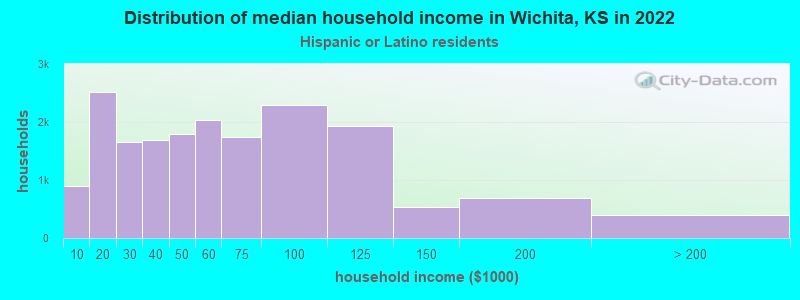
Income and house value in Wichita Median household income in 2022 $63,245 White non-Hispanic householders$37,019 Black householders$41,474 American Indian and Alaska Native householders$78,563 Asian householders$52,255 Some other race householders$53,155 Two or more races householders$51,538 Hispanic or Latino race householdersMedian 2022 house value $206,580 White Non-Hispanic householders$125,450 Black or African American householders$172,776 American Indian or Alaska Native householders $210,085 Asian householders$231,620 Native Hawaiian and other Pacific Islander householders$131,710 Some other race householders$155,498 Two or more races householders$138,220 Hispanic or Latino householders
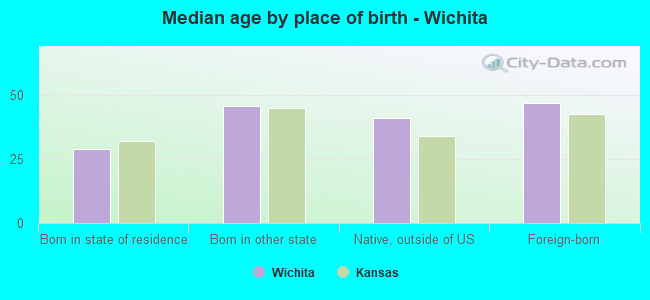
Median age by race in Wichita
39.9 Median age for White residents38.5 41.1 34.6 Median age for Black or African American residents34.8 34.5 34.2 Median age for American Indian / Alaska Native residents34.9 30.0 37.3 Median age for Asian residents37.2 37.7 44.9 Median age for Native Hawaiian / Pacific Islander residents61.3 -666,666,666.0 30.2 Median age for Other race residents29.1 32.7 23.6 Median age for Two or more races residents23.6 23.7 41.3 Median age for White alone residents39.9 42.7 26.3 Median age for Hispanic or Latino residents27.0 24.8
Owner/renter occupied households by race in Wichita
House owners and renters - White residents 76,012 66.2% Owner occupied38,827 33.8% Renter occupiedHouse owners and renters - Black or African American residents 5,617 38.2% Owner occupied9,101 61.8% Renter occupiedHouse owners and renters - American Indian / Alaska Native residents 739 61.7% Owner occupied459 38.3% Renter occupiedHouse owners and renters - Asian residents 4,488 67.4% Owner occupied2,170 32.6% Renter occupiedHouse owners and renters - Native Hawaiian / Pacific Islander residents 10 14.0% Owner occupied61 86.0% Renter occupiedHouse owners and renters - Other race residents 3,563 59.1% Owner occupied2,467 40.9% Renter occupiedHouse owners and renters - Two or more races residents 5,963 43.7% Owner occupied7,693 56.3% Renter occupiedHouse owners and renters - White alone residents 72,393 66.3% Owner occupied36,865 33.7% Renter occupiedHouse owners and renters - Hispanic or Latino residents 11,717 64.5% Owner occupied6,437 35.5% Renter occupied
Language usage in Wichita
English speakers - Total 83.9% of residents of Wichita speak English at home.
11.1% of residents speak Spanish at home 25,287 61.2% Speak English very well16,030 38.8% Speak English less than very well5.0% of residents speak other language at home 11,093 59.2% Speak English very well7,645 40.8% Speak English less than very well
English speakers - Born in the United States 89.7% of residents of Wichita speak English at home.
8.9% of residents speak Spanish at home 7,877 86.4% Speak English very well1,238 13.6% Speak English less than very well1.3% of residents speak other language at home 1,264 94.3% Speak English very well76 5.7% Speak English less than very well
English speakers - Native, born elsewhere 63.9% of residents of Wichita speak English at home.
32.1% of residents speak Spanish at home 1,082 72.5% Speak English very well411 27.5% Speak English less than very well4.0% of residents speak other language at home 184 100.0% Speak English very well
English speakers - Foreign-born 16.6% of residents of Wichita speak English at home.
45.7% of residents speak Spanish at home 5,726 31.2% Speak English very well12,653 68.8% Speak English less than very well37.7% of residents speak other language at home 7,894 52.0% Speak English very well7,289 48.0% Speak English less than very well
White (Caucasian) - Speak only English Native:
96.5% (230,072)Foreign-born:
27.0% (2,003)
White (Caucasian) - Speak another language Native:
3.5% (8,322)Foreign-born:
73.0% (5,412)
Black or African American - Speak only English Native:
97.5% (31,201)Foreign-born:
36.4% (1,091)
Black or African American - Speak another language Native:
2.5% (796)Foreign-born:
63.6% (1,906)
American Indian / Alaska Native - Speak only English Native:
76.4% (2,805)Foreign-born:
5.5% (59)
American Indian / Alaska Native - Speak another language Native:
25.4% (932)Foreign-born:
93.8% (1,003)
Asian - Speak only English Native:
63.0% (3,776)Foreign-born:
16.7% (1,869)
Asian - Speak another language Native:
37.0% (2,222)Foreign-born:
83.3% (9,332)
Native Hawaiian / Pacific Islander - Speak another language Native:
38.5% (80)Foreign-born:
85.0% (22)
Other race - Speak only English Native:
46.3% (6,204)Foreign-born:
6.9% (582)
Other race - Speak another language Native:
53.7% (7,189)Foreign-born:
93.1% (7,860)
Two or more races - Speak only English Native:
80.6% (31,023)Foreign-born:
10.7% (961)
Two or more races - Speak another language Native:
19.4% (7,465)Foreign-born:
89.3% (8,047)
White alone - Speak only English Native:
98.7% (221,308)Foreign-born:
39.1% (1,707)
White alone - Speak another language Native:
1.3% (2,907)Foreign-born:
60.9% (2,655)
Hispanic or Latino - Speak only English Native:
53.9% (23,585)Foreign-born:
8.4% (1,751)
Hispanic or Latino - Speak another language Native:
46.1% (20,148)Foreign-born:
91.6% (19,119)
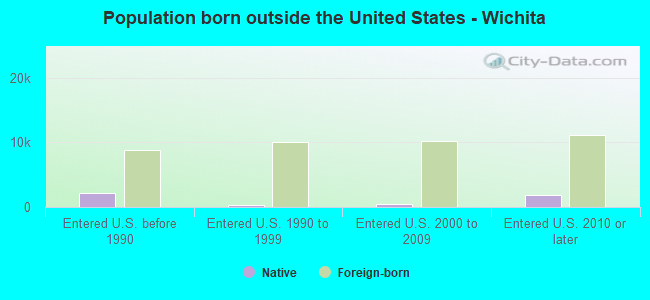
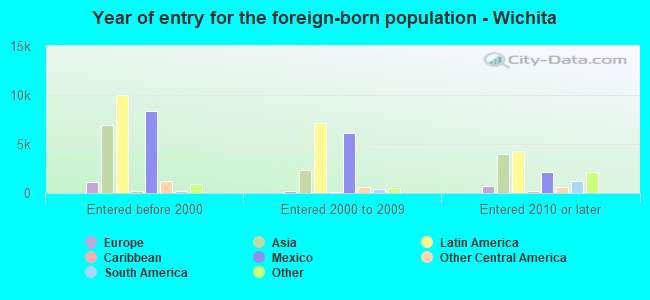
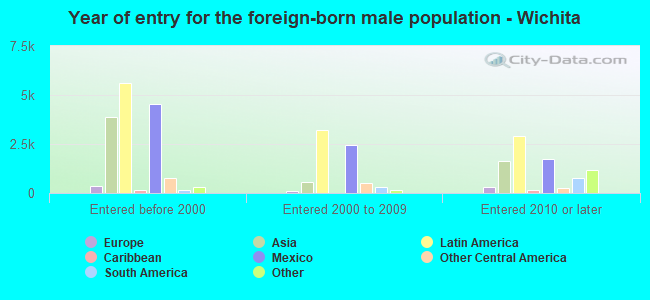
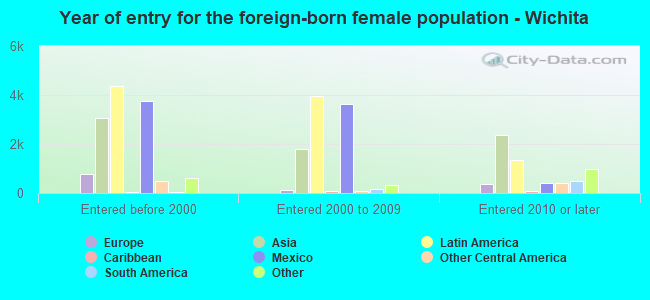
Foreign-born residents in Wichita 40,116 residents are foreign born (5.1% Latin America , 3.6% Asia ).
This city:
10.1%Kansas:
7.1%
Marital status for residents in Wichita Marital status - White (Caucasian) population 15 years and over
Males 33.5% Never married49.8% Now married1.5% Separated2.9% Widowed12.4% DivorcedFemales 27.0% Never married45.8% Now married2.3% Separated9.6% Widowed15.3% DivorcedWomen who gave birth in the past 12 months Now married:
83.4% (1,254)Unmarried:
16.6% (249)
Women who did not give birth in the past 12 months Now married:
43.5% (24,956)Unmarried:
56.5% (32,404)
Marital status - Black or African American population 15 years and over
Males 47.1% Never married32.7% Now married4.1% Separated2.2% Widowed13.9% DivorcedFemales 57.8% Never married19.7% Now married1.6% Separated8.6% Widowed12.2% DivorcedWomen who gave birth in the past 12 months Now married:
44.8% (271)Unmarried:
55.2% (334)
Women who did not give birth in the past 12 months Now married:
16.0% (1,668)Unmarried:
84.0% (8,741)
Marital status - American Indian / Alaska Native population 15 years and over
Males 39.8% Never married42.2% Now married0.4% Separated1.6% Widowed15.9% DivorcedFemales 46.9% Never married31.9% Now married5.2% Separated3.2% Widowed12.8% DivorcedWomen who gave birth in the past 12 months Now married:
18.6% (9)Unmarried:
81.4% (40)
Women who did not give birth in the past 12 months Now married:
35.9% (462)Unmarried:
64.1% (825)
Marital status - Asian population 15 years and over
Males 46.1% Never married43.3% Now married0.0% Separated1.7% Widowed8.9% DivorcedFemales 33.4% Never married47.2% Now married0.0% Separated3.9% Widowed15.6% DivorcedWomen who gave birth in the past 12 months Now married:
27.9% (119)Unmarried:
72.1% (307)
Women who did not give birth in the past 12 months Now married:
41.4% (2,223)Unmarried:
58.6% (3,141)
Marital status - Native Hawaiian / Pacific Islander population 15 years and over
Males 77.6% Never married22.4% Now married0.0% Separated0.0% Widowed0.0% DivorcedFemales 39.0% Never married39.0% Now married0.0% Separated22.0% Widowed0.0% DivorcedWomen who did not give birth in the past 12 months Now married:
0.0% (0)Unmarried:
100.0% (17)
Marital status - Other race population 15 years and over
Males 51.1% Never married44.3% Now married0.0% Separated2.7% Widowed1.9% DivorcedFemales 36.0% Never married44.2% Now married2.2% Separated5.0% Widowed12.6% DivorcedWomen who gave birth in the past 12 months Now married:
25.9% (52)Unmarried:
74.1% (149)
Women who did not give birth in the past 12 months Now married:
48.8% (2,638)Unmarried:
51.2% (2,767)
Marital status - Two or more races population 15 years and over
Males 53.7% Never married33.2% Now married3.2% Separated1.6% Widowed8.4% DivorcedFemales 47.9% Never married38.6% Now married0.1% Separated5.2% Widowed8.1% DivorcedWomen who gave birth in the past 12 months Now married:
52.1% (294)Unmarried:
47.9% (270)
Women who did not give birth in the past 12 months Now married:
30.9% (3,705)Unmarried:
69.1% (8,296)
Marital status - White alone, not Hispanic / Latino population 15 years and over
Males 32.6% Never married50.5% Now married1.4% Separated3.0% Widowed12.4% DivorcedFemales 25.6% Never married46.4% Now married2.1% Separated10.1% Widowed15.8% DivorcedWomen who gave birth in the past 12 months Now married:
83.4% (1,254)Unmarried:
16.6% (249)
Women who did not give birth in the past 12 months Now married:
44.2% (23,085)Unmarried:
55.8% (29,094)
Marital status - Hispanic or Latino population 15 years and over
Males 48.6% Never married41.0% Now married0.9% Separated1.0% Widowed8.5% DivorcedFemales 45.6% Never married40.3% Now married2.2% Separated4.8% Widowed7.0% DivorcedWomen who gave birth in the past 12 months Now married:
51.8% (309)Unmarried:
48.2% (288)
Women who did not give birth in the past 12 months Now married:
38.1% (6,828)Unmarried:
61.9% (11,081)
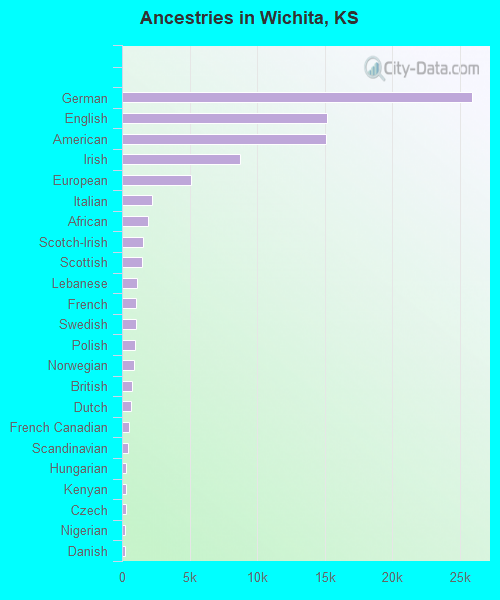
Ancestries in Wichita
25,888 13.8% German15,205 8.1% English15,109 8.0% American8,754 4.7% Irish5,075 2.7% European2,219 1.2% Italian1,915 1.0% African1,549 0.8% Scotch-Irish1,471 0.8% Scottish1,079 0.6% Lebanese1,038 0.6% French1,013 0.5% Swedish943 0.5% Polish867 0.5% Norwegian768 0.4% British687 0.4% Dutch492 0.3% French Canadian454 0.2% Scandinavian309 0.2% Hungarian279 0.1% Kenyan271 0.1% Czech253 0.1% Nigerian241 0.1% Danish213 0.1% Welsh198 0.1% Moroccan198 0.1% Ghanaian176 0.09% Iranian159 0.08% Bulgarian146 0.08% Russian143 0.08% Swiss135 0.07% Portuguese119 0.06% Pennsylvania German116 0.06% Eastern European115 0.06% Northern European111 0.06% Greek108 0.06% Canadian101 0.05% Ukrainian99 0.05% Czechoslovakian97 0.05% Jamaican93 0.05% Belgian81 0.04% Egyptian80 0.04% Syrian79 0.04% Haitian76 0.04% Sudanese72 0.04% Arab69 0.04% Cajun64 0.03% Slovak62 0.03% Palestinian60 0.03% Celtic60 0.03% Brazilian58 0.03% German Russian55 0.03% Croatian54 0.03% Jordanian46 0.02% Romanian42 0.02% Austrian41 0.02% Ethiopian41 0.02% Ugandan39 0.02% Icelander25 0.01% Turkish23 0.01% Armenian23 0.01% New Zealander22 0.01% Zimbabwean21 0.01% South African17 0.01% Finnish14 0.01% Estonian13 0.01% Luxembourger12 0.01% Slovene12 0.01% Latvian12 0.01% Australian10 0.01% Yugoslavian
Geographical mobility in Wichita Same house 1 year ago 223,326 86.6% White (Caucasian)31,564 84.8% Black or African American4,527 90.0% American Indian / Alaska Native14,979 82.3% Asian63 49.3% Native Hawaiian / Pacific Islander22,370 87.2% Other race41,093 78.7% Two or more races206,620 86.3% White alone, not Hispanic / Latino60,858 88.0% Hispanic or LatinoMoved within same county 22,203 8.6% White / Caucasian3,280 8.8% Black or African American267 5.3% American Indian / Alaska Native2,003 11.0% Asian18 14.1% Native Hawaiian / Pacific Islander2,503 9.8% Other race8,200 15.7% Two or more races20,962 8.8% White alone, not Hispanic / Latino5,195 7.5% Hispanic or LatinoMoved within same state 6,526 2.5% White / Caucasian746 2.0% Black or African American886 4.9% Asian397 1.5% Other race623 1.2% Two or more races6,148 2.6% White alone, not Hispanic / Latino1,096 1.6% Hispanic or LatinoMoved from different state 5,236 2.0% White / Caucasian1,421 3.8% Black or African American73 1.5% American Indian / Alaska Native89 0.5% Asian220 0.9% Other race1,518 2.9% Two or more races5,112 2.1% White alone, not Hispanic / Latino689 1.0% Hispanic or LatinoMoved from abroad 462 0.2% White194 0.5% Black or African American162 3.2% American Indian / Alaska Native245 1.3% Asian33 25.7% Native Hawaiian / Pacific Islander92 0.4% Other race764 1.5% Two or more races462 0.2% White alone, not Hispanic / Latino1,280 1.9% Hispanic or Latino
Children Nativity (place of birth) in Wichita
Children under 6 years - Living with two parents Both parents native 12,175 100.0% NativeBoth parents foreign-born 1,988 92.3% Native165 7.7% Foreign-bornOne native, one foreign-born parent 1,246 100.0% NativeChildren under 6 years - Living with one parent Native parent 10,509 100.0% NativeForeign-born parent 562 100.0% NativeChildren 6 to 17 years - Living with two parents Both parents native 30,406 99.8% Native57 0.2% Foreign-bornBoth parents foreign-born 4,508 78.4% Native1,241 21.6% Foreign-bornOne native, one foreign-born parent 4,073 100.0% NativeChildren 6 to 17 years - Living with one parent Native parent 19,996 100.0% NativeForeign-born parent 3,022 52.3% Native2,757 47.7% Foreign-born
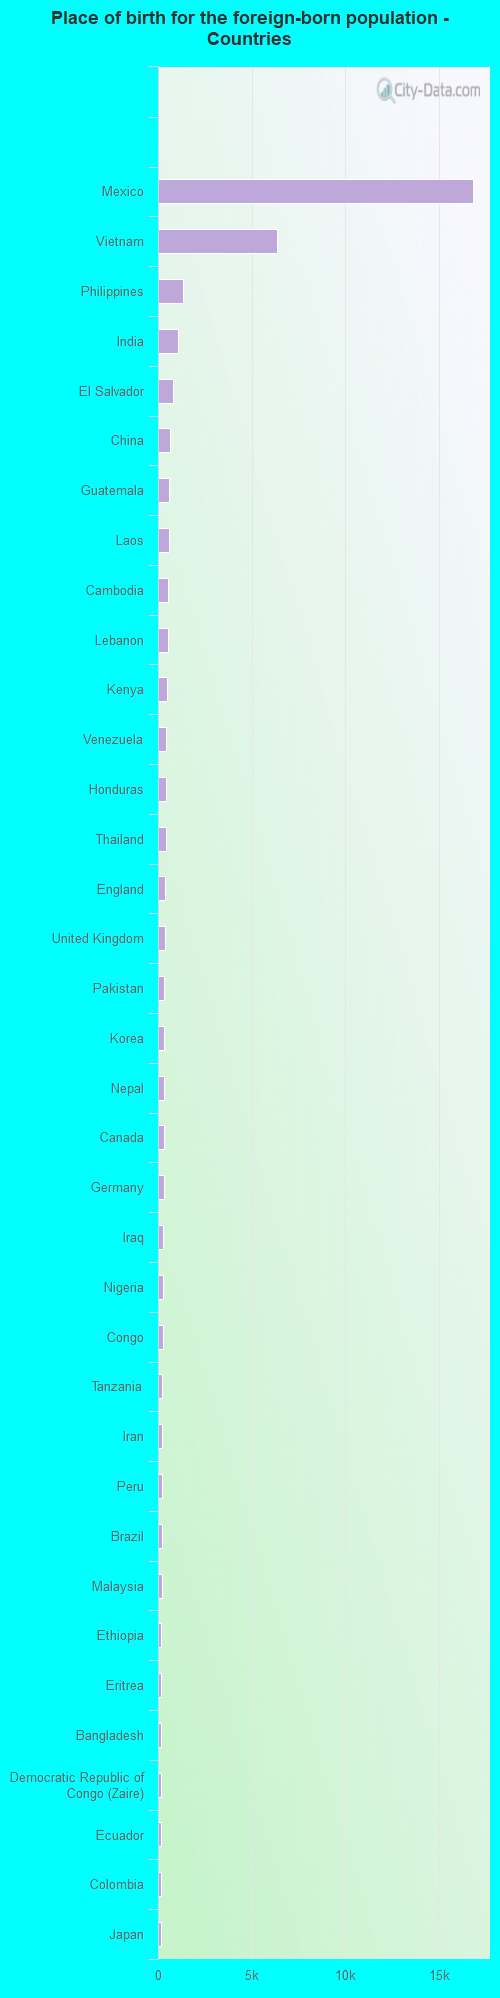
Place of birth for residents in Wichita 20,841 Americas20,534 Latin America18,951 Central America14,632 Asia9,636 South Eastern Asia2,486 Africa2,245 South Central Asia2,098 Europe1,351 Eastern Asia1,350 South America1,326 Western Asia1,198 Eastern Africa858 China811 Northern Europe672 Eastern Europe490 Western Europe425 Middle Africa423 Western Africa384 Northern Africa306 Northern America232 Caribbean124 Southern Europe56 Oceania27 Australia and New Zealand Subregion16,856 Mexico6,372 Vietnam1,343 Philippines1,078 India816 El Salvador635 China607 Guatemala592 Laos558 Cambodia524 Lebanon467 Kenya425 Venezuela419 Honduras413 Thailand379 England354 United Kingdom340 Pakistan335 Korea328 Nepal306 Canada301 Germany288 Iraq257 Nigeria245 Congo223 Tanzania202 Iran196 Peru195 Brazil191 Malaysia179 Ethiopia176 Eritrea173 Bangladesh165 Democratic Republic of Congo (Zaire)161 Ecuador159 Colombia157 Japan146 Bulgaria134 Taiwan122 Uganda120 Kuwait118 Costa Rica112 Sri Lanka110 Egypt106 Morocco101 Netherlands101 Turkey100 Jordan94 Panama91 Romania88 Hong Kong82 Burma (Myanmar)77 Syria76 Sudan75 Saudi Arabia75 Italy71 Dominican Republic69 France67 Ghana62 Algeria62 Argentina61 Togo57 Ukraine55 Cuba48 Jamaica46 Chile45 Indonesia42 Poland38 Nicaragua33 Russia29 Spain29 Zimbabwe28 Marshall Islands27 Haiti27 Hungary23 Norway20 Ireland19 Greece18 Scotland17 Austria15 Australia15 Czechoslovakia14 Cameroon14 United Arab Emirates14 Bosnia and Herzegovina13 Croatia12 New Zealand11 Trinidad and Tobago11 Singapore8 Israel8 Moldova7 Armenia5 Kazakhstan4 Bahamas4 Sweden
Grandparents responsible for own grandchildren in Wichita
Grandparents (30 to 59 years) White / Caucasian 1,423 49.0% Responsible for grandchildren1,483 51.0% Not responsible for grandchildrenBlack or African American 278 61.5% Responsible for grandchildren174 38.5% Not responsible for grandchildrenAmerican Indian / Alaska Native 5 14.2% Responsible for grandchildren28 85.8% Not responsible for grandchildrenAsian 23 100.0% Not responsible for grandchildrenOther race 114 26.4% Responsible for grandchildren318 73.6% Not responsible for grandchildrenTwo or more races 233 53.0% Responsible for grandchildren207 47.0% Not responsible for grandchildrenWhite alone, not Hispanic / Latino 1,262 46.7% Responsible for grandchildren1,438 53.3% Not responsible for grandchildrenHispanic or Latino 407 43.9% Responsible for grandchildren519 56.1% Not responsible for grandchildrenGrandparents (60 years and over) White / Caucasian 314 17.7% Responsible for grandchildren1,457 82.3% Not responsible for grandchildrenBlack or African American 349 69.3% Responsible for grandchildren155 30.7% Not responsible for grandchildrenAmerican Indian / Alaska Native 14 100.0% Not responsible for grandchildrenAsian 91 18.7% Responsible for grandchildren395 81.3% Not responsible for grandchildrenOther race 44 13.7% Responsible for grandchildren279 86.3% Not responsible for grandchildrenTwo or more races 153 93.1% Responsible for grandchildren11 6.9% Not responsible for grandchildrenWhite alone, not Hispanic / Latino 314 17.7% Responsible for grandchildren1,457 82.3% Not responsible for grandchildrenHispanic or Latino 92 16.5% Responsible for grandchildren462 83.5% Not responsible for grandchildren
Zip codes: 67202 , 67203 , 67209 , 67211 , 67212 , 67213 , 67214 , 67215 , 67218 , 67228 , 67235 , 67260.