Races in Wilkins Township, Pennsylvania (PA) Detailed Stats
Ancestries, Foreign-born residents, place of birth

Recent posts about races in Wilkins Township, Pennsylvania on our local forum with over 2,400,000 registered users:
 | What is going on at the monroeville mall? (25 replies) |
| Report on thought process behind African Americans' decision to stay, leave or return to the region. (6 replies) |
| Suburb of the week: Turtle Creek (35 replies) |
| Turtle Creek/Wilkins Township? (2 replies) |
| Ridiculously Priced Pittsburgh Properties (208 replies) |
| Black Middle Class Surrounded by Crime (37 replies) |
4.5% of Wilkins Township, PA residents are foreign-born (2.3% born in Europe, 1.4% born in Asia, 0.6% born in Latin America), which is 54.2% less than the foreign-born rate of 7.0% across the entire state of Pennsylvania.
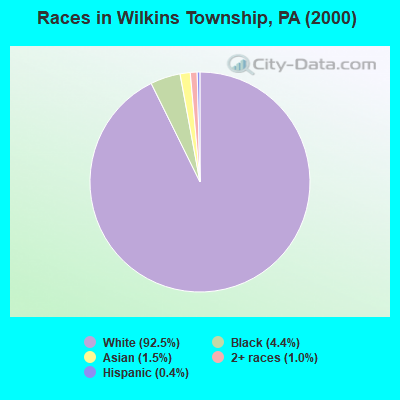
Race distribution in Wilkins Township

- 6,39892.5%White alone
- 3034.4%Black alone
- 1051.5%Asian alone
- 661.0%Two or more races
- 310.4%Hispanic
- 60.09%Other race alone
- 60.09%American Indian alone
- 20.03%Native Hawaiian and Other
Pacific Islander alone
2000
2022
-
- 10,322,45584.1%White alone
- 1,202,4379.8%Black alone
- 394,0883.2%Hispanic
- 218,2961.8%Asian alone
- 113,0970.9%Two or more races
- 13,0860.1%Other race alone
- 14,9040.1%American Indian alone
- 2,6910.02%Native Hawaiian and Other
Pacific Islander alone

-
- 9,487,22873.1%White alone
- 1,311,58110.1%Black alone
- 1,115,9978.6%Hispanic
- 493,9423.8%Two or more races
- 487,1243.8%Asian alone
- 63,5820.5%Other race alone
- 10,1300.08%American Indian alone
- 2,4240.02%Native Hawaiian and Other
Pacific Islander alone

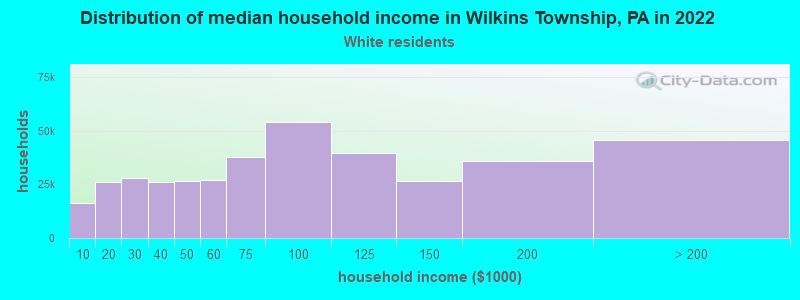
Income and house value in Wilkins Township
- Median household income in 2022
- $70,277White non-Hispanic householders
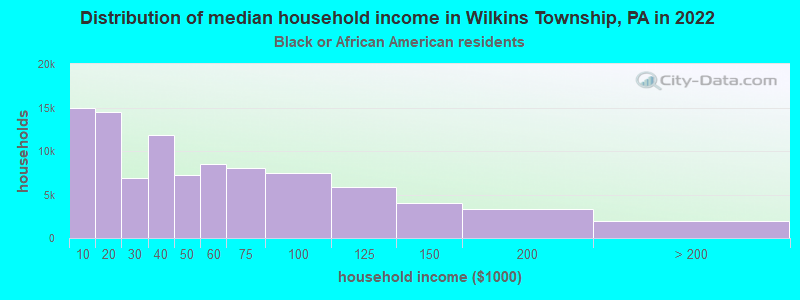
- $61,920Black householders
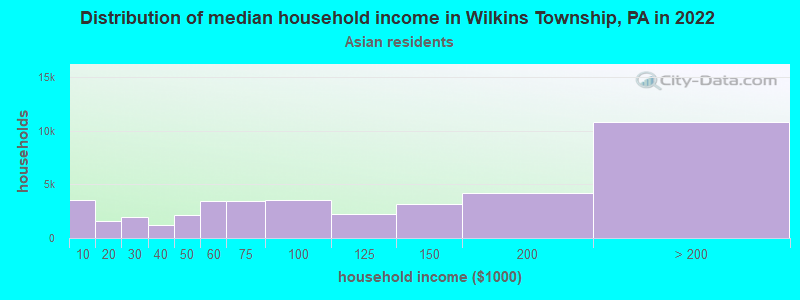
- over $200,000Asian householders
- $48,633Some other race householders
- $111,413Two or more races householders
- $116,116Hispanic or Latino race householders
- Median 2022 house value
- $188,245White Non-Hispanic householders
- $233,913Black or African American householders
- $298,697Asian householders
- $199,131Two or more races householders
- $172,580Hispanic or Latino householders
Household income for White non-Hispanic householders
Household income for Black householders
Household income for Asian householders
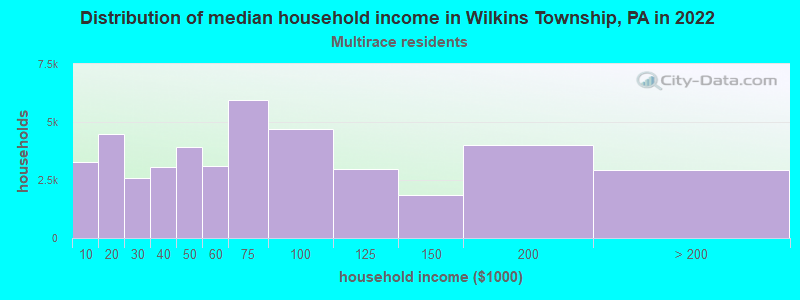
Household income for Two or more races householders
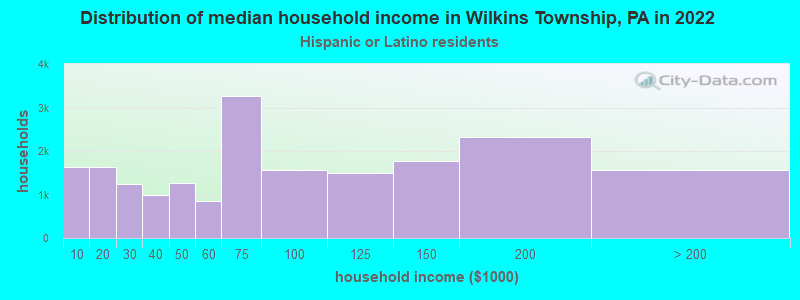
Household income for Hispanic or Latino race householders
Foreign-born residents in Wilkins Township
314 residents are foreign born (2.3% Europe, 1.4% Asia, 0.6% Latin America).
| This city: | 4.5% |
| Pennsylvania: | 4.1% |
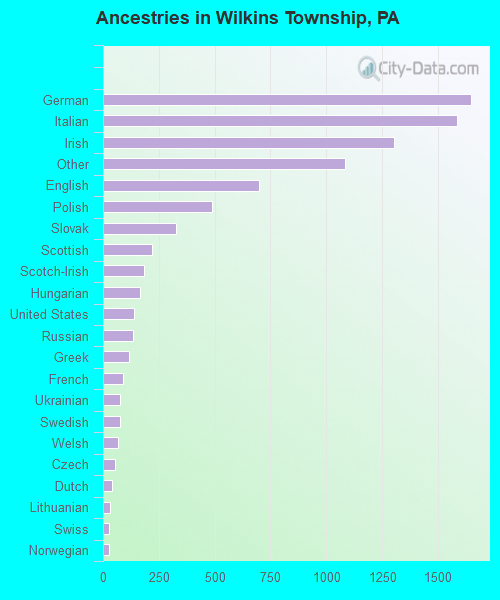
Ancestries in Wilkins Township

- 1,64719.1%German
- 1,58418.4%Italian
- 1,30215.1%Irish
- 1,08512.6%Other
- 6998.1%English
- 4905.7%Polish
- 3283.8%Slovak
- 2192.5%Scottish
- 1832.1%Scotch-Irish
- 1671.9%Hungarian
- 1381.6%United States
- 1361.6%Russian
- 1151.3%Greek
- 891.0%French
- 770.9%Ukrainian
- 740.9%Swedish
- 670.8%Welsh
- 550.6%Czech
- 410.5%Dutch
- 300.3%Lithuanian
- 280.3%Swiss
- 250.3%Norwegian
- 120.1%French Canadian
- 70.08%Danish
- 60.07%Arab
Zip codes: 15145.