Races in Willoughby, Ohio (OH) Detailed Stats
Ancestries, Foreign-born residents, place of birth
Settings
X


Recent posts about races in Willoughby, Ohio on our local forum with over 2,400,000 registered users:
 | Ethnic European Restaurants in Cleveland (4 replies) |
| How to retire in Cleveland/NE Ohio CHEAPLY (78 replies) |
| Visiting Cleveland: a couple of questions (38 replies) |
| Eastlake vs Amhurst? please rate and compare... (28 replies) |
| Retire in Cleveland! (63 replies) |
| Cleveland's Real Estate Market is driving us crazy. (24 replies) |
Latest news about races in Willoughby, OH collected exclusively by city-data.com from local newspapers, TV, and radio stations
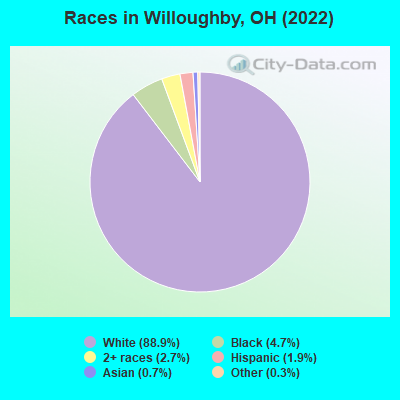
According to 2022 data, the most numerous races in Willoughby, OH are White alone (21,144 residents), Black alone (1,115 residents), and Two or more races (644 residents). 93.7% of Willoughby residents speak English at home. 6.0% of Willoughby, OH residents are foreign-born (4.8% born in Europe, 0.6% born in Asia), which is 33.7% greater than the foreign-born rate of 4.0% across the entire state of Ohio.
Race distribution in Willoughby
2000
2022

- 21,69595.9%White alone
- 2581.1%Black alone
- 2591.1%Asian alone
- 1870.8%Two or more races
- 1610.7%Hispanic
- 370.2%American Indian alone
- 120.05%Other race alone
- 120.05%Native Hawaiian and Other
Pacific Islander alone

-
- 21,14488.9%White alone
- 1,1154.7%Black alone
- 6442.7%Two or more races
- 4551.9%Hispanic
- 1590.7%Asian alone
- 720.3%Other race alone
2000
2022
-
- 9,538,11184.0%White alone
- 1,290,66211.4%Black alone
- 217,1231.9%Hispanic
- 137,7701.2%Two or more races
- 131,6701.2%Asian alone
- 21,9850.2%American Indian alone
- 13,4830.1%Other race alone
- 2,3360.02%Native Hawaiian and Other
Pacific Islander alone

-
- 8,948,79376.1%White alone
- 1,401,40311.9%Black alone
- 529,2914.5%Two or more races
- 517,2324.4%Hispanic
- 293,3872.5%Asian alone
- 52,8050.4%Other race alone
- 9,7850.08%American Indian alone
- 3,3620.03%Native Hawaiian and Other
Pacific Islander alone

Income and house value in Willoughby
- Median household income in 2022
- $71,264White non-Hispanic householders
- $40,322Black householders
- $129,370Asian householders
- $89,819Some other race householders
- $77,588Two or more races householders
- $69,490Hispanic or Latino race householders
- Median 2022 house value
- $217,175White Non-Hispanic householders
- $203,686Black or African American householders
- $109,599American Indian or Alaska Native householders
- $341,106Asian householders
- $189,691Some other race householders
- $257,811Two or more races householders
- $435,530Hispanic or Latino householders
Household income for White non-Hispanic householders

Household income for Black householders

Household income for Asian householders

Household income for Some other race householders

Household income for Two or more races householders

Household income for Hispanic or Latino race householders

Median age by race in Willoughby
- 45.9Median age for White residents
- 44.2Males
- 47.6Females
- 45.6Median age for Black or African American residents
- 41.8Males
- 50.0Females
- -676,818,950.3Median age for American Indian / Alaska Native residents
- -685,185,184.5Males
- -658,163,264.6Females
- 71.2Median age for Asian residents
- 65.0Males
- 74.5Females
- -800,387,596.1Median age for Native Hawaiian / Pacific Islander residents
- -750,242,953.6Males
- -805,394,989.6Females
- 15.1Median age for Other race residents
- 7.5Males
- 58.3Females
- 24.8Median age for Two or more races residents
- 23.3Males
- 32.6Females
- 45.7Median age for White alone residents
- 44.2Males
- 47.5Females
- 30.5Median age for Hispanic or Latino residents
- 23.5Males
- 59.0Females
Owner/renter occupied households by race in Willoughby
- House owners and renters - White residents
- 7,03468.5%Owner occupied
- 3,23931.5%Renter occupied
- House owners and renters - Black or African American residents
- 20435.8%Owner occupied
- 36564.2%Renter occupied
- House owners and renters - Asian residents
- 11187.5%Owner occupied
- 1612.5%Renter occupied
- House owners and renters - Other race residents
- 119100.0%Owner occupied
- House owners and renters - Two or more races residents
- 16063.4%Owner occupied
- 9336.6%Renter occupied
- House owners and renters - White alone residents
- 7,04568.1%Owner occupied
- 3,29531.9%Renter occupied
- House owners and renters - Hispanic or Latino residents
- 12987.2%Owner occupied
- 1912.8%Renter occupied
Language usage in Willoughby
- English speakers - Total
- 93.7% of residents of Willoughby speak English at home.
- 0.6% of residents speak Spanish at home
- 10576.6%Speak English very well
- 3223.4%Speak English less than very well
- 5.4% of residents speak other language at home
- 80765.1%Speak English very well
- 43234.9%Speak English less than very well
- English speakers - Born in the United States
- 96.0% of residents of Willoughby speak English at home.
- 2.1% of residents speak Spanish at home
- 3555.6%Speak English very well
- 2844.4%Speak English less than very well
- 2.2% of residents speak other language at home
- 65100.0%Speak English very well
- English speakers - Native, born elsewhere
- 71.1% of residents of Willoughby speak English at home.
- 12.2% of residents speak other language at home
- 11100.0%Speak English very well
- English speakers - Foreign-born
- 21.9% of residents of Willoughby speak English at home.
- 76.5% of residents speak other language at home
- 50558.8%Speak English very well
- 35441.2%Speak English less than very well
White (Caucasian) - Speak only English
| Native: | 98.9% (19,344) |
| Foreign-born: | 23.0% (158) |
White (Caucasian) - Speak another language
| Native: | 1.3% (246) |
| Foreign-born: | 74.5% (512) |
Two or more races - Speak only English
| Native: | 83.6% (619) |
| Foreign-born: | 58.8% (88) |
Two or more races - Speak another language
| Native: | 12.1% (89) |
| Foreign-born: | 9.9% (15) |
White alone - Speak only English
| Native: | 98.5% (19,244) |
| Foreign-born: | 20.5% (162) |
White alone - Speak another language
| Native: | 1.5% (290) |
| Foreign-born: | 77.0% (608) |
Hispanic or Latino - Speak only English
| Native: | 67.9% (285) |
| Foreign-born: | 31.7% (12) |
Hispanic or Latino - Speak another language
| Native: | 19.1% (80) |
| Foreign-born: | 77.5% (30) |
Foreign-born residents in Willoughby
1,434 residents are foreign born (4.8% Europe, 0.6% Asia).
| This city: | 6.0% |
| Ohio: | 4.9% |


Marital status for residents in Willoughby
Marital status - White (Caucasian) population 15 years and over
- Males
- 38.7%Never married
- 48.1%Now married
- 0.3%Separated
- 3.5%Widowed
- 9.3%Divorced
- Females
- 31.1%Never married
- 38.9%Now married
- 0.3%Separated
- 11.9%Widowed
- 17.7%Divorced
Women who gave birth in the past 12 months
| Now married: | 83.2% (90) |
| Unmarried: | 16.8% (18) |
Women who did not give birth in the past 12 months
| Now married: | 34.3% (1,614) |
| Unmarried: | 65.7% (3,097) |
Marital status - Black or African American population 15 years and over
- Males
- 46.1%Never married
- 36.0%Now married
- 3.1%Separated
- 0.0%Widowed
- 14.7%Divorced
- Females
- 48.1%Never married
- 23.7%Now married
- 5.4%Separated
- 11.9%Widowed
- 10.9%Divorced
Women who gave birth in the past 12 months
| Now married: | 100.0% (16) |
| Unmarried: | 0.0% (0) |
Women who did not give birth in the past 12 months
| Now married: | 27.3% (107) |
| Unmarried: | 72.7% (286) |
Marital status - Asian population 15 years and over
- Males
- 28.7%Never married
- 71.3%Now married
- 0.0%Separated
- 0.0%Widowed
- 0.0%Divorced
- Females
- 45.5%Never married
- 54.5%Now married
- 0.0%Separated
- 0.0%Widowed
- 0.0%Divorced
Women who did not give birth in the past 12 months
| Now married: | 0.0% (0) |
| Unmarried: | 100.0% (7) |
Marital status - Other race population 15 years and over
- Males
- 0.0%Never married
- 100.0%Now married
- 0.0%Separated
- 0.0%Widowed
- 0.0%Divorced
- Females
- 0.0%Never married
- 100.0%Now married
- 0.0%Separated
- 0.0%Widowed
- 0.0%Divorced
Women who did not give birth in the past 12 months
| Now married: | 100.0% (24) |
| Unmarried: | 0.0% (0) |
Marital status - Two or more races population 15 years and over
- Males
- 84.7%Never married
- 14.8%Now married
- 0.0%Separated
- 0.0%Widowed
- 0.5%Divorced
- Females
- 59.3%Never married
- 16.1%Now married
- 0.0%Separated
- 5.5%Widowed
- 19.1%Divorced
Women who gave birth in the past 12 months
| Now married: | 0.0% (0) |
| Unmarried: | 100.0% (13) |
Women who did not give birth in the past 12 months
| Now married: | 4.2% (7) |
| Unmarried: | 95.8% (148) |
Marital status - White alone, not Hispanic / Latino population 15 years and over
- Males
- 38.6%Never married
- 48.2%Now married
- 0.3%Separated
- 3.6%Widowed
- 9.3%Divorced
- Females
- 31.1%Never married
- 39.0%Now married
- 0.3%Separated
- 11.9%Widowed
- 17.7%Divorced
Women who gave birth in the past 12 months
| Now married: | 83.2% (92) |
| Unmarried: | 16.8% (19) |
Women who did not give birth in the past 12 months
| Now married: | 34.1% (1,606) |
| Unmarried: | 65.9% (3,097) |
Marital status - Hispanic or Latino population 15 years and over
- Males
- 74.6%Never married
- 16.9%Now married
- 0.0%Separated
- 0.0%Widowed
- 8.5%Divorced
- Females
- 19.9%Never married
- 54.7%Now married
- 0.0%Separated
- 6.5%Widowed
- 18.9%Divorced
Women who did not give birth in the past 12 months
| Now married: | 50.5% (63) |
| Unmarried: | 49.5% (62) |
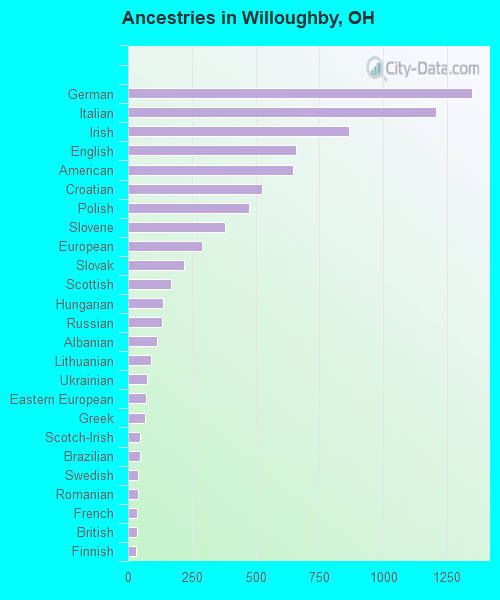
Ancestries in Willoughby

- 1,34814.2%German
- 1,20812.7%Italian
- 8669.1%Irish
- 6596.9%English
- 6456.8%American
- 5255.5%Croatian
- 4735.0%Polish
- 3814.0%Slovene
- 2903.0%European
- 2182.3%Slovak
- 1701.8%Scottish
- 1371.4%Hungarian
- 1321.4%Russian
- 1151.2%Albanian
- 900.9%Lithuanian
- 730.8%Ukrainian
- 720.8%Eastern European
- 670.7%Greek
- 490.5%Scotch-Irish
- 470.5%Brazilian
- 400.4%Swedish
- 390.4%Romanian
- 370.4%French
- 360.4%British
- 330.3%Finnish
- 290.3%Scandinavian
- 260.3%Macedonian
- 170.2%Swiss
- 160.2%Dutch
- 130.1%Canadian
- 130.1%Yugoslavian
- 110.1%Danish
- 110.1%Turkish
- 100.1%Norwegian
- 90.09%Slavic
- 80.08%Welsh
- 70.07%Lebanese
- 60.06%Luxembourger
Geographical mobility in Willoughby

- Same house 1 year ago
- 18,36787.5%White (Caucasian)
- 88176.6%Black or African American
- 163100.0%Asian
- 11583.5%Other race
- 90190.3%Two or more races
- 18,47787.7%White alone, not Hispanic / Latino
- 32772.9%Hispanic or Latino

-
- Moved within same county
- 1,3816.6%White / Caucasian
- 887.6%Black or African American
- 646.5%Two or more races
- 1,3436.4%White alone, not Hispanic / Latino
- 7516.8%Hispanic or Latino

-
- Moved within same state
- 1,2385.9%White / Caucasian
- 15913.8%Black or African American
- 2820.2%Other race
- 232.3%Two or more races
- 1,2335.9%White alone, not Hispanic / Latino
- 449.8%Hispanic or Latino

-
- Moved from different state
- 1030.5%White / Caucasian
- 20.2%Black or African American
- 1070.5%White alone, not Hispanic / Latino

-
- Moved from abroad
- 210.1%White
- 564.8%Black or African American
- 210.1%White alone, not Hispanic / Latino

Children Nativity (place of birth) in Willoughby
Place of birth for residents in Willoughby
![Place of birth for the foreign-born population - Regions]()
- 1,176Europe
- 996Eastern Europe
- 150Asia
- 87Southern Europe
- 81Americas
- 79Eastern Asia
- 79China
- 53Northern America
- 46Western Europe
- 28Latin America
- 28South America
- 26Northern Europe
- 26Western Asia
- 25Africa
- 25Eastern Africa
- 23South Eastern Asia
- 20South Central Asia

![Place of birth for the foreign-born population - Countries]()
- 333Bosnia and Herzegovina
- 164Croatia
- 129Russia
- 104Albania
- 104Poland
- 77Italy
- 54China
- 53Ukraine
- 53Canada
- 43Lithuania
- 29Romania
- 28Brazil
- 25North Macedonia (Macedonia)
- 25Taiwan
- 25Kenya
- 23Austria
- 23Philippines
- 20India
- 17Syria
- 12Germany
- 10Scotland
- 10Netherlands
- 9England
- 9Spain
- 9Turkey
- 7United Kingdom
- 3Czechoslovakia

Grandparents responsible for own grandchildren in Willoughby
Zip codes: 44094.