Races in Wilton Manors, Florida (FL) Detailed Stats
Data:
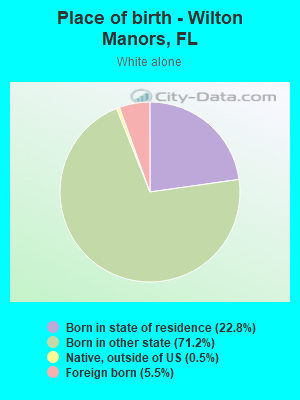
Races - White alone (%)
Races - White alone (% change since 2000)
Races - Black alone (%)
Races - Black alone (% change since 2000)
Races - American Indian alone (%)
Races - American Indian alone (% change since 2000)
Races - Asian alone (%)
Races - Asian alone (% change since 2000)
Races - Hispanic (%)
Races - Hispanic (% change since 2000)
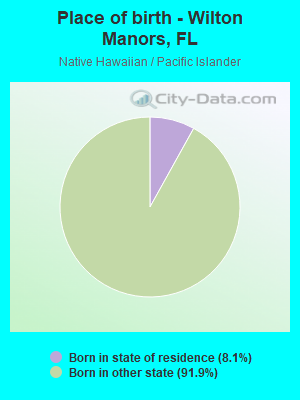
Races - Native Hawaiian and Other Pacific Islander alone (%)
Races - Native Hawaiian and Other Pacific Islander alone (% change since 2000)
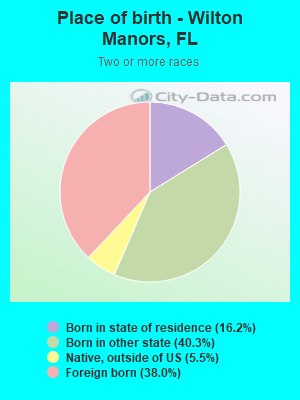
Races - Two or more races(%)
Races - Two or more races(% change since 2000)
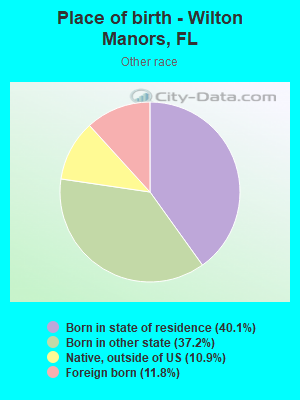
Races - Other race alone (%)
Races - Other race alone (% change since 2000)
Racial diversity
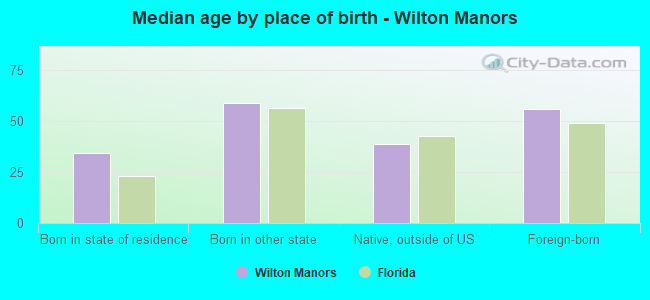
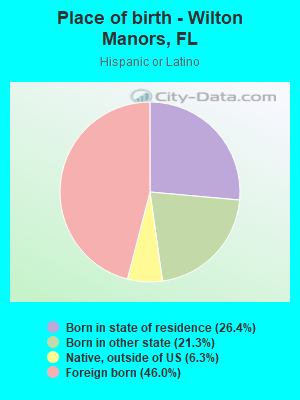
Place of birth - Born in state of residence (%)
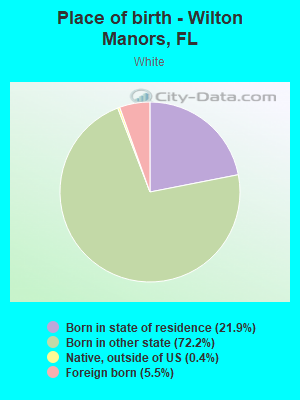
Place of birth - Born in state of residence (%) - White
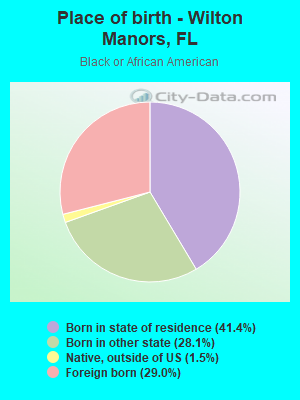
Place of birth - Born in state of residence (%) - Black or African American
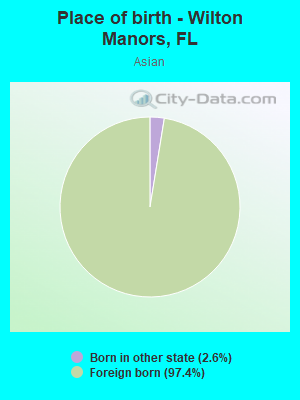
Place of birth - Born in state of residence (%) - Asian
Place of birth - Born in state of residence (%) - Hispanic or Latino
Place of birth - Born in state of residence (%) - American Indian and Alaska Native
Place of birth - Born in state of residence (%) - Multirace
Place of birth - Born in state of residence (%) - Other Race
Place of birth - Born in other state (%)
Place of birth - Born in other state (%) - White
Place of birth - Born in other state (%) - Black or African American
Place of birth - Born in other state (%) - Asian
Place of birth - Born in other state (%) - Hispanic or Latino
Place of birth - Born in other state (%) - American Indian and Alaska Native
Place of birth - Born in other state (%) - Multirace
Place of birth - Born in other state (%) - Other Race
Place of birth - Native, outside of US (%)
Place of birth - Native, outside of US (%) - White
Place of birth - Native, outside of US (%) - Black or African American
Place of birth - Native, outside of US (%) - Asian
Place of birth - Native, outside of US (%) - Hispanic or Latino
Place of birth - Native, outside of US (%) - American Indian and Alaska Native
Place of birth - Native, outside of US (%) - Multirace
Place of birth - Native, outside of US (%) - Other Race
Place of birth - Foreign born (%)
Place of birth - Foreign born (%) - White
Place of birth - Foreign born (%) - Black or African American
Place of birth - Foreign born (%) - Asian
Place of birth - Foreign born (%) - Hispanic or Latino
Place of birth - Foreign born (%) - American Indian and Alaska Native
Place of birth - Foreign born (%) - Multirace
Place of birth - Foreign born (%) - Other Race
Residents speaking English at home (%)
Residents speaking English at home - Born in the United States (%)
Residents speaking English at home - Native, born elsewhere (%)
Residents speaking English at home - Foreign born (%)
Residents speaking Spanish at home (%)
Residents speaking Spanish at home - Born in the United States (%)
Residents speaking Spanish at home - Native, born elsewhere (%)
Residents speaking Spanish at home - Foreign born (%)
Residents speaking other language at home (%)
Residents speaking other language at home - Born in the United States (%)
Residents speaking other language at home - Native, born elsewhere (%)
Residents speaking other language at home - Foreign born (%)
Marital status - Never married (%)
Marital status - Now married (%)
Marital status - Separated (%)
Marital status - Widowed (%)
Marital status - Divorced (%)
Ancestries Reported - Arab (%)
Ancestries Reported - Czech (%)
Ancestries Reported - Danish (%)
Ancestries Reported - Dutch (%)
Ancestries Reported - English (%)
Ancestries Reported - French (%)
Ancestries Reported - French Canadian (%)
Ancestries Reported - German (%)
Ancestries Reported - Greek (%)
Ancestries Reported - Hungarian (%)
Ancestries Reported - Irish (%)
Ancestries Reported - Italian (%)
Ancestries Reported - Lithuanian (%)
Ancestries Reported - Norwegian (%)
Ancestries Reported - Polish (%)
Ancestries Reported - Portuguese (%)
Ancestries Reported - Russian (%)
Ancestries Reported - Scotch-Irish (%)
Ancestries Reported - Scottish (%)
Ancestries Reported - Slovak (%)
Ancestries Reported - Subsaharan African (%)
Ancestries Reported - Swedish (%)
Ancestries Reported - Swiss (%)
Ancestries Reported - Ukrainian (%)
Ancestries Reported - United States (%)
Ancestries Reported - Welsh (%)
Ancestries Reported - West Indian (%)
Ancestries Reported - Other (%)
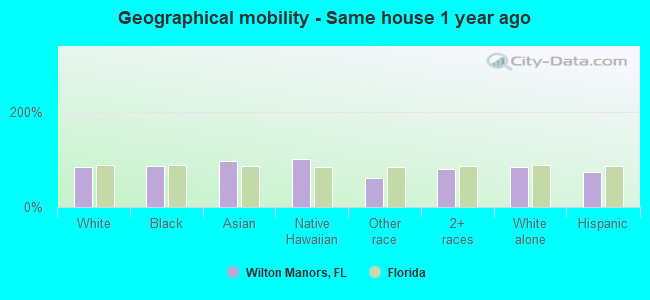
Geographical mobility - Same house 1 year ago (%)
Geographical mobility - Same house 1 year ago (%) - White
Geographical mobility - Same house 1 year ago (%) - Black or African American
Geographical mobility - Same house 1 year ago (%) - Asian
Geographical mobility - Same house 1 year ago (%) - Hispanic or Latino
Geographical mobility - Same house 1 year ago (%) - American Indian and Alaska Native
Geographical mobility - Same house 1 year ago (%) - Multirace
Geographical mobility - Same house 1 year ago (%) - Other Race
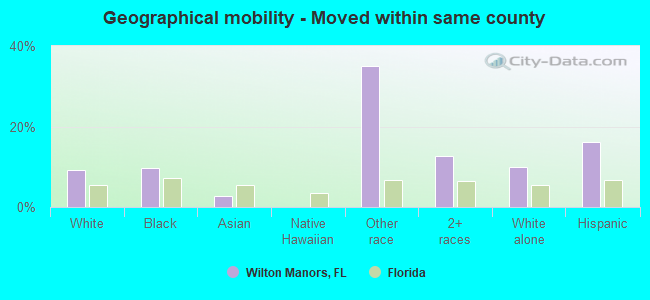
Geographical mobility - Moved within same county (%)
Geographical mobility - Moved within same county (%) - White
Geographical mobility - Moved within same county (%) - Black or African American
Geographical mobility - Moved within same county (%) - Asian
Geographical mobility - Moved within same county (%) - Hispanic or Latino
Geographical mobility - Moved within same county (%) - American Indian and Alaska Native
Geographical mobility - Moved within same county (%) - Multirace
Geographical mobility - Moved within same county (%) - Other Race
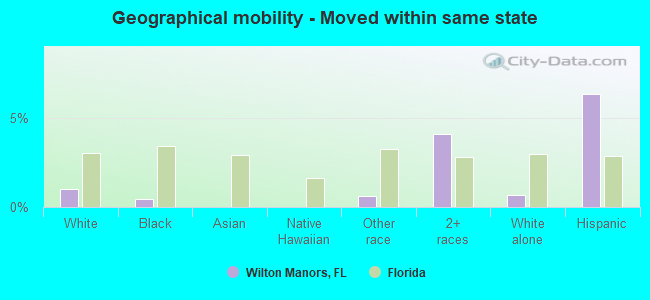
Geographical mobility - Moved from different county within same state (%)
Geographical mobility - Moved from different county within same state (%) - White
Geographical mobility - Moved from different county within same state (%) - Black or African American
Geographical mobility - Moved from different county within same state (%) - Asian
Geographical mobility - Moved from different county within same state (%) - Hispanic or Latino
Geographical mobility - Moved from different county within same state (%) - American Indian and Alaska Native
Geographical mobility - Moved from different county within same state (%) - Multirace
Geographical mobility - Moved from different county within same state (%) - Other Race
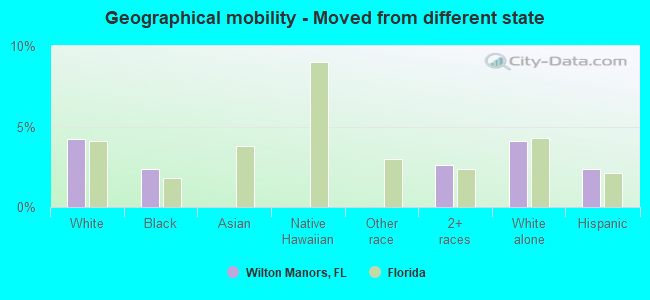
Geographical mobility - Moved from different state (%)
Geographical mobility - Moved from different state (%) - White
Geographical mobility - Moved from different state (%) - Black or African American
Geographical mobility - Moved from different state (%) - Asian
Geographical mobility - Moved from different state (%) - Hispanic or Latino
Geographical mobility - Moved from different state (%) - American Indian and Alaska Native
Geographical mobility - Moved from different state (%) - Multirace
Geographical mobility - Moved from different state (%) - Other Race
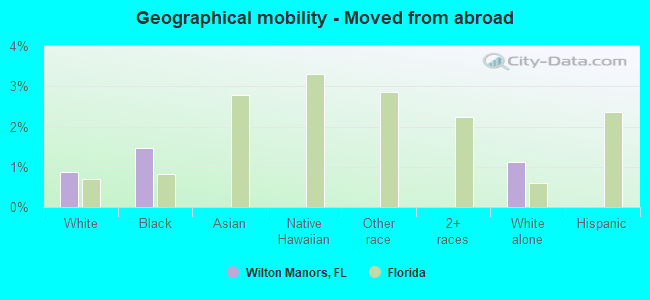
Geographical mobility - Moved from abroad (%)
Geographical mobility - Moved from abroad (%) - White
Geographical mobility - Moved from abroad (%) - Black or African American
Geographical mobility - Moved from abroad (%) - Asian
Geographical mobility - Moved from abroad (%) - Hispanic or Latino
Geographical mobility - Moved from abroad (%) - American Indian and Alaska Native
Geographical mobility - Moved from abroad (%) - Multirace
Geographical mobility - Moved from abroad (%) - Other Race
Place of birth for the foreign-born population - Ireland (%)
Place of birth for the foreign-born population - Denmark (%)
Place of birth for the foreign-born population - Norway (%)
Place of birth for the foreign-born population - Sweden (%)
Place of birth for the foreign-born population - United Kingdom (%)
Place of birth for the foreign-born population - England (%)
Place of birth for the foreign-born population - Scotland (%)
Place of birth for the foreign-born population - Other Northern Europe (%)
Place of birth for the foreign-born population - Austria (%)
Place of birth for the foreign-born population - Belgium (%)
Place of birth for the foreign-born population - France (%)
Place of birth for the foreign-born population - Germany (%)
Place of birth for the foreign-born population - Netherlands (%)
Place of birth for the foreign-born population - Switzerland (%)
Place of birth for the foreign-born population - Other Western Europe (%)
Place of birth for the foreign-born population - Greece (%)
Place of birth for the foreign-born population - Italy (%)
Place of birth for the foreign-born population - Portugal (%)
Place of birth for the foreign-born population - Spain (%)
Place of birth for the foreign-born population - Other Southern Europe (%)
Place of birth for the foreign-born population - Albania (%)
Place of birth for the foreign-born population - Belarus (%)
Place of birth for the foreign-born population - Bosnia and Herzegovina (%)
Place of birth for the foreign-born population - Bulgaria (%)
Place of birth for the foreign-born population - Croatia (%)
Place of birth for the foreign-born population - Czechoslovakia (%)
Place of birth for the foreign-born population - Hungary (%)
Place of birth for the foreign-born population - Latvia (%)
Place of birth for the foreign-born population - Lithuania (%)
Place of birth for the foreign-born population - North Macedonia (Macedonia) (%)
Place of birth for the foreign-born population - Moldova (%)
Place of birth for the foreign-born population - Poland (%)
Place of birth for the foreign-born population - Romania (%)
Place of birth for the foreign-born population - Russia (%)
Place of birth for the foreign-born population - Serbia (%)
Place of birth for the foreign-born population - Ukraine (%)
Place of birth for the foreign-born population - Other Eastern Europe (%)
Place of birth for the foreign-born population - China (%)
Place of birth for the foreign-born population - Hong Kong (%)
Place of birth for the foreign-born population - Taiwan (%)
Place of birth for the foreign-born population - Japan (%)
Place of birth for the foreign-born population - Korea (%)
Place of birth for the foreign-born population - Other Eastern Asia (%)
Place of birth for the foreign-born population - Afghanistan (%)
Place of birth for the foreign-born population - Bangladesh (%)
Place of birth for the foreign-born population - India (%)
Place of birth for the foreign-born population - Iran (%)
Place of birth for the foreign-born population - Kazakhstan (%)
Place of birth for the foreign-born population - Nepal (%)
Place of birth for the foreign-born population - Pakistan (%)
Place of birth for the foreign-born population - Sri Lanka (%)
Place of birth for the foreign-born population - Uzbekistan (%)
Place of birth for the foreign-born population - Other South Central Asia (%)
Place of birth for the foreign-born population - Burma (%)
Place of birth for the foreign-born population - Cambodia (%)
Place of birth for the foreign-born population - Indonesia (%)
Place of birth for the foreign-born population - Laos (%)
Place of birth for the foreign-born population - Malaysia (%)
Place of birth for the foreign-born population - Philippines (%)
Place of birth for the foreign-born population - Singapore (%)
Place of birth for the foreign-born population - Thailand (%)
Place of birth for the foreign-born population - Vietnam (%)
Place of birth for the foreign-born population - Other South Eastern Asia (%)
Place of birth for the foreign-born population - Armenia (%)
Place of birth for the foreign-born population - Iraq (%)
Place of birth for the foreign-born population - Israel (%)
Place of birth for the foreign-born population - Jordan (%)
Place of birth for the foreign-born population - Kuwait (%)
Place of birth for the foreign-born population - Lebanon (%)
Place of birth for the foreign-born population - Saudi Arabia (%)
Place of birth for the foreign-born population - Syria (%)
Place of birth for the foreign-born population - Turkey (%)
Place of birth for the foreign-born population - Yemen (%)
Place of birth for the foreign-born population - Other Western Asia (%)
Place of birth for the foreign-born population - Eritrea (%)
Place of birth for the foreign-born population - Ethiopia (%)
Place of birth for the foreign-born population - Kenya (%)
Place of birth for the foreign-born population - Somalia (%)
Place of birth for the foreign-born population - Uganda (%)
Place of birth for the foreign-born population - Zimbabwe (%)
Place of birth for the foreign-born population - Other Eastern Africa (%)
Place of birth for the foreign-born population - Cameroon (%)
Place of birth for the foreign-born population - Congo (%)
Place of birth for the foreign-born population - Democratic Republic of Congo (Zaire) (%)
Place of birth for the foreign-born population - Other Middle Africa (%)
Place of birth for the foreign-born population - Egypt (%)
Place of birth for the foreign-born population - Morocco (%)
Place of birth for the foreign-born population - Sudan (%)
Place of birth for the foreign-born population - Other Northern Africa (%)
Place of birth for the foreign-born population - South Africa (%)
Place of birth for the foreign-born population - Other Southern Africa (%)
Place of birth for the foreign-born population - Cabo Verde (%)
Place of birth for the foreign-born population - Ghana (%)
Place of birth for the foreign-born population - Liberia (%)
Place of birth for the foreign-born population - Nigeria (%)
Place of birth for the foreign-born population - Senegal (%)
Place of birth for the foreign-born population - Sierra Leone (%)
Place of birth for the foreign-born population - Other Western Africa (%)
Place of birth for the foreign-born population - Australia (%)
Place of birth for the foreign-born population - New Zealand (%)
Place of birth for the foreign-born population - Fiji (%)
Place of birth for the foreign-born population - Micronesia (%)
Place of birth for the foreign-born population - Bahamas (%)
Place of birth for the foreign-born population - Barbados (%)
Place of birth for the foreign-born population - Cuba (%)
Place of birth for the foreign-born population - Dominica (%)
Place of birth for the foreign-born population - Dominican Republic (%)
Place of birth for the foreign-born population - Grenada (%)
Place of birth for the foreign-born population - Haiti (%)
Place of birth for the foreign-born population - Jamaica (%)
Place of birth for the foreign-born population - St. Vincent and the Grenadines (%)
Place of birth for the foreign-born population - Trinidad and Tobago (%)
Place of birth for the foreign-born population - West Indies (%)
Place of birth for the foreign-born population - Other Caribbean (%)
Place of birth for the foreign-born population - Belize (%)
Place of birth for the foreign-born population - Costa Rica (%)
Place of birth for the foreign-born population - El Salvador (%)
Place of birth for the foreign-born population - Guatemala (%)
Place of birth for the foreign-born population - Honduras (%)
Place of birth for the foreign-born population - Mexico (%)
Place of birth for the foreign-born population - Nicaragua (%)
Place of birth for the foreign-born population - Panama (%)
Place of birth for the foreign-born population - Other Central America (%)
Place of birth for the foreign-born population - Argentina (%)
Place of birth for the foreign-born population - Bolivia (%)
Place of birth for the foreign-born population - Brazil (%)
Place of birth for the foreign-born population - Chile (%)
Place of birth for the foreign-born population - Colombia (%)
Place of birth for the foreign-born population - Ecuador (%)
Place of birth for the foreign-born population - Guyana (%)
Place of birth for the foreign-born population - Peru (%)
Place of birth for the foreign-born population - Uruguay (%)
Place of birth for the foreign-born population - Venezuela (%)
Place of birth for the foreign-born population - Other South America (%)
Place of birth for the foreign-born population - Canada (%)
Place of birth for the foreign-born population - Other Northern America (%)
Place of birth for the foreign-born population - Other (%)
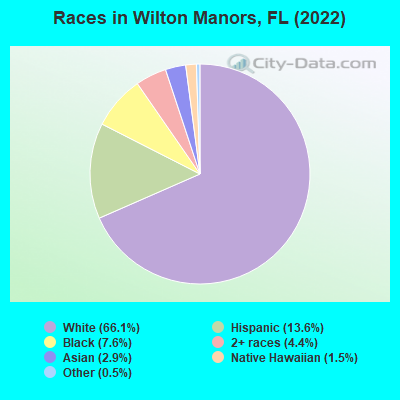
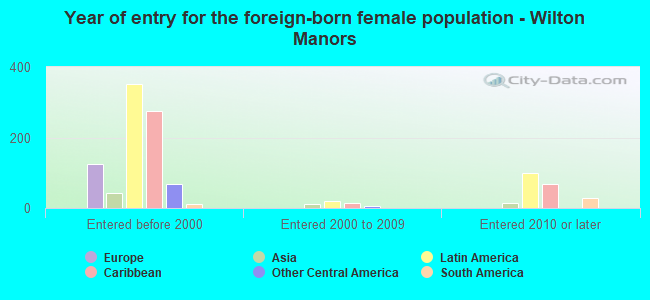
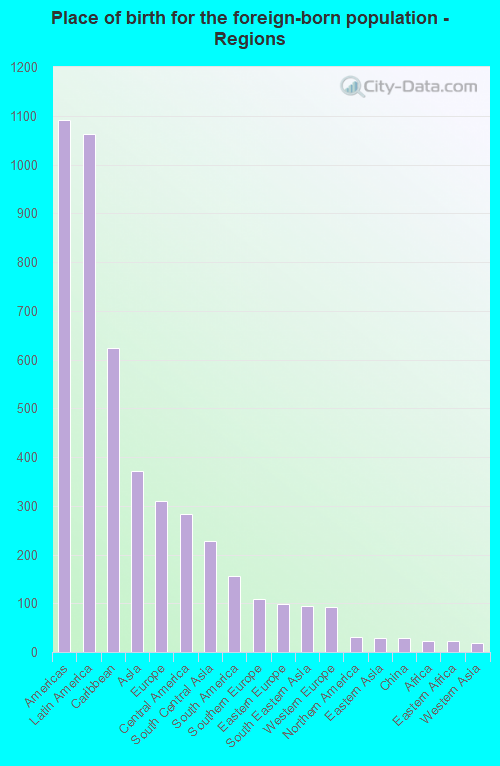
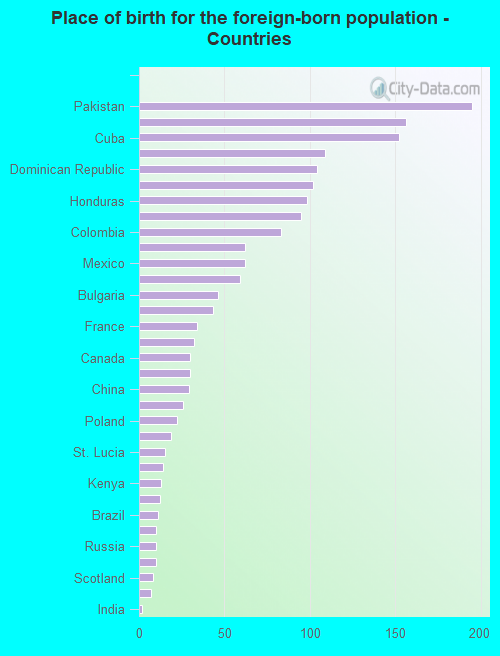
According to 2022 data, the most numerous races in Wilton Manors, FL are White alone (7,588 residents), Hispanic (1,566 residents), and Black alone (875 residents). 79.0% of Wilton Manors residents speak English at home. 15.6% of Wilton Manors, FL residents are foreign-born (8.7% born in Latin America, 3.1% born in Asia, 2.5% born in Europe), which is 34.3% less than the foreign-born rate of 21.0% across the entire state of Florida.
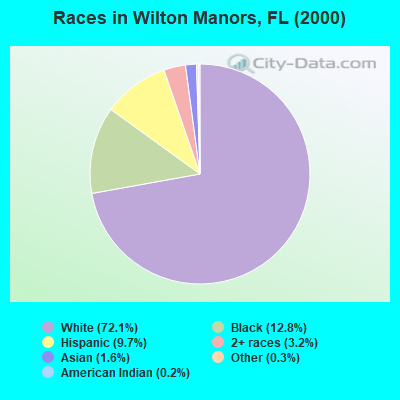
Race distribution in Wilton Manors
2000 2022
10,458,509 65.4% White alone 2,682,715 16.8% Hispanic 2,264,268 14.2% Black alone 261,693 1.6% Asian alone 236,954 1.5% Two or more races 42,358 0.3% American Indian alone 28,994 0.2% Other race alone 6,887 0.04% Native Hawaiian and Other
11,309,403 50.8% White alone 6,025,039 27.1% Hispanic 3,241,015 14.6% Black alone 861,630 3.9% Two or more races 623,692 2.8% Asian alone 152,054 0.7% Other race alone 22,504 0.1% American Indian alone 9,486 0.04% Native Hawaiian and Other
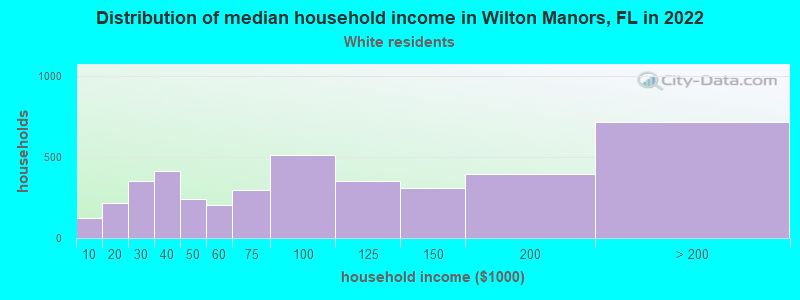
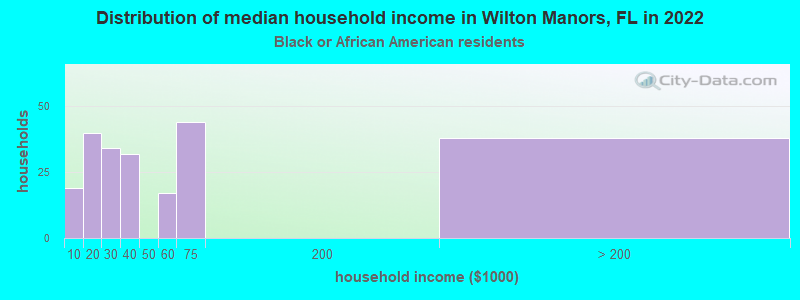
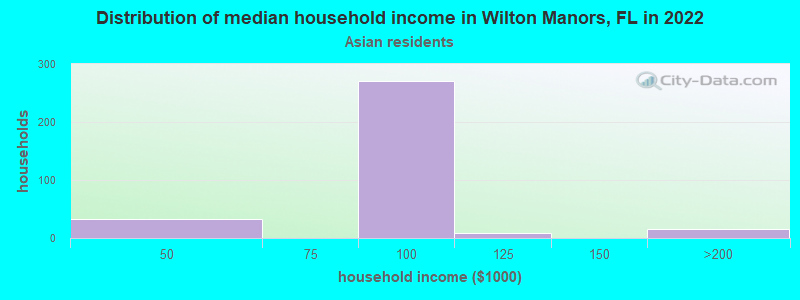
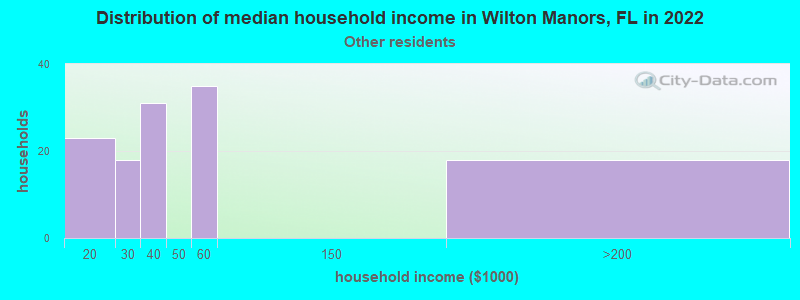
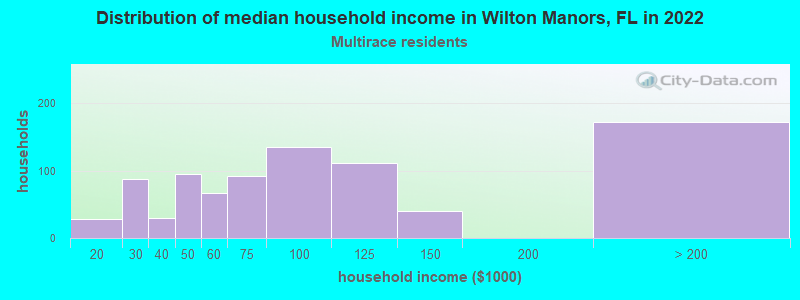
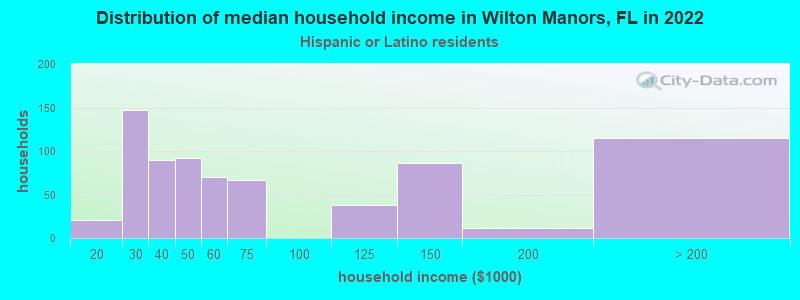
Income and house value in Wilton Manors Median household income in 2022 $87,286 White non-Hispanic householders$38,845 Black householders$81,973 Asian householders$41,028 Some other race householders$90,602 Two or more races householders$51,747 Hispanic or Latino race householdersMedian 2022 house value $587,793 White Non-Hispanic householders$421,041 Black or African American householders $706,224 Asian householders$490,356 Some other race householders$580,664 Two or more races householders$632,155 Hispanic or Latino householders
Median age by race in Wilton Manors
60.5 Median age for White residents60.3 61.8 56.1 Median age for Black or African American residents53.6 56.7 -660,098,521.5 Median age for American Indian / Alaska Native residents-518,333,332.8 -735,362,996.9 51.9 Median age for Asian residents51.7 55.6 -437,357,630.5 Median age for Native Hawaiian / Pacific Islander residents-454,756,380.1 -666,666,666.0 44.2 Median age for Other race residents44.1 -663,194,443.8 38.0 Median age for Two or more races residents61.6 33.1 58.4 Median age for White alone residents58.3 59.5 48.0 Median age for Hispanic or Latino residents54.6 36.2
Owner/renter occupied households by race in Wilton Manors
House owners and renters - White residents 2,710 66.4% Owner occupied1,373 33.6% Renter occupiedHouse owners and renters - Black or African American residents 96 42.3% Owner occupied132 57.7% Renter occupiedHouse owners and renters - Asian residents 192 73.2% Owner occupied70 26.8% Renter occupiedHouse owners and renters - Native Hawaiian / Pacific Islander residents 204 100.0% Owner occupiedHouse owners and renters - Other race residents 80 60.3% Owner occupied53 39.7% Renter occupiedHouse owners and renters - Two or more races residents 531 59.4% Owner occupied363 40.6% Renter occupiedHouse owners and renters - White alone residents 2,984 67.1% Owner occupied1,465 32.9% Renter occupiedHouse owners and renters - Hispanic or Latino residents 328 42.9% Owner occupied437 57.1% Renter occupied
Language usage in Wilton Manors
English speakers - Total 79.0% of residents of Wilton Manors speak English at home.
11.6% of residents speak Spanish at home 808 62.1% Speak English very well494 37.9% Speak English less than very well7.9% of residents speak other language at home 743 83.9% Speak English very well143 16.1% Speak English less than very well
English speakers - Born in the United States 93.0% of residents of Wilton Manors speak English at home.
5.2% of residents speak Spanish at home 272 78.6% Speak English very well74 21.4% Speak English less than very well1.2% of residents speak other language at home 82 100.0% Speak English very well
English speakers - Native, born elsewhere 40.0% of residents of Wilton Manors speak English at home.
63.9% of residents speak Spanish at home 99 100.0% Speak English very well
English speakers - Foreign-born 24.4% of residents of Wilton Manors speak English at home.
36.0% of residents speak Spanish at home 286 44.3% Speak English very well360 55.7% Speak English less than very well38.9% of residents speak other language at home 574 82.1% Speak English very well125 17.9% Speak English less than very well
White (Caucasian) - Speak only English Native:
100.0% (6,466)Foreign-born:
58.2% (229)
White (Caucasian) - Speak another language Native:
2.2% (145)Foreign-born:
54.7% (216)
Black or African American - Speak only English Native:
79.5% (489)Foreign-born:
41.7% (111)
Black or African American - Speak another language Native:
19.9% (123)Foreign-born:
59.0% (157)
Asian - Speak another language Native:
100.0% (9)Foreign-born:
98.5% (331)
Other race - Speak another language Native:
55.5% (121)Foreign-born:
99.4% (29)
Two or more races - Speak only English Native:
55.8% (728)Foreign-born:
9.1% (69)
Two or more races - Speak another language Native:
43.7% (571)Foreign-born:
90.8% (688)
White alone - Speak only English Native:
97.4% (6,765)Foreign-born:
60.0% (250)
White alone - Speak another language Native:
2.5% (177)Foreign-born:
42.3% (176)
Hispanic or Latino - Speak only English Native:
46.5% (388)Foreign-born:
9.2% (65)
Hispanic or Latino - Speak another language Native:
53.8% (448)Foreign-born:
91.0% (645)
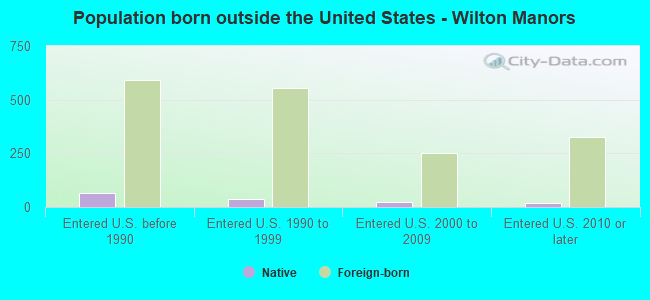
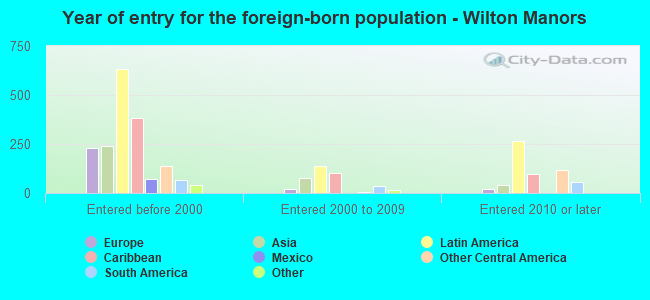
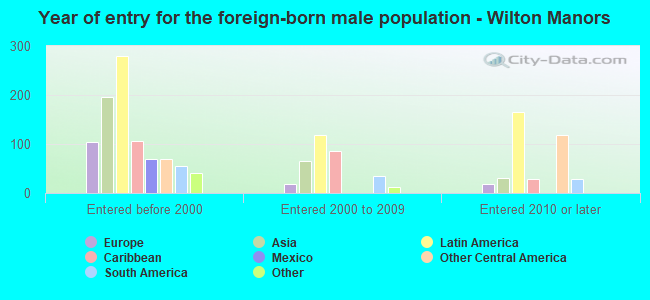
Foreign-born residents in Wilton Manors 1,796 residents are foreign born (8.7% Latin America , 3.1% Asia , 2.5% Europe ).
This city:
15.6%Florida:
21.1%
Marital status for residents in Wilton Manors Marital status - White (Caucasian) population 15 years and over
Males 55.2% Never married33.0% Now married1.4% Separated2.9% Widowed7.6% DivorcedFemales 24.6% Never married43.9% Now married1.6% Separated15.4% Widowed14.5% DivorcedWomen who gave birth in the past 12 months Now married:
0.0% (0)Unmarried:
100.0% (5)
Women who did not give birth in the past 12 months Now married:
44.1% (358)Unmarried:
55.9% (454)
Marital status - Black or African American population 15 years and over
Males 45.2% Never married32.5% Now married0.5% Separated0.0% Widowed21.9% DivorcedFemales 43.5% Never married30.8% Now married2.4% Separated19.1% Widowed4.2% DivorcedWomen who did not give birth in the past 12 months Now married:
0.0% (0)Unmarried:
100.0% (144)
Marital status - Asian population 15 years and over
Males 85.4% Never married6.2% Now married3.6% Separated0.0% Widowed4.7% DivorcedFemales 15.9% Never married84.1% Now married0.0% Separated0.0% Widowed0.0% DivorcedWomen who did not give birth in the past 12 months Now married:
52.4% (11)Unmarried:
47.6% (10)
Marital status - Native Hawaiian / Pacific Islander population 15 years and over
Males 0.0% Never married100.0% Now married0.0% Separated0.0% Widowed0.0% DivorcedFemales 100.0% Never married0.0% Now married0.0% Separated0.0% Widowed0.0% DivorcedWomen who did not give birth in the past 12 months Now married:
0.0% (0)Unmarried:
100.0% (8)
Marital status - Other race population 15 years and over
Males 36.5% Never married16.7% Now married0.0% Separated0.0% Widowed46.8% DivorcedFemales 69.7% Never married30.3% Now married0.0% Separated0.0% Widowed0.0% DivorcedWomen who did not give birth in the past 12 months Now married:
0.0% (0)Unmarried:
100.0% (34)
Marital status - Two or more races population 15 years and over
Males 38.9% Never married31.0% Now married0.0% Separated11.7% Widowed18.4% DivorcedFemales 29.8% Never married65.1% Now married0.0% Separated1.6% Widowed3.5% DivorcedWomen who did not give birth in the past 12 months Now married:
60.4% (321)Unmarried:
39.6% (210)
Marital status - White alone, not Hispanic / Latino population 15 years and over
Males 55.5% Never married32.2% Now married1.4% Separated3.0% Widowed7.9% DivorcedFemales 24.7% Never married44.5% Now married1.7% Separated16.2% Widowed12.9% DivorcedWomen who gave birth in the past 12 months Now married:
0.0% (0)Unmarried:
100.0% (6)
Women who did not give birth in the past 12 months Now married:
43.9% (396)Unmarried:
56.1% (505)
Marital status - Hispanic or Latino population 15 years and over
Males 49.7% Never married32.8% Now married0.0% Separated0.0% Widowed17.5% DivorcedFemales 31.2% Never married55.8% Now married0.0% Separated1.9% Widowed11.0% DivorcedWomen who did not give birth in the past 12 months Now married:
55.8% (258)Unmarried:
44.2% (205)
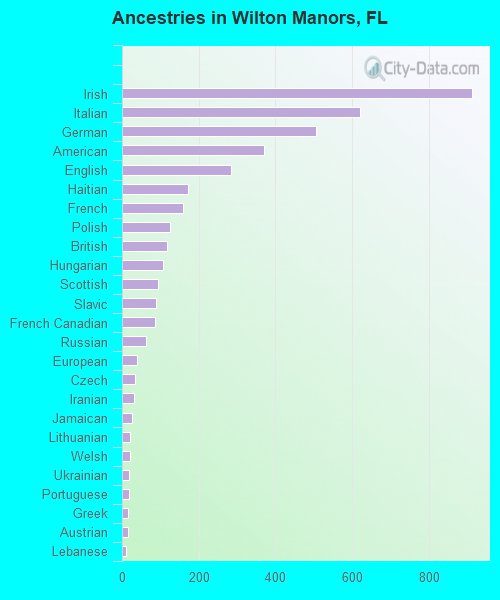
Ancestries in Wilton Manors
911 15.5% Irish621 10.5% Italian506 8.6% German371 6.3% American284 4.8% English173 2.9% Haitian160 2.7% French124 2.1% Polish117 2.0% British106 1.8% Hungarian94 1.6% Scottish88 1.5% Slavic87 1.5% French Canadian63 1.1% Russian39 0.7% European34 0.6% Czech30 0.5% Iranian25 0.4% Jamaican22 0.4% Lithuanian22 0.4% Welsh19 0.3% Ukrainian17 0.3% Portuguese16 0.3% Greek15 0.3% Austrian11 0.2% Lebanese10 0.2% Canadian10 0.2% Norwegian9 0.2% Danish9 0.2% Scotch-Irish7 0.1% Bulgarian7 0.1% Trinidadian and Tobagonian6 0.1% Swiss
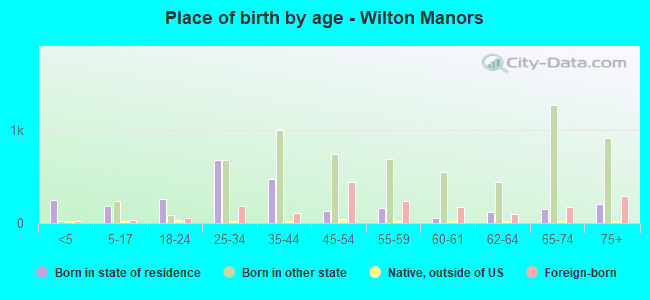
Children Nativity (place of birth) in Wilton Manors
Children under 6 years - Living with two parents Both parents native 56 100.0% NativeChildren under 6 years - Living with one parent Native parent 213 100.0% NativeChildren 6 to 17 years - Living with two parents Both parents native 202 100.0% NativeOne native, one foreign-born parent 9 100.0% NativeChildren 6 to 17 years - Living with one parent Native parent 127 100.0% NativeForeign-born parent 41 50.6% Native40 49.4% Foreign-born
Grandparents responsible for own grandchildren in Wilton Manors
Grandparents (30 to 59 years) White / Caucasian 4 100.0% Not responsible for grandchildrenWhite alone, not Hispanic / Latino 4 100.0% Not responsible for grandchildren
Grandparents (60 years and over) White / Caucasian 34 100.0% Not responsible for grandchildrenWhite alone, not Hispanic / Latino 51 100.0% Not responsible for grandchildren