Races in Windsor Heights, Iowa (IA) Detailed Stats
Data:
Races - White alone (%)
Races - White alone (% change since 2000)
Races - Black alone (%)
Races - Black alone (% change since 2000)
Races - American Indian alone (%)
Races - American Indian alone (% change since 2000)
Races - Asian alone (%)
Races - Asian alone (% change since 2000)
Races - Hispanic (%)
Races - Hispanic (% change since 2000)
Races - Native Hawaiian and Other Pacific Islander alone (%)
Races - Native Hawaiian and Other Pacific Islander alone (% change since 2000)
Races - Two or more races(%)
Races - Two or more races(% change since 2000)
Races - Other race alone (%)
Races - Other race alone (% change since 2000)
Racial diversity
Place of birth - Born in state of residence (%)
Place of birth - Born in state of residence (%) - White
Place of birth - Born in state of residence (%) - Black or African American
Place of birth - Born in state of residence (%) - Asian
Place of birth - Born in state of residence (%) - Hispanic or Latino
Place of birth - Born in state of residence (%) - American Indian and Alaska Native
Place of birth - Born in state of residence (%) - Multirace
Place of birth - Born in state of residence (%) - Other Race
Place of birth - Born in other state (%)
Place of birth - Born in other state (%) - White
Place of birth - Born in other state (%) - Black or African American
Place of birth - Born in other state (%) - Asian
Place of birth - Born in other state (%) - Hispanic or Latino
Place of birth - Born in other state (%) - American Indian and Alaska Native
Place of birth - Born in other state (%) - Multirace
Place of birth - Born in other state (%) - Other Race
Place of birth - Native, outside of US (%)
Place of birth - Native, outside of US (%) - White
Place of birth - Native, outside of US (%) - Black or African American
Place of birth - Native, outside of US (%) - Asian
Place of birth - Native, outside of US (%) - Hispanic or Latino
Place of birth - Native, outside of US (%) - American Indian and Alaska Native
Place of birth - Native, outside of US (%) - Multirace
Place of birth - Native, outside of US (%) - Other Race
Place of birth - Foreign born (%)
Place of birth - Foreign born (%) - White
Place of birth - Foreign born (%) - Black or African American
Place of birth - Foreign born (%) - Asian
Place of birth - Foreign born (%) - Hispanic or Latino
Place of birth - Foreign born (%) - American Indian and Alaska Native
Place of birth - Foreign born (%) - Multirace
Place of birth - Foreign born (%) - Other Race
Residents speaking English at home (%)
Residents speaking English at home - Born in the United States (%)
Residents speaking English at home - Native, born elsewhere (%)
Residents speaking English at home - Foreign born (%)
Residents speaking Spanish at home (%)
Residents speaking Spanish at home - Born in the United States (%)
Residents speaking Spanish at home - Native, born elsewhere (%)
Residents speaking Spanish at home - Foreign born (%)
Residents speaking other language at home (%)
Residents speaking other language at home - Born in the United States (%)
Residents speaking other language at home - Native, born elsewhere (%)
Residents speaking other language at home - Foreign born (%)
Marital status - Never married (%)
Marital status - Now married (%)
Marital status - Separated (%)
Marital status - Widowed (%)
Marital status - Divorced (%)
Ancestries Reported - Arab (%)
Ancestries Reported - Czech (%)
Ancestries Reported - Danish (%)
Ancestries Reported - Dutch (%)
Ancestries Reported - English (%)
Ancestries Reported - French (%)
Ancestries Reported - French Canadian (%)
Ancestries Reported - German (%)
Ancestries Reported - Greek (%)
Ancestries Reported - Hungarian (%)
Ancestries Reported - Irish (%)
Ancestries Reported - Italian (%)
Ancestries Reported - Lithuanian (%)
Ancestries Reported - Norwegian (%)
Ancestries Reported - Polish (%)
Ancestries Reported - Portuguese (%)
Ancestries Reported - Russian (%)
Ancestries Reported - Scotch-Irish (%)
Ancestries Reported - Scottish (%)
Ancestries Reported - Slovak (%)
Ancestries Reported - Subsaharan African (%)
Ancestries Reported - Swedish (%)
Ancestries Reported - Swiss (%)
Ancestries Reported - Ukrainian (%)
Ancestries Reported - United States (%)
Ancestries Reported - Welsh (%)
Ancestries Reported - West Indian (%)
Ancestries Reported - Other (%)
Geographical mobility - Same house 1 year ago (%)
Geographical mobility - Same house 1 year ago (%) - White
Geographical mobility - Same house 1 year ago (%) - Black or African American
Geographical mobility - Same house 1 year ago (%) - Asian
Geographical mobility - Same house 1 year ago (%) - Hispanic or Latino
Geographical mobility - Same house 1 year ago (%) - American Indian and Alaska Native
Geographical mobility - Same house 1 year ago (%) - Multirace
Geographical mobility - Same house 1 year ago (%) - Other Race
Geographical mobility - Moved within same county (%)
Geographical mobility - Moved within same county (%) - White
Geographical mobility - Moved within same county (%) - Black or African American
Geographical mobility - Moved within same county (%) - Asian
Geographical mobility - Moved within same county (%) - Hispanic or Latino
Geographical mobility - Moved within same county (%) - American Indian and Alaska Native
Geographical mobility - Moved within same county (%) - Multirace
Geographical mobility - Moved within same county (%) - Other Race
Geographical mobility - Moved from different county within same state (%)
Geographical mobility - Moved from different county within same state (%) - White
Geographical mobility - Moved from different county within same state (%) - Black or African American
Geographical mobility - Moved from different county within same state (%) - Asian
Geographical mobility - Moved from different county within same state (%) - Hispanic or Latino
Geographical mobility - Moved from different county within same state (%) - American Indian and Alaska Native
Geographical mobility - Moved from different county within same state (%) - Multirace
Geographical mobility - Moved from different county within same state (%) - Other Race
Geographical mobility - Moved from different state (%)
Geographical mobility - Moved from different state (%) - White
Geographical mobility - Moved from different state (%) - Black or African American
Geographical mobility - Moved from different state (%) - Asian
Geographical mobility - Moved from different state (%) - Hispanic or Latino
Geographical mobility - Moved from different state (%) - American Indian and Alaska Native
Geographical mobility - Moved from different state (%) - Multirace
Geographical mobility - Moved from different state (%) - Other Race
Geographical mobility - Moved from abroad (%)
Geographical mobility - Moved from abroad (%) - White
Geographical mobility - Moved from abroad (%) - Black or African American
Geographical mobility - Moved from abroad (%) - Asian
Geographical mobility - Moved from abroad (%) - Hispanic or Latino
Geographical mobility - Moved from abroad (%) - American Indian and Alaska Native
Geographical mobility - Moved from abroad (%) - Multirace
Geographical mobility - Moved from abroad (%) - Other Race
Place of birth for the foreign-born population - Ireland (%)
Place of birth for the foreign-born population - Denmark (%)
Place of birth for the foreign-born population - Norway (%)
Place of birth for the foreign-born population - Sweden (%)
Place of birth for the foreign-born population - United Kingdom (%)
Place of birth for the foreign-born population - England (%)
Place of birth for the foreign-born population - Scotland (%)
Place of birth for the foreign-born population - Other Northern Europe (%)
Place of birth for the foreign-born population - Austria (%)
Place of birth for the foreign-born population - Belgium (%)
Place of birth for the foreign-born population - France (%)
Place of birth for the foreign-born population - Germany (%)
Place of birth for the foreign-born population - Netherlands (%)
Place of birth for the foreign-born population - Switzerland (%)
Place of birth for the foreign-born population - Other Western Europe (%)
Place of birth for the foreign-born population - Greece (%)
Place of birth for the foreign-born population - Italy (%)
Place of birth for the foreign-born population - Portugal (%)
Place of birth for the foreign-born population - Spain (%)
Place of birth for the foreign-born population - Other Southern Europe (%)
Place of birth for the foreign-born population - Albania (%)
Place of birth for the foreign-born population - Belarus (%)
Place of birth for the foreign-born population - Bosnia and Herzegovina (%)
Place of birth for the foreign-born population - Bulgaria (%)
Place of birth for the foreign-born population - Croatia (%)
Place of birth for the foreign-born population - Czechoslovakia (%)
Place of birth for the foreign-born population - Hungary (%)
Place of birth for the foreign-born population - Latvia (%)
Place of birth for the foreign-born population - Lithuania (%)
Place of birth for the foreign-born population - North Macedonia (Macedonia) (%)
Place of birth for the foreign-born population - Moldova (%)
Place of birth for the foreign-born population - Poland (%)
Place of birth for the foreign-born population - Romania (%)
Place of birth for the foreign-born population - Russia (%)
Place of birth for the foreign-born population - Serbia (%)
Place of birth for the foreign-born population - Ukraine (%)
Place of birth for the foreign-born population - Other Eastern Europe (%)
Place of birth for the foreign-born population - China (%)
Place of birth for the foreign-born population - Hong Kong (%)
Place of birth for the foreign-born population - Taiwan (%)
Place of birth for the foreign-born population - Japan (%)
Place of birth for the foreign-born population - Korea (%)
Place of birth for the foreign-born population - Other Eastern Asia (%)
Place of birth for the foreign-born population - Afghanistan (%)
Place of birth for the foreign-born population - Bangladesh (%)
Place of birth for the foreign-born population - India (%)
Place of birth for the foreign-born population - Iran (%)
Place of birth for the foreign-born population - Kazakhstan (%)
Place of birth for the foreign-born population - Nepal (%)
Place of birth for the foreign-born population - Pakistan (%)
Place of birth for the foreign-born population - Sri Lanka (%)
Place of birth for the foreign-born population - Uzbekistan (%)
Place of birth for the foreign-born population - Other South Central Asia (%)
Place of birth for the foreign-born population - Burma (%)
Place of birth for the foreign-born population - Cambodia (%)
Place of birth for the foreign-born population - Indonesia (%)
Place of birth for the foreign-born population - Laos (%)
Place of birth for the foreign-born population - Malaysia (%)
Place of birth for the foreign-born population - Philippines (%)
Place of birth for the foreign-born population - Singapore (%)
Place of birth for the foreign-born population - Thailand (%)
Place of birth for the foreign-born population - Vietnam (%)
Place of birth for the foreign-born population - Other South Eastern Asia (%)
Place of birth for the foreign-born population - Armenia (%)
Place of birth for the foreign-born population - Iraq (%)
Place of birth for the foreign-born population - Israel (%)
Place of birth for the foreign-born population - Jordan (%)
Place of birth for the foreign-born population - Kuwait (%)
Place of birth for the foreign-born population - Lebanon (%)
Place of birth for the foreign-born population - Saudi Arabia (%)
Place of birth for the foreign-born population - Syria (%)
Place of birth for the foreign-born population - Turkey (%)
Place of birth for the foreign-born population - Yemen (%)
Place of birth for the foreign-born population - Other Western Asia (%)
Place of birth for the foreign-born population - Eritrea (%)
Place of birth for the foreign-born population - Ethiopia (%)
Place of birth for the foreign-born population - Kenya (%)
Place of birth for the foreign-born population - Somalia (%)
Place of birth for the foreign-born population - Uganda (%)
Place of birth for the foreign-born population - Zimbabwe (%)
Place of birth for the foreign-born population - Other Eastern Africa (%)
Place of birth for the foreign-born population - Cameroon (%)
Place of birth for the foreign-born population - Congo (%)
Place of birth for the foreign-born population - Democratic Republic of Congo (Zaire) (%)
Place of birth for the foreign-born population - Other Middle Africa (%)
Place of birth for the foreign-born population - Egypt (%)
Place of birth for the foreign-born population - Morocco (%)
Place of birth for the foreign-born population - Sudan (%)
Place of birth for the foreign-born population - Other Northern Africa (%)
Place of birth for the foreign-born population - South Africa (%)
Place of birth for the foreign-born population - Other Southern Africa (%)
Place of birth for the foreign-born population - Cabo Verde (%)
Place of birth for the foreign-born population - Ghana (%)
Place of birth for the foreign-born population - Liberia (%)
Place of birth for the foreign-born population - Nigeria (%)
Place of birth for the foreign-born population - Senegal (%)
Place of birth for the foreign-born population - Sierra Leone (%)
Place of birth for the foreign-born population - Other Western Africa (%)
Place of birth for the foreign-born population - Australia (%)
Place of birth for the foreign-born population - New Zealand (%)
Place of birth for the foreign-born population - Fiji (%)
Place of birth for the foreign-born population - Micronesia (%)
Place of birth for the foreign-born population - Bahamas (%)
Place of birth for the foreign-born population - Barbados (%)
Place of birth for the foreign-born population - Cuba (%)
Place of birth for the foreign-born population - Dominica (%)
Place of birth for the foreign-born population - Dominican Republic (%)
Place of birth for the foreign-born population - Grenada (%)
Place of birth for the foreign-born population - Haiti (%)
Place of birth for the foreign-born population - Jamaica (%)
Place of birth for the foreign-born population - St. Vincent and the Grenadines (%)
Place of birth for the foreign-born population - Trinidad and Tobago (%)
Place of birth for the foreign-born population - West Indies (%)
Place of birth for the foreign-born population - Other Caribbean (%)
Place of birth for the foreign-born population - Belize (%)
Place of birth for the foreign-born population - Costa Rica (%)
Place of birth for the foreign-born population - El Salvador (%)
Place of birth for the foreign-born population - Guatemala (%)
Place of birth for the foreign-born population - Honduras (%)
Place of birth for the foreign-born population - Mexico (%)
Place of birth for the foreign-born population - Nicaragua (%)
Place of birth for the foreign-born population - Panama (%)
Place of birth for the foreign-born population - Other Central America (%)
Place of birth for the foreign-born population - Argentina (%)
Place of birth for the foreign-born population - Bolivia (%)
Place of birth for the foreign-born population - Brazil (%)
Place of birth for the foreign-born population - Chile (%)
Place of birth for the foreign-born population - Colombia (%)
Place of birth for the foreign-born population - Ecuador (%)
Place of birth for the foreign-born population - Guyana (%)
Place of birth for the foreign-born population - Peru (%)
Place of birth for the foreign-born population - Uruguay (%)
Place of birth for the foreign-born population - Venezuela (%)
Place of birth for the foreign-born population - Other South America (%)
Place of birth for the foreign-born population - Canada (%)
Place of birth for the foreign-born population - Other Northern America (%)
Place of birth for the foreign-born population - Other (%)
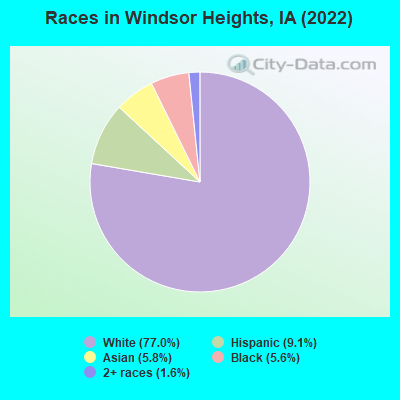
According to 2022 data, the most numerous races in Windsor Heights, IA are White alone (4,064 residents), Hispanic (482 residents), and Black alone (296 residents). 83.4% of Windsor Heights residents speak English at home. 12.7% of Windsor Heights, IA residents are foreign-born (6.1% born in Asia, 3.3% born in Europe, 2.2% born in Latin America), which is 60.6% greater than the foreign-born rate of 5.0% across the entire state of Iowa.
Race distribution in Windsor Heights
2000 2022
2,710,344 92.6% White alone 82,473 2.8% Hispanic 60,744 2.1% Black alone 36,345 1.2% Asian alone 25,472 0.9% Two or more races 7,955 0.3% American Indian alone 2,103 0.07% Other race alone 888 0.03% Native Hawaiian and Other
2,650,110 82.8% White alone 218,024 6.8% Hispanic 119,004 3.7% Black alone 115,286 3.6% Two or more races 74,892 2.3% Asian alone 9,260 0.3% Other race alone 8,595 0.3% Native Hawaiian and Other 5,346 0.2% American Indian alone
Income and house value in Windsor Heights Median household income in 2022 $85,761 White non-Hispanic householders$35,533 Black householdersMedian 2022 house value $255,236 White Non-Hispanic householders $323,848 Asian householders$395,837 Two or more races householders$395,837 Hispanic or Latino householders
Median age by race in Windsor Heights
43.3 Median age for White residents44.4 42.1 45.2 Median age for Black or African American residents30.5 42.8 21.3 Median age for American Indian / Alaska Native residents-518,072,288.6 25.8 39.4 Median age for Asian residents46.5 37.8 -580,729,166.1 Median age for Native Hawaiian / Pacific Islander residents-776,978,416.5 -504,347,825.6 10.0 Median age for Other race residents-734,793,186.6 9.6 5.1 Median age for Two or more races residents-644,654,087.4 7.4 44.0 Median age for White alone residents45.0 43.0 16.6 Median age for Hispanic or Latino residents18.8 10.3
Owner/renter occupied households by race in Windsor Heights
House owners and renters - White residents 1,525 79.4% Owner occupied396 20.6% Renter occupiedHouse owners and renters - Black or African American residents 86 78.4% Owner occupied24 21.6% Renter occupiedHouse owners and renters - American Indian / Alaska Native residents 21 100.0% Owner occupiedHouse owners and renters - Asian residents 103 87.8% Owner occupied14 12.2% Renter occupiedHouse owners and renters - Other race residents 47 100.0% Renter occupiedHouse owners and renters - White alone residents 1,515 78.6% Owner occupied413 21.4% Renter occupiedHouse owners and renters - Hispanic or Latino residents 53 64.8% Owner occupied29 35.2% Renter occupied
Language usage in Windsor Heights
English speakers - Total 83.4% of residents of Windsor Heights speak English at home.
5.8% of residents speak Spanish at home 203 72.5% Speak English very well77 27.5% Speak English less than very well10.7% of residents speak other language at home 355 68.0% Speak English very well167 32.0% Speak English less than very well
English speakers - Born in the United States 98.2% of residents of Windsor Heights speak English at home.
2.6% of residents speak Spanish at home 10 52.6% Speak English very well9 47.4% Speak English less than very well
All residents speak only English at home
English speakers - Foreign-born 8.1% of residents of Windsor Heights speak English at home.
18.0% of residents speak Spanish at home 72 53.3% Speak English very well63 46.7% Speak English less than very well73.8% of residents speak other language at home 384 69.4% Speak English very well169 30.6% Speak English less than very well
White (Caucasian) - Speak only English Native:
99.9% (3,668)Foreign-born:
13.8% (20)
White (Caucasian) - Speak another language Native:
0.9% (33)Foreign-born:
82.5% (119)
Black or African American - Speak only English Native:
97.2% (177)Foreign-born:
41.0% (34)
Other race - Speak another language Native:
68.1% (112)Foreign-born:
100.0% (57)
White alone - Speak only English Native:
99.1% (3,588)Foreign-born:
16.5% (23)
White alone - Speak another language Native:
1.0% (36)Foreign-born:
80.8% (111)
Hispanic or Latino - Speak another language Native:
40.8% (113)Foreign-born:
100.0% (134)
Foreign-born residents in Windsor Heights 670 residents are foreign born (6.1% Asia , 3.3% Europe , 2.2% Latin America ).
Marital status for residents in Windsor Heights Marital status - White (Caucasian) population 15 years and over
Males 36.3% Never married52.5% Now married0.0% Separated1.0% Widowed10.2% DivorcedFemales 27.4% Never married48.0% Now married0.8% Separated5.6% Widowed18.2% DivorcedWomen who gave birth in the past 12 months Now married:
77.4% (62)Unmarried:
22.6% (18)
Women who did not give birth in the past 12 months Now married:
49.7% (315)Unmarried:
50.3% (319)
Marital status - Black or African American population 15 years and over
Males 25.2% Never married74.8% Now married0.0% Separated0.0% Widowed0.0% DivorcedFemales 18.5% Never married72.2% Now married0.0% Separated0.0% Widowed9.3% DivorcedWomen who did not give birth in the past 12 months Now married:
100.0% (52)Unmarried:
0.0% (0)
Marital status - American Indian / Alaska Native population 15 years and over
Males 100.0% Never married0.0% Now married0.0% Separated0.0% Widowed0.0% DivorcedFemales 66.7% Never married33.3% Now married0.0% Separated0.0% Widowed0.0% DivorcedWomen who did not give birth in the past 12 months Now married:
0.0% (0)Unmarried:
100.0% (13)
Marital status - Asian population 15 years and over
Males 37.5% Never married62.5% Now married0.0% Separated0.0% Widowed0.0% DivorcedFemales 40.0% Never married44.7% Now married0.0% Separated6.0% Widowed9.3% DivorcedWomen who did not give birth in the past 12 months Now married:
30.2% (34)Unmarried:
69.8% (78)
Marital status - Other race population 15 years and over
Males 100.0% Never married0.0% Now married0.0% Separated0.0% Widowed0.0% DivorcedFemales 0.0% Never married7.9% Now married0.0% Separated0.0% Widowed92.1% DivorcedWomen who did not give birth in the past 12 months Now married:
7.9% (4)Unmarried:
92.1% (45)
Marital status - Two or more races population 15 years and over
Males 0.0% Never married100.0% Now married0.0% Separated0.0% Widowed0.0% DivorcedFemales 0.0% Never married100.0% Now married0.0% Separated0.0% Widowed0.0% DivorcedMarital status - White alone, not Hispanic / Latino population 15 years and over
Males 35.5% Never married54.2% Now married0.0% Separated1.1% Widowed9.2% DivorcedFemales 26.3% Never married50.2% Now married0.9% Separated5.9% Widowed16.7% DivorcedWomen who gave birth in the past 12 months Now married:
100.0% (64)Unmarried:
0.0% (0)
Women who did not give birth in the past 12 months Now married:
52.8% (324)Unmarried:
47.2% (290)
Marital status - Hispanic or Latino population 15 years and over
Males 64.7% Never married18.0% Now married0.0% Separated0.0% Widowed17.3% DivorcedFemales 39.8% Never married2.3% Now married0.0% Separated0.0% Widowed57.8% DivorcedWomen who gave birth in the past 12 months Now married:
0.0% (0)Unmarried:
100.0% (21)
Women who did not give birth in the past 12 months Now married:
3.4% (3)Unmarried:
96.6% (93)
Ancestries in Windsor Heights
544 18.4% German450 15.3% American264 8.9% English226 7.7% Afghan175 5.9% Scandinavian113 3.8% Irish100 3.4% European86 2.9% Italian57 1.9% Yugoslavian43 1.5% African42 1.4% Dutch42 1.4% Norwegian33 1.1% Ukrainian26 0.9% British19 0.6% French17 0.6% Scotch-Irish15 0.5% Polish15 0.5% Portuguese11 0.4% Scottish9 0.3% French Canadian6 0.2% Croatian3 0.1% Somali
Children Nativity (place of birth) in Windsor Heights
Children under 6 years - Living with two parents Both parents native 262 100.0% NativeBoth parents foreign-born 12 100.0% NativeChildren under 6 years - Living with one parent Native parent 146 100.0% NativeForeign-born parent 31 100.0% NativeChildren 6 to 17 years - Living with two parents Both parents native 296 100.0% NativeBoth parents foreign-born 192 100.0% Foreign-bornOne native, one foreign-born parent 112 100.0% NativeChildren 6 to 17 years - Living with one parent Native parent 105 100.0% NativeForeign-born parent 168 53.0% Native149 47.0% Foreign-born
Grandparents responsible for own grandchildren in Windsor Heights
Grandparents (30 to 59 years) White / Caucasian 32 73.8% Responsible for grandchildren11 26.2% Not responsible for grandchildrenWhite alone, not Hispanic / Latino 32 71.3% Responsible for grandchildren13 28.7% Not responsible for grandchildren
Grandparents (60 years and over) White / Caucasian 8 100.0% Not responsible for grandchildrenWhite alone, not Hispanic / Latino 9 100.0% Not responsible for grandchildren