Races in Winona, Minnesota (MN) Detailed Stats
Data:
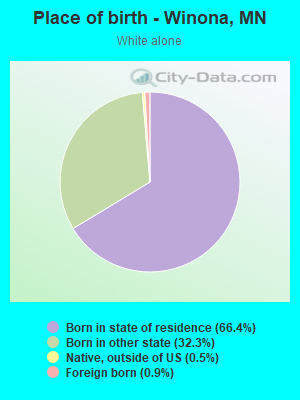
Races - White alone (%)
Races - White alone (% change since 2000)
Races - Black alone (%)
Races - Black alone (% change since 2000)
Races - American Indian alone (%)
Races - American Indian alone (% change since 2000)
Races - Asian alone (%)
Races - Asian alone (% change since 2000)
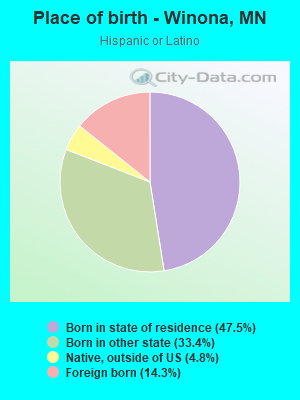
Races - Hispanic (%)
Races - Hispanic (% change since 2000)
Races - Native Hawaiian and Other Pacific Islander alone (%)
Races - Native Hawaiian and Other Pacific Islander alone (% change since 2000)
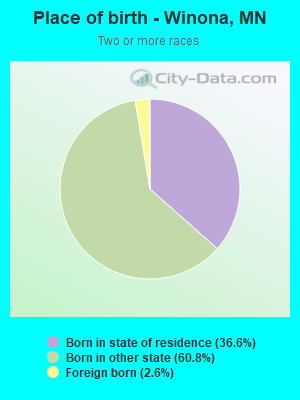
Races - Two or more races(%)
Races - Two or more races(% change since 2000)
Races - Other race alone (%)
Races - Other race alone (% change since 2000)
Racial diversity
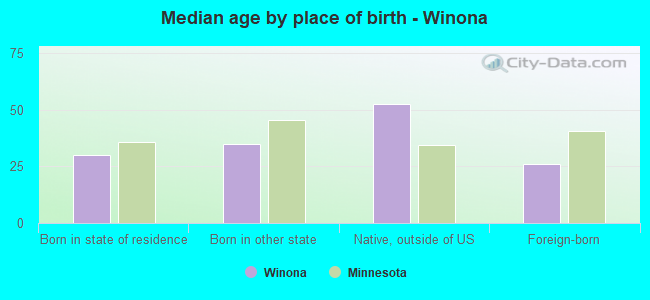
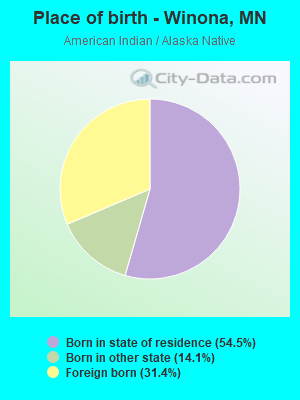
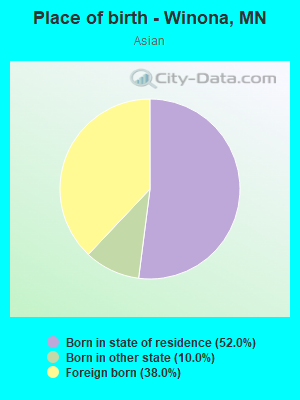
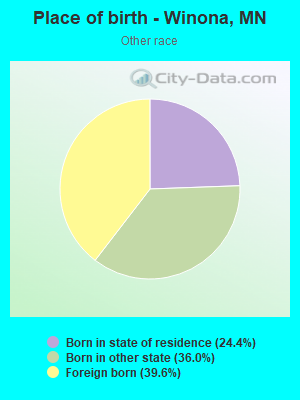
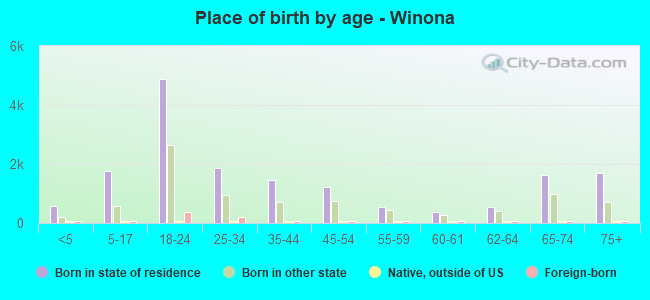
Place of birth - Born in state of residence (%)
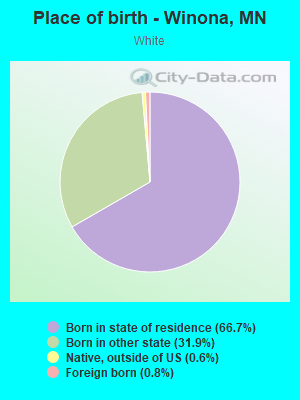
Place of birth - Born in state of residence (%) - White
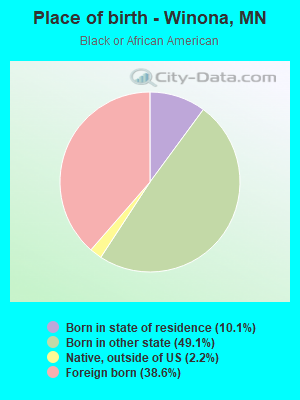
Place of birth - Born in state of residence (%) - Black or African American
Place of birth - Born in state of residence (%) - Asian
Place of birth - Born in state of residence (%) - Hispanic or Latino
Place of birth - Born in state of residence (%) - American Indian and Alaska Native
Place of birth - Born in state of residence (%) - Multirace
Place of birth - Born in state of residence (%) - Other Race
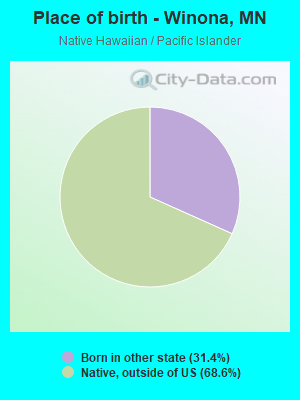
Place of birth - Born in other state (%)
Place of birth - Born in other state (%) - White
Place of birth - Born in other state (%) - Black or African American
Place of birth - Born in other state (%) - Asian
Place of birth - Born in other state (%) - Hispanic or Latino
Place of birth - Born in other state (%) - American Indian and Alaska Native
Place of birth - Born in other state (%) - Multirace
Place of birth - Born in other state (%) - Other Race
Place of birth - Native, outside of US (%)
Place of birth - Native, outside of US (%) - White
Place of birth - Native, outside of US (%) - Black or African American
Place of birth - Native, outside of US (%) - Asian
Place of birth - Native, outside of US (%) - Hispanic or Latino
Place of birth - Native, outside of US (%) - American Indian and Alaska Native
Place of birth - Native, outside of US (%) - Multirace
Place of birth - Native, outside of US (%) - Other Race
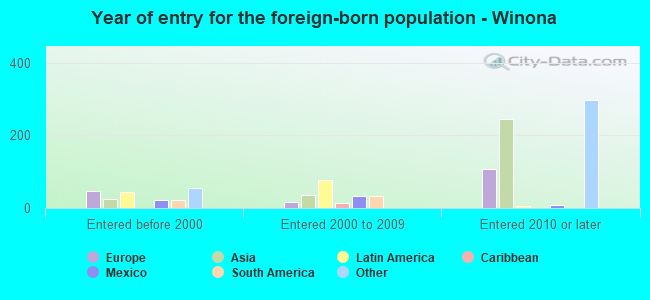
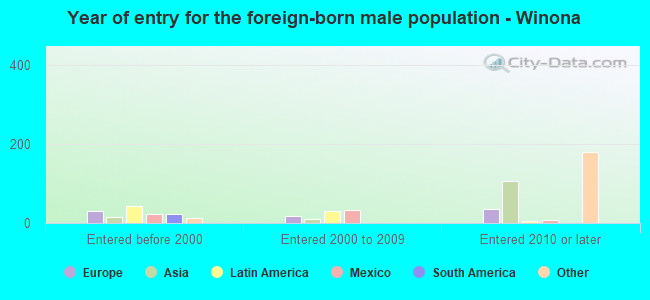
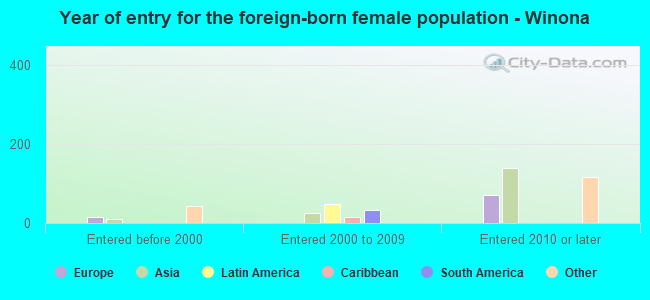
Place of birth - Foreign born (%)
Place of birth - Foreign born (%) - White
Place of birth - Foreign born (%) - Black or African American
Place of birth - Foreign born (%) - Asian
Place of birth - Foreign born (%) - Hispanic or Latino
Place of birth - Foreign born (%) - American Indian and Alaska Native
Place of birth - Foreign born (%) - Multirace
Place of birth - Foreign born (%) - Other Race
Residents speaking English at home (%)
Residents speaking English at home - Born in the United States (%)
Residents speaking English at home - Native, born elsewhere (%)
Residents speaking English at home - Foreign born (%)
Residents speaking Spanish at home (%)
Residents speaking Spanish at home - Born in the United States (%)
Residents speaking Spanish at home - Native, born elsewhere (%)
Residents speaking Spanish at home - Foreign born (%)
Residents speaking other language at home (%)
Residents speaking other language at home - Born in the United States (%)
Residents speaking other language at home - Native, born elsewhere (%)
Residents speaking other language at home - Foreign born (%)
Marital status - Never married (%)
Marital status - Now married (%)
Marital status - Separated (%)
Marital status - Widowed (%)
Marital status - Divorced (%)
Ancestries Reported - Arab (%)
Ancestries Reported - Czech (%)
Ancestries Reported - Danish (%)
Ancestries Reported - Dutch (%)
Ancestries Reported - English (%)
Ancestries Reported - French (%)
Ancestries Reported - French Canadian (%)
Ancestries Reported - German (%)
Ancestries Reported - Greek (%)
Ancestries Reported - Hungarian (%)
Ancestries Reported - Irish (%)
Ancestries Reported - Italian (%)
Ancestries Reported - Lithuanian (%)
Ancestries Reported - Norwegian (%)
Ancestries Reported - Polish (%)
Ancestries Reported - Portuguese (%)
Ancestries Reported - Russian (%)
Ancestries Reported - Scotch-Irish (%)
Ancestries Reported - Scottish (%)
Ancestries Reported - Slovak (%)
Ancestries Reported - Subsaharan African (%)
Ancestries Reported - Swedish (%)
Ancestries Reported - Swiss (%)
Ancestries Reported - Ukrainian (%)
Ancestries Reported - United States (%)
Ancestries Reported - Welsh (%)
Ancestries Reported - West Indian (%)
Ancestries Reported - Other (%)
Geographical mobility - Same house 1 year ago (%)
Geographical mobility - Same house 1 year ago (%) - White
Geographical mobility - Same house 1 year ago (%) - Black or African American
Geographical mobility - Same house 1 year ago (%) - Asian
Geographical mobility - Same house 1 year ago (%) - Hispanic or Latino
Geographical mobility - Same house 1 year ago (%) - American Indian and Alaska Native
Geographical mobility - Same house 1 year ago (%) - Multirace
Geographical mobility - Same house 1 year ago (%) - Other Race
Geographical mobility - Moved within same county (%)
Geographical mobility - Moved within same county (%) - White
Geographical mobility - Moved within same county (%) - Black or African American
Geographical mobility - Moved within same county (%) - Asian
Geographical mobility - Moved within same county (%) - Hispanic or Latino
Geographical mobility - Moved within same county (%) - American Indian and Alaska Native
Geographical mobility - Moved within same county (%) - Multirace
Geographical mobility - Moved within same county (%) - Other Race
Geographical mobility - Moved from different county within same state (%)
Geographical mobility - Moved from different county within same state (%) - White
Geographical mobility - Moved from different county within same state (%) - Black or African American
Geographical mobility - Moved from different county within same state (%) - Asian
Geographical mobility - Moved from different county within same state (%) - Hispanic or Latino
Geographical mobility - Moved from different county within same state (%) - American Indian and Alaska Native
Geographical mobility - Moved from different county within same state (%) - Multirace
Geographical mobility - Moved from different county within same state (%) - Other Race
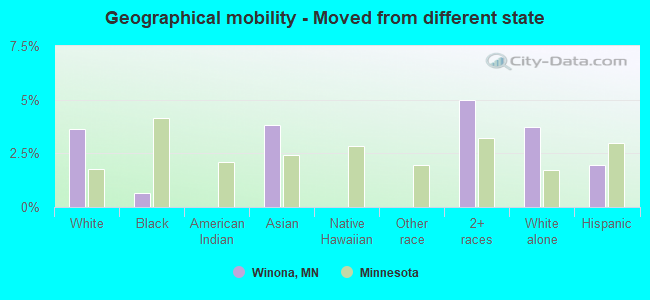
Geographical mobility - Moved from different state (%)
Geographical mobility - Moved from different state (%) - White
Geographical mobility - Moved from different state (%) - Black or African American
Geographical mobility - Moved from different state (%) - Asian
Geographical mobility - Moved from different state (%) - Hispanic or Latino
Geographical mobility - Moved from different state (%) - American Indian and Alaska Native
Geographical mobility - Moved from different state (%) - Multirace
Geographical mobility - Moved from different state (%) - Other Race
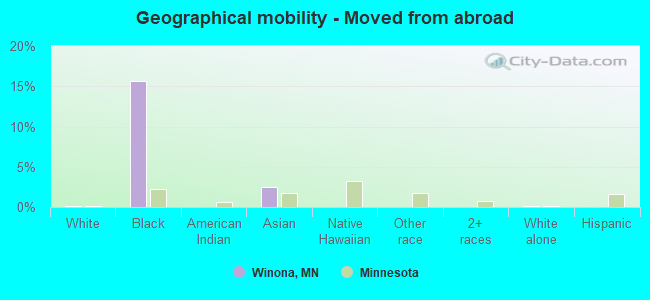
Geographical mobility - Moved from abroad (%)
Geographical mobility - Moved from abroad (%) - White
Geographical mobility - Moved from abroad (%) - Black or African American
Geographical mobility - Moved from abroad (%) - Asian
Geographical mobility - Moved from abroad (%) - Hispanic or Latino
Geographical mobility - Moved from abroad (%) - American Indian and Alaska Native
Geographical mobility - Moved from abroad (%) - Multirace
Geographical mobility - Moved from abroad (%) - Other Race
Place of birth for the foreign-born population - Ireland (%)
Place of birth for the foreign-born population - Denmark (%)
Place of birth for the foreign-born population - Norway (%)
Place of birth for the foreign-born population - Sweden (%)
Place of birth for the foreign-born population - United Kingdom (%)
Place of birth for the foreign-born population - England (%)
Place of birth for the foreign-born population - Scotland (%)
Place of birth for the foreign-born population - Other Northern Europe (%)
Place of birth for the foreign-born population - Austria (%)
Place of birth for the foreign-born population - Belgium (%)
Place of birth for the foreign-born population - France (%)
Place of birth for the foreign-born population - Germany (%)
Place of birth for the foreign-born population - Netherlands (%)
Place of birth for the foreign-born population - Switzerland (%)
Place of birth for the foreign-born population - Other Western Europe (%)
Place of birth for the foreign-born population - Greece (%)
Place of birth for the foreign-born population - Italy (%)
Place of birth for the foreign-born population - Portugal (%)
Place of birth for the foreign-born population - Spain (%)
Place of birth for the foreign-born population - Other Southern Europe (%)
Place of birth for the foreign-born population - Albania (%)
Place of birth for the foreign-born population - Belarus (%)
Place of birth for the foreign-born population - Bosnia and Herzegovina (%)
Place of birth for the foreign-born population - Bulgaria (%)
Place of birth for the foreign-born population - Croatia (%)
Place of birth for the foreign-born population - Czechoslovakia (%)
Place of birth for the foreign-born population - Hungary (%)
Place of birth for the foreign-born population - Latvia (%)
Place of birth for the foreign-born population - Lithuania (%)
Place of birth for the foreign-born population - North Macedonia (Macedonia) (%)
Place of birth for the foreign-born population - Moldova (%)
Place of birth for the foreign-born population - Poland (%)
Place of birth for the foreign-born population - Romania (%)
Place of birth for the foreign-born population - Russia (%)
Place of birth for the foreign-born population - Serbia (%)
Place of birth for the foreign-born population - Ukraine (%)
Place of birth for the foreign-born population - Other Eastern Europe (%)
Place of birth for the foreign-born population - China (%)
Place of birth for the foreign-born population - Hong Kong (%)
Place of birth for the foreign-born population - Taiwan (%)
Place of birth for the foreign-born population - Japan (%)
Place of birth for the foreign-born population - Korea (%)
Place of birth for the foreign-born population - Other Eastern Asia (%)
Place of birth for the foreign-born population - Afghanistan (%)
Place of birth for the foreign-born population - Bangladesh (%)
Place of birth for the foreign-born population - India (%)
Place of birth for the foreign-born population - Iran (%)
Place of birth for the foreign-born population - Kazakhstan (%)
Place of birth for the foreign-born population - Nepal (%)
Place of birth for the foreign-born population - Pakistan (%)
Place of birth for the foreign-born population - Sri Lanka (%)
Place of birth for the foreign-born population - Uzbekistan (%)
Place of birth for the foreign-born population - Other South Central Asia (%)
Place of birth for the foreign-born population - Burma (%)
Place of birth for the foreign-born population - Cambodia (%)
Place of birth for the foreign-born population - Indonesia (%)
Place of birth for the foreign-born population - Laos (%)
Place of birth for the foreign-born population - Malaysia (%)
Place of birth for the foreign-born population - Philippines (%)
Place of birth for the foreign-born population - Singapore (%)
Place of birth for the foreign-born population - Thailand (%)
Place of birth for the foreign-born population - Vietnam (%)
Place of birth for the foreign-born population - Other South Eastern Asia (%)
Place of birth for the foreign-born population - Armenia (%)
Place of birth for the foreign-born population - Iraq (%)
Place of birth for the foreign-born population - Israel (%)
Place of birth for the foreign-born population - Jordan (%)
Place of birth for the foreign-born population - Kuwait (%)
Place of birth for the foreign-born population - Lebanon (%)
Place of birth for the foreign-born population - Saudi Arabia (%)
Place of birth for the foreign-born population - Syria (%)
Place of birth for the foreign-born population - Turkey (%)
Place of birth for the foreign-born population - Yemen (%)
Place of birth for the foreign-born population - Other Western Asia (%)
Place of birth for the foreign-born population - Eritrea (%)
Place of birth for the foreign-born population - Ethiopia (%)
Place of birth for the foreign-born population - Kenya (%)
Place of birth for the foreign-born population - Somalia (%)
Place of birth for the foreign-born population - Uganda (%)
Place of birth for the foreign-born population - Zimbabwe (%)
Place of birth for the foreign-born population - Other Eastern Africa (%)
Place of birth for the foreign-born population - Cameroon (%)
Place of birth for the foreign-born population - Congo (%)
Place of birth for the foreign-born population - Democratic Republic of Congo (Zaire) (%)
Place of birth for the foreign-born population - Other Middle Africa (%)
Place of birth for the foreign-born population - Egypt (%)
Place of birth for the foreign-born population - Morocco (%)
Place of birth for the foreign-born population - Sudan (%)
Place of birth for the foreign-born population - Other Northern Africa (%)
Place of birth for the foreign-born population - South Africa (%)
Place of birth for the foreign-born population - Other Southern Africa (%)
Place of birth for the foreign-born population - Cabo Verde (%)
Place of birth for the foreign-born population - Ghana (%)
Place of birth for the foreign-born population - Liberia (%)
Place of birth for the foreign-born population - Nigeria (%)
Place of birth for the foreign-born population - Senegal (%)
Place of birth for the foreign-born population - Sierra Leone (%)
Place of birth for the foreign-born population - Other Western Africa (%)
Place of birth for the foreign-born population - Australia (%)
Place of birth for the foreign-born population - New Zealand (%)
Place of birth for the foreign-born population - Fiji (%)
Place of birth for the foreign-born population - Micronesia (%)
Place of birth for the foreign-born population - Bahamas (%)
Place of birth for the foreign-born population - Barbados (%)
Place of birth for the foreign-born population - Cuba (%)
Place of birth for the foreign-born population - Dominica (%)
Place of birth for the foreign-born population - Dominican Republic (%)
Place of birth for the foreign-born population - Grenada (%)
Place of birth for the foreign-born population - Haiti (%)
Place of birth for the foreign-born population - Jamaica (%)
Place of birth for the foreign-born population - St. Vincent and the Grenadines (%)
Place of birth for the foreign-born population - Trinidad and Tobago (%)
Place of birth for the foreign-born population - West Indies (%)
Place of birth for the foreign-born population - Other Caribbean (%)
Place of birth for the foreign-born population - Belize (%)
Place of birth for the foreign-born population - Costa Rica (%)
Place of birth for the foreign-born population - El Salvador (%)
Place of birth for the foreign-born population - Guatemala (%)
Place of birth for the foreign-born population - Honduras (%)
Place of birth for the foreign-born population - Mexico (%)
Place of birth for the foreign-born population - Nicaragua (%)
Place of birth for the foreign-born population - Panama (%)
Place of birth for the foreign-born population - Other Central America (%)
Place of birth for the foreign-born population - Argentina (%)
Place of birth for the foreign-born population - Bolivia (%)
Place of birth for the foreign-born population - Brazil (%)
Place of birth for the foreign-born population - Chile (%)
Place of birth for the foreign-born population - Colombia (%)
Place of birth for the foreign-born population - Ecuador (%)
Place of birth for the foreign-born population - Guyana (%)
Place of birth for the foreign-born population - Peru (%)
Place of birth for the foreign-born population - Uruguay (%)
Place of birth for the foreign-born population - Venezuela (%)
Place of birth for the foreign-born population - Other South America (%)
Place of birth for the foreign-born population - Canada (%)
Place of birth for the foreign-born population - Other Northern America (%)
Place of birth for the foreign-born population - Other (%)
Latest news about races in Winona, MN collected exclusively by city-data.com from local newspapers, TV, and radio stations
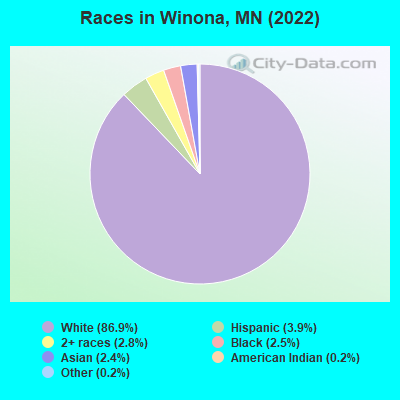
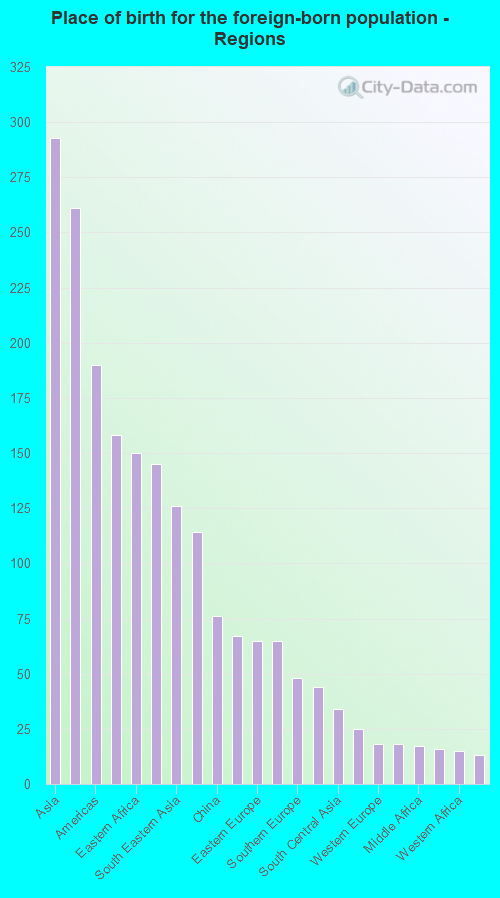
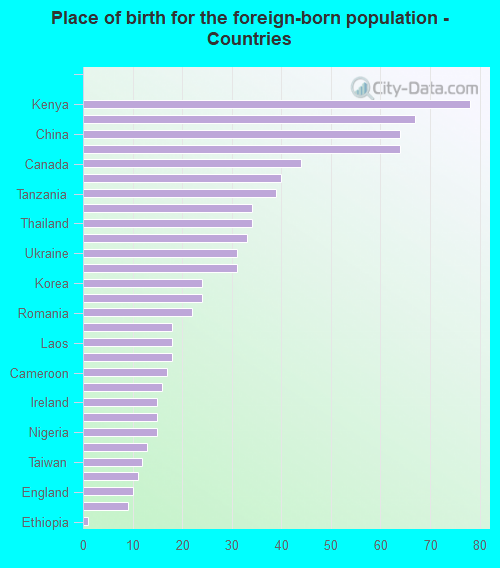
According to 2022 data, the most numerous races in Winona, MN are White alone (22,760 residents), Black alone (667 residents), and Hispanic (1,026 residents). 94.7% of Winona residents speak English at home. 3.5% of Winona, MN residents are foreign-born (1.1% born in Asia, 1.0% born in Africa, 0.6% born in Europe, 0.5% born in Latin America), which is 131.7% less than the foreign-born rate of 8.0% across the entire state of Minnesota.
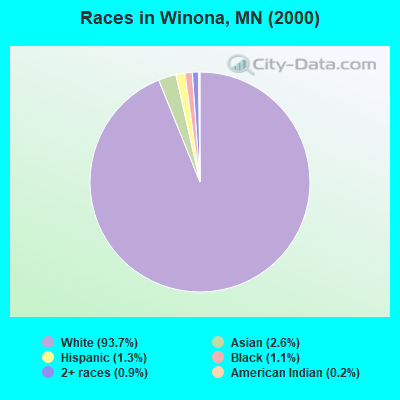
Race distribution in Winona
2000 2022
4,337,143 88.2% White alone 168,813 3.4% Black alone 143,382 2.9% Hispanic 141,083 2.9% Asian alone 70,304 1.4% Two or more races 52,009 1.1% American Indian alone 5,031 0.1% Other race alone 1,714 0.03% Native Hawaiian and Other
4,356,347 76.2% White alone 395,179 6.9% Black alone 333,830 5.8% Hispanic 294,800 5.2% Asian alone 259,649 4.5% Two or more races 42,125 0.7% American Indian alone 32,976 0.6% Other race alone 2,278 0.04% Native Hawaiian and Other
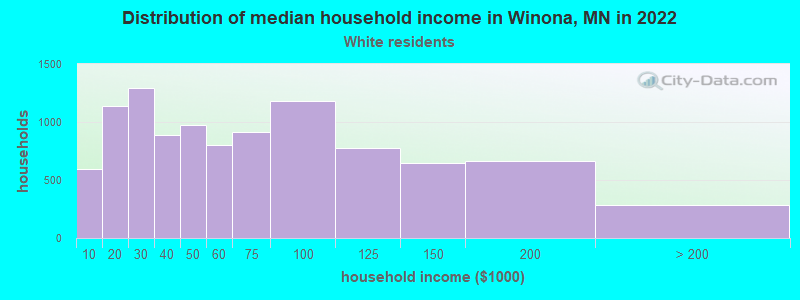
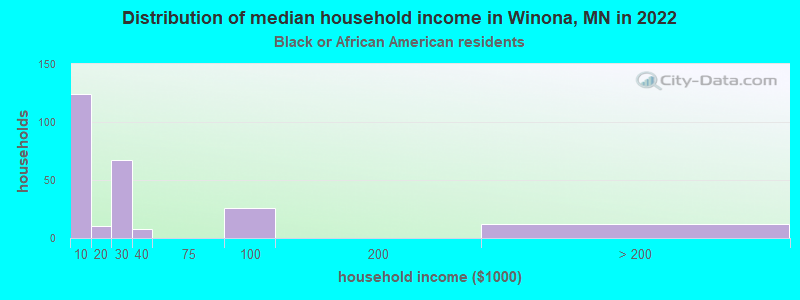
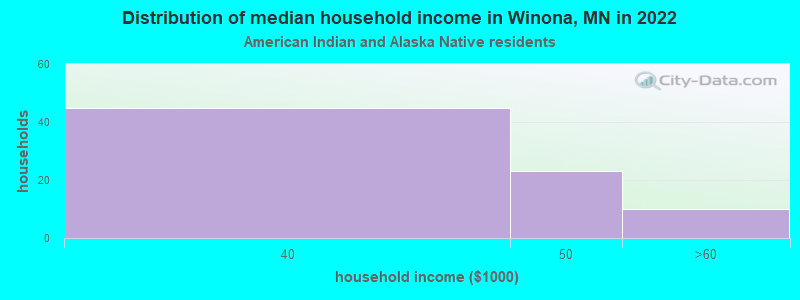
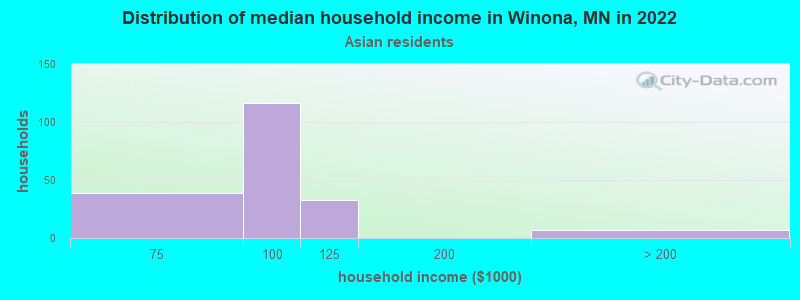
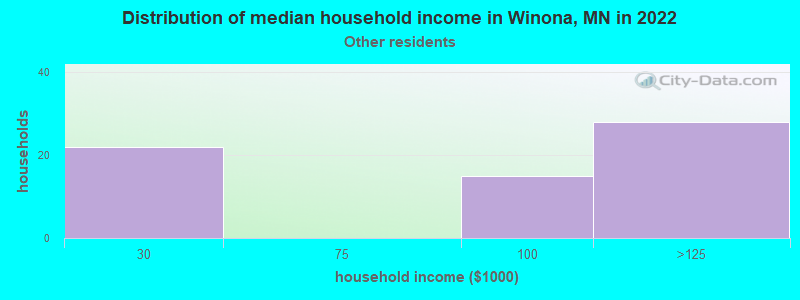
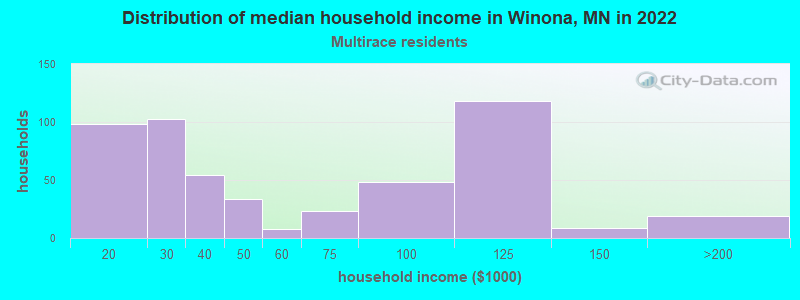
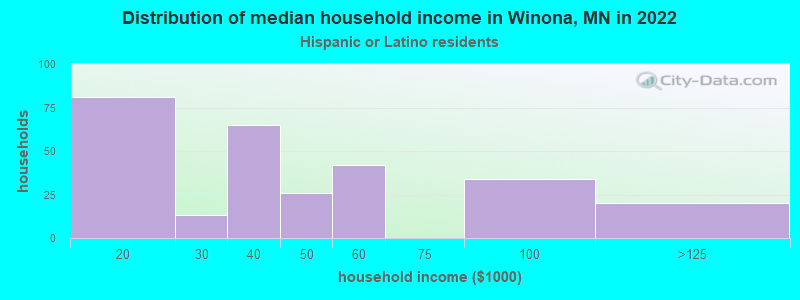
Income and house value in Winona Median household income in 2022 $51,681 White non-Hispanic householders$32,391 American Indian and Alaska Native householders$75,698 Asian householders$35,536 Hispanic or Latino race householdersMedian 2022 house value $192,208 White Non-Hispanic householders$593,234 Black or African American householders$272,456 American Indian or Alaska Native householders $227,802 Asian householders$80,895 Native Hawaiian and other Pacific Islander householders$140,219 Some other race householders$245,059 Two or more races householders$233,626 Hispanic or Latino householders
Median age by race in Winona
33.3 Median age for White residents34.8 32.6 19.4 Median age for Black or African American residents18.7 23.9 20.9 Median age for American Indian / Alaska Native residents20.9 20.7 25.3 Median age for Asian residents29.1 23.1 -744,336,568.8 Median age for Native Hawaiian / Pacific Islander residents-856,799,036.4 -534,959,349.1 30.2 Median age for Other race residents29.7 -669,099,756.0 25.3 Median age for Two or more races residents24.1 28.4 34.8 Median age for White alone residents35.8 33.3 21.1 Median age for Hispanic or Latino residents21.1 20.7
Owner/renter occupied households by race in Winona
House owners and renters - White residents 6,136 61.1% Owner occupied3,909 38.9% Renter occupiedHouse owners and renters - Black or African American residents 11 5.1% Owner occupied210 94.9% Renter occupiedHouse owners and renters - American Indian / Alaska Native residents 25 29.4% Owner occupied59 70.6% Renter occupiedHouse owners and renters - Asian residents 33 19.4% Owner occupied136 80.6% Renter occupiedHouse owners and renters - Other race residents 46 71.5% Owner occupied18 28.5% Renter occupiedHouse owners and renters - Two or more races residents 127 25.7% Owner occupied367 74.3% Renter occupiedHouse owners and renters - White alone residents 6,155 61.1% Owner occupied3,912 38.9% Renter occupiedHouse owners and renters - Hispanic or Latino residents 99 37.0% Owner occupied168 63.0% Renter occupied
Language usage in Winona
English speakers - Total 94.7% of residents of Winona speak English at home.
1.7% of residents speak Spanish at home 343 78.0% Speak English very well97 22.0% Speak English less than very well3.4% of residents speak other language at home 647 74.4% Speak English very well223 25.6% Speak English less than very well
English speakers - Born in the United States 95.7% of residents of Winona speak English at home.
2.9% of residents speak Spanish at home 182 75.5% Speak English very well59 24.5% Speak English less than very well1.3% of residents speak other language at home 74 68.5% Speak English very well34 31.5% Speak English less than very well
English speakers - Native, born elsewhere 71.9% of residents of Winona speak English at home.
18.0% of residents speak Spanish at home 30 100.0% Speak English very well7.8% of residents speak other language at home 13 100.0% Speak English very well
English speakers - Foreign-born 27.4% of residents of Winona speak English at home.
6.0% of residents speak Spanish at home 34 63.0% Speak English very well20 37.0% Speak English less than very well66.7% of residents speak other language at home 409 67.8% Speak English very well194 32.2% Speak English less than very well
White (Caucasian) - Speak only English Native:
99.0% (22,110)Foreign-born:
41.4% (76)
White (Caucasian) - Speak another language Native:
1.2% (272)Foreign-born:
58.9% (109)
Black or African American - Speak only English Native:
92.9% (283)Foreign-born:
6.2% (16)
Black or African American - Speak another language Native:
5.1% (15)Foreign-born:
95.1% (245)
American Indian / Alaska Native - Speak only English Native:
100.0% (124)Foreign-born:
62.1% (35)
Asian - Speak only English Native:
51.6% (184)Foreign-born:
9.6% (23)
Asian - Speak another language Native:
49.5% (177)Foreign-born:
90.7% (223)
Other race - Speak only English Native:
58.7% (108)Foreign-born:
87.5% (102)
Other race - Speak another language Native:
42.4% (78)Foreign-born:
24.9% (29)
Two or more races - Speak only English Native:
89.9% (825)Foreign-born:
62.8% (17)
Two or more races - Speak another language Native:
10.2% (94)Foreign-born:
28.7% (8)
White alone - Speak only English Native:
99.1% (21,830)Foreign-born:
39.0% (80)
White alone - Speak another language Native:
1.0% (216)Foreign-born:
60.6% (125)
Hispanic or Latino - Speak only English Native:
71.6% (580)Foreign-born:
75.2% (110)
Hispanic or Latino - Speak another language Native:
29.5% (239)Foreign-born:
39.3% (58)
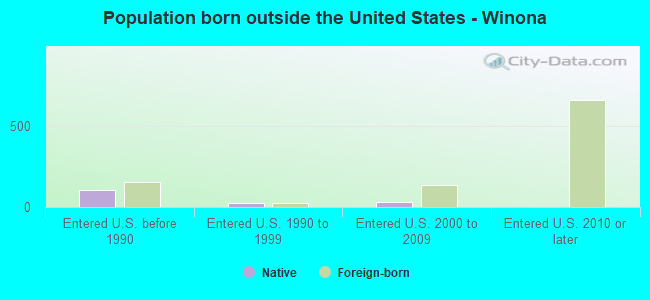
Foreign-born residents in Winona 904 residents are foreign born (1.1% Asia , 1.0% Africa , 0.6% Europe , 0.5% Latin America ).
This city:
3.5%Minnesota:
8.5%
Marital status for residents in Winona Marital status - White (Caucasian) population 15 years and over
Males 51.6% Never married34.8% Now married1.2% Separated2.1% Widowed10.3% DivorcedFemales 48.4% Never married29.6% Now married0.1% Separated9.7% Widowed12.3% DivorcedWomen who gave birth in the past 12 months Now married:
81.2% (79)Unmarried:
18.8% (18)
Women who did not give birth in the past 12 months Now married:
18.9% (1,250)Unmarried:
81.1% (5,381)
Marital status - Black or African American population 15 years and over
Males 90.9% Never married9.1% Now married0.0% Separated0.0% Widowed0.0% DivorcedFemales 65.1% Never married27.1% Now married4.6% Separated0.0% Widowed3.2% DivorcedWomen who gave birth in the past 12 months Now married:
0.0% (0)Unmarried:
100.0% (4)
Women who did not give birth in the past 12 months Now married:
25.3% (51)Unmarried:
74.7% (150)
Marital status - American Indian / Alaska Native population 15 years and over
Males 100.0% Never married0.0% Now married0.0% Separated0.0% Widowed0.0% DivorcedFemales 61.1% Never married25.3% Now married13.7% Separated0.0% Widowed0.0% DivorcedWomen who did not give birth in the past 12 months Now married:
18.3% (14)Unmarried:
81.7% (60)
Marital status - Asian population 15 years and over
Males 86.5% Never married13.5% Now married0.0% Separated0.0% Widowed0.0% DivorcedFemales 84.4% Never married15.6% Now married0.0% Separated0.0% Widowed0.0% DivorcedWomen who gave birth in the past 12 months Now married:
100.0% (11)Unmarried:
0.0% (0)
Women who did not give birth in the past 12 months Now married:
8.6% (24)Unmarried:
91.4% (250)
Marital status - Other race population 15 years and over
Males 60.5% Never married39.5% Now married0.0% Separated0.0% Widowed0.0% DivorcedFemales 0.0% Never married100.0% Now married0.0% Separated0.0% Widowed0.0% DivorcedWomen who did not give birth in the past 12 months Now married:
100.0% (18)Unmarried:
0.0% (0)
Marital status - Two or more races population 15 years and over
Males 66.2% Never married33.8% Now married0.0% Separated0.0% Widowed0.0% DivorcedFemales 52.3% Never married16.8% Now married0.0% Separated0.0% Widowed30.9% DivorcedWomen who did not give birth in the past 12 months Now married:
12.5% (42)Unmarried:
87.5% (291)
Marital status - White alone, not Hispanic / Latino population 15 years and over
Males 51.2% Never married35.0% Now married1.2% Separated2.1% Widowed10.5% DivorcedFemales 48.2% Never married29.5% Now married0.1% Separated9.8% Widowed12.4% DivorcedWomen who gave birth in the past 12 months Now married:
81.2% (80)Unmarried:
18.8% (19)
Women who did not give birth in the past 12 months Now married:
18.7% (1,235)Unmarried:
81.3% (5,368)
Marital status - Hispanic or Latino population 15 years and over
Males 65.7% Never married34.3% Now married0.0% Separated0.0% Widowed0.0% DivorcedFemales 48.2% Never married25.9% Now married0.0% Separated0.0% Widowed25.9% DivorcedWomen who did not give birth in the past 12 months Now married:
17.1% (51)Unmarried:
82.9% (248)
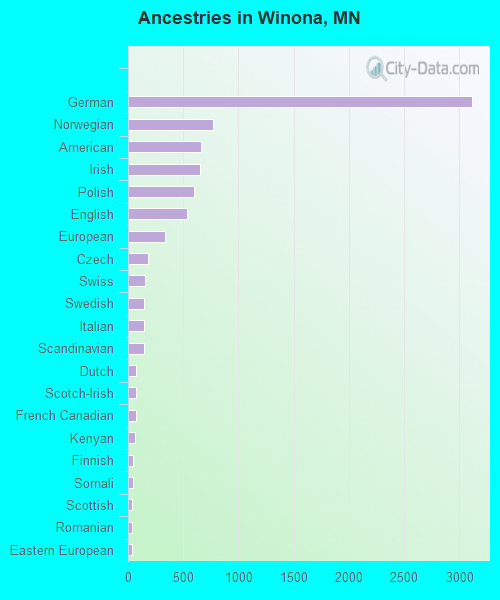
Ancestries in Winona
3,115 33.4% German768 8.2% Norwegian664 7.1% American654 7.0% Irish595 6.4% Polish531 5.7% English337 3.6% European177 1.9% Czech158 1.7% Swiss148 1.6% Swedish146 1.6% Italian143 1.5% Scandinavian72 0.8% Dutch72 0.8% Scotch-Irish69 0.7% French Canadian60 0.6% Kenyan49 0.5% Finnish41 0.4% Somali39 0.4% Scottish33 0.4% Romanian32 0.3% Eastern European28 0.3% Hungarian24 0.3% Greek23 0.2% Turkish22 0.2% Egyptian19 0.2% Liberian15 0.2% African15 0.2% Ukrainian12 0.1% Lithuanian11 0.1% Bulgarian11 0.1% British West Indian9 0.10% Russian8 0.09% Cajun6 0.06% Danish6 0.06% Portuguese4 0.04% British
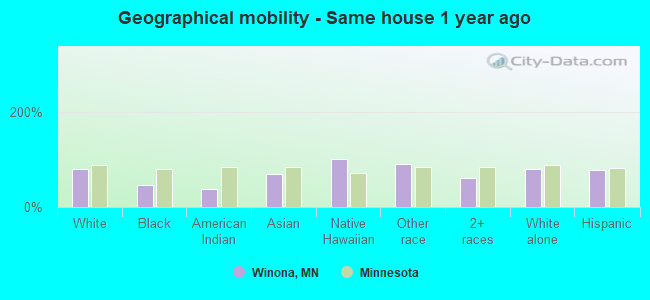
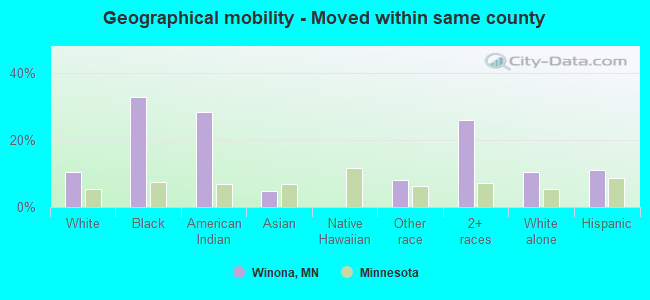
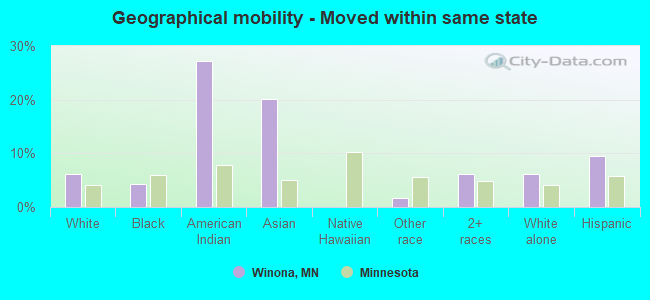
Geographical mobility in Winona Same house 1 year ago 18,116 79.0% White (Caucasian)305 45.9% Black or African American63 38.3% American Indian / Alaska Native433 68.9% Asian4 100.0% Native Hawaiian / Pacific Islander268 90.1% Other race594 60.1% Two or more races17,894 78.9% White alone, not Hispanic / Latino788 77.2% Hispanic or LatinoMoved within same county 2,401 10.5% White / Caucasian219 32.9% Black or African American47 28.4% American Indian / Alaska Native30 4.7% Asian24 8.0% Other race255 25.8% Two or more races2,390 10.5% White alone, not Hispanic / Latino114 11.1% Hispanic or LatinoMoved within same state 1,426 6.2% White / Caucasian29 4.3% Black or African American45 27.2% American Indian / Alaska Native127 20.1% Asian5 1.7% Other race61 6.2% Two or more races1,392 6.1% White alone, not Hispanic / Latino98 9.6% Hispanic or LatinoMoved from different state 837 3.6% White / Caucasian4 0.6% Black or African American24 3.8% Asian49 5.0% Two or more races843 3.7% White alone, not Hispanic / Latino20 2.0% Hispanic or LatinoMoved from abroad 33 0.1% White104 15.7% Black or African American16 2.5% Asian36 0.2% White alone, not Hispanic / Latino
Children Nativity (place of birth) in Winona
Children under 6 years - Living with two parents Both parents native 641 100.0% NativeBoth parents foreign-born 6 100.0% NativeOne native, one foreign-born parent 136 100.0% NativeChildren under 6 years - Living with one parent Native parent 255 100.0% NativeForeign-born parent 17 100.0% NativeChildren 6 to 17 years - Living with two parents Both parents native 1,110 100.0% NativeOne native, one foreign-born parent 215 100.0% NativeChildren 6 to 17 years - Living with one parent Native parent 641 100.0% NativeForeign-born parent 14 50.4% Native14 49.6% Foreign-born
Grandparents responsible for own grandchildren in Winona
Grandparents (30 to 59 years) White / Caucasian 7 36.3% Responsible for grandchildren13 63.7% Not responsible for grandchildrenWhite alone, not Hispanic / Latino 8 36.4% Responsible for grandchildren13 63.6% Not responsible for grandchildren
Grandparents (60 years and over) White / Caucasian 33 100.0% Not responsible for grandchildrenWhite alone, not Hispanic / Latino 33 100.0% Not responsible for grandchildren