Races in Winterville, North Carolina (NC) Detailed Stats
Ancestries, Foreign-born residents, place of birth
Settings
X


Recent posts about races in Winterville, North Carolina on our local forum with over 2,400,000 registered users:
 | SHORT NOTICE: Good lunch spot, 60-90 minutes from Cary (30 replies) |
| Should I move from N. Charleston SC to Winterville NC (4 replies) |
| Raleigh vs Charlotte (2458 replies) |
| relocation to greenville/winterville info needed (11 replies) |
| Greenville info please (13 replies) |
| Greenville Area Developments (11695 replies) |
Latest news about races in Winterville, NC collected exclusively by city-data.com from local newspapers, TV, and radio stations
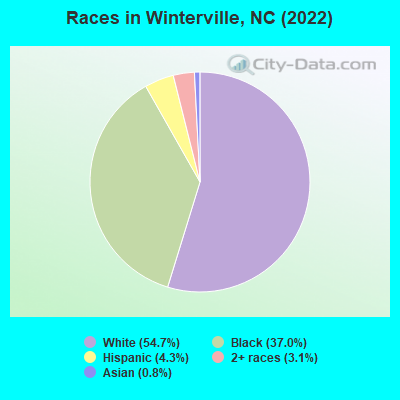
According to 2022 data, the most numerous races in Winterville, NC are White alone (5,832 residents), Black alone (3,943 residents), and Hispanic (456 residents). 90.9% of Winterville residents speak English at home. 6.2% of Winterville, NC residents are foreign-born (2.7% born in Latin America, 1.5% born in Asia, 1.1% born in North America), which is 28.4% less than the foreign-born rate of 8.0% across the entire state of North Carolina.
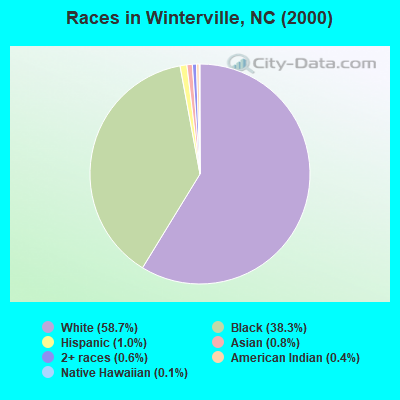
Race distribution in Winterville
2000
2022

- 2,81358.7%White alone
- 1,83638.3%Black alone
- 491.0%Hispanic
- 390.8%Asian alone
- 290.6%Two or more races
- 170.4%American Indian alone
- 50.1%Native Hawaiian and Other
Pacific Islander alone - 30.06%Other race alone
-
- 5,83254.7%White alone
- 3,94337.0%Black alone
- 4564.3%Hispanic
- 3323.1%Two or more races
- 890.8%Asian alone
- 90.08%American Indian alone
- 70.07%Other race alone
2000
2022
-
- 5,647,15570.2%White alone
- 1,723,30121.4%Black alone
- 378,9634.7%Hispanic
- 112,4161.4%Asian alone
- 95,3331.2%American Indian alone
- 79,9651.0%Two or more races
- 9,0150.1%Other race alone
- 3,1650.04%Native Hawaiian and Other
Pacific Islander alone

-
- 6,497,51960.7%White alone
- 2,155,65020.1%Black alone
- 1,114,79910.4%Hispanic
- 438,0614.1%Two or more races
- 341,0523.2%Asian alone
- 91,7580.9%American Indian alone
- 50,1800.5%Other race alone
- 9,9540.09%Native Hawaiian and Other
Pacific Islander alone

Income and house value in Winterville
- Median household income in 2022
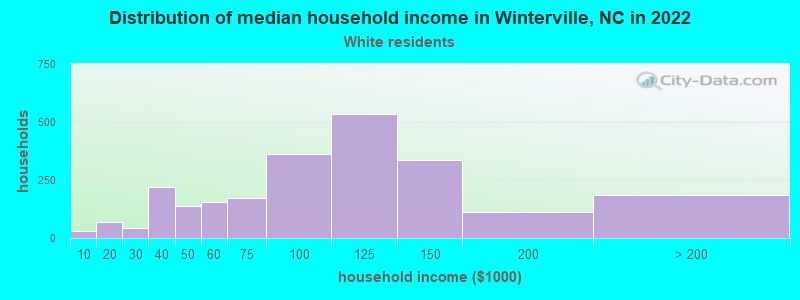
- $97,123White non-Hispanic householders
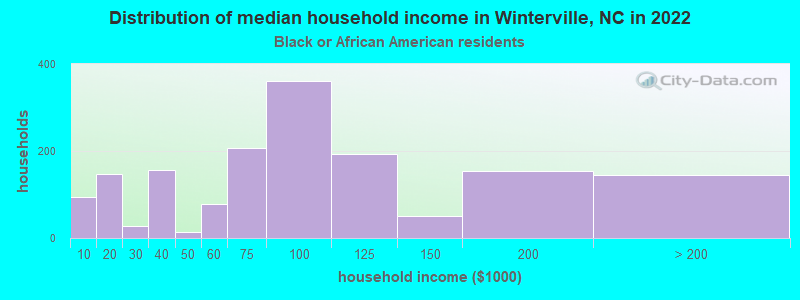
- $90,056Black householders
- $141,371Hispanic or Latino race householders
- Median 2022 house value
- $296,043White Non-Hispanic householders
- $189,176Black or African American householders
- $371,066Asian householders
- $229,386Some other race householders
- $202,400Two or more races householders
- $229,386Hispanic or Latino householders
Household income for White non-Hispanic householders
Household income for Black householders
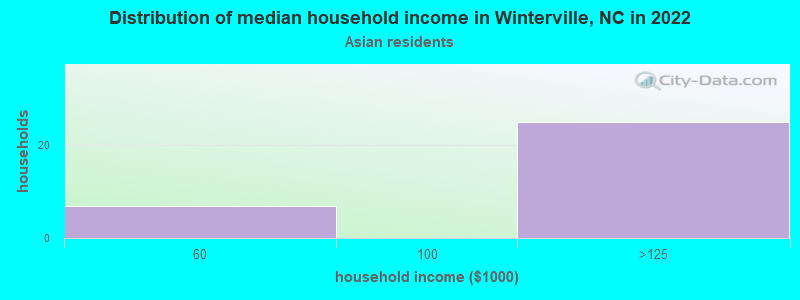
Household income for Asian householders
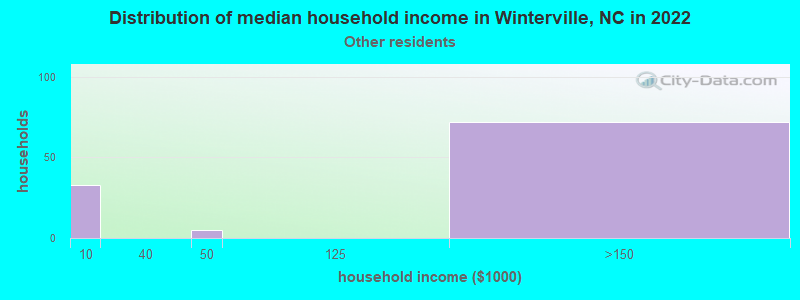
Household income for Some other race householders
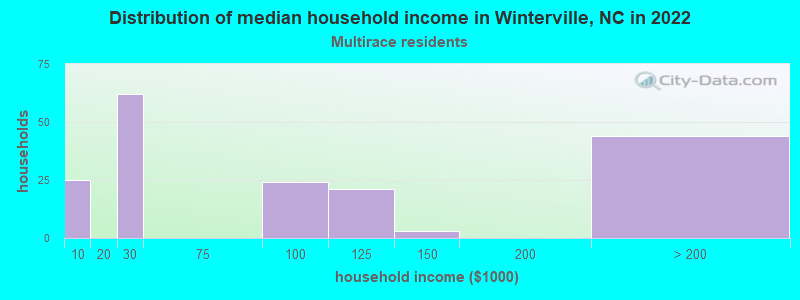
Household income for Two or more races householders
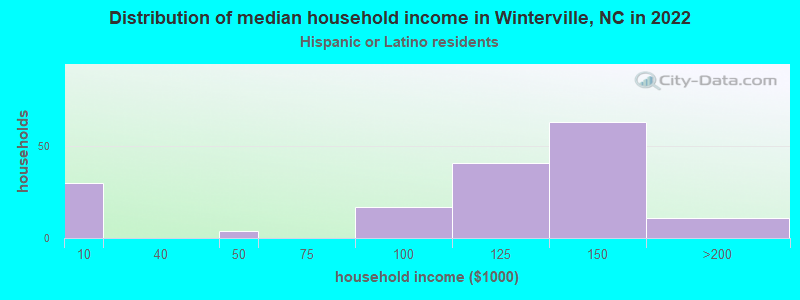
Household income for Hispanic or Latino race householders
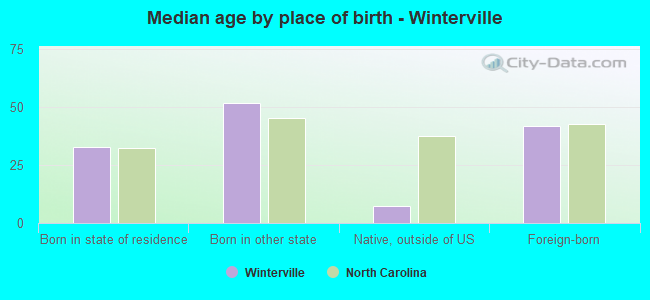
Median age by race in Winterville
- 40.9Median age for White residents
- 40.7Males
- 41.4Females
- 39.2Median age for Black or African American residents
- 34.3Males
- 42.8Females
- -666,666,666.0Median age for American Indian / Alaska Native residents
- -668,604,650.5Males
- -682,971,013.8Females
- 78.7Median age for Asian residents
- -778,816,198.6Males
- 75.8Females
- -666,666,666.0Median age for Native Hawaiian / Pacific Islander residents
- -666,666,666.0Males
- -666,666,666.0Females
- 24.5Median age for Other race residents
- 38.9Males
- 14.9Females
- 18.4Median age for Two or more races residents
- 41.8Males
- 17.5Females
- 39.8Median age for White alone residents
- 40.0Males
- 39.7Females
- 35.0Median age for Hispanic or Latino residents
- 34.3Males
- 19.4Females
Owner/renter occupied households by race in Winterville
- House owners and renters - White residents
- 2,43294.6%Owner occupied
- 1385.4%Renter occupied
- House owners and renters - Black or African American residents
- 1,38377.5%Owner occupied
- 40222.5%Renter occupied
- House owners and renters - Asian residents
- 9100.0%Owner occupied
- House owners and renters - Other race residents
- 5376.2%Owner occupied
- 1723.8%Renter occupied
- House owners and renters - Two or more races residents
- 219100.0%Owner occupied
- House owners and renters - White alone residents
- 2,38394.5%Owner occupied
- 1395.5%Renter occupied
- House owners and renters - Hispanic or Latino residents
- 15190.2%Owner occupied
- 169.8%Renter occupied
Language usage in Winterville
- English speakers - Total
- 90.9% of residents of Winterville speak English at home.
- 4.7% of residents speak Spanish at home
- 22247.0%Speak English very well
- 25053.0%Speak English less than very well
- 4.5% of residents speak other language at home
- 35076.3%Speak English very well
- 10923.7%Speak English less than very well
- English speakers - Born in the United States
- 96.9% of residents of Winterville speak English at home.
- 1.9% of residents speak Spanish at home
- 53100.0%Speak English very well
- 1.6% of residents speak other language at home
- 1636.4%Speak English very well
- 2863.6%Speak English less than very well
- English speakers - Native, born elsewhere
- 29.3% of residents of Winterville speak English at home.
- 2.3% of residents speak Spanish at home
- 10100.0%Speak English very well
- 38.4% of residents speak other language at home
- 169100.0%Speak English very well
- English speakers - Foreign-born
- 58.1% of residents of Winterville speak English at home.
- 32.2% of residents speak Spanish at home
- 4316.3%Speak English very well
- 22083.7%Speak English less than very well
- 16.1% of residents speak other language at home
- 5239.7%Speak English very well
- 7960.3%Speak English less than very well
White (Caucasian) - Speak only English
| Native: | 92.9% (4,977) |
| Foreign-born: | 93.1% (278) |
White (Caucasian) - Speak another language
| Native: | 10.2% (544) |
| Foreign-born: | 22.0% (66) |
Black or African American - Speak only English
| Native: | 100.0% (3,514) |
| Foreign-born: | 100.0% (40) |
Asian - Speak only English
| Native: | 100.0% (5) |
| Foreign-born: | 100.0% (107) |
Other race - Speak another language
| Native: | 79.8% (15) |
| Foreign-born: | 100.0% (166) |
Two or more races - Speak another language
| Native: | 25.0% (102) |
| Foreign-born: | 100.0% (126) |
White alone - Speak only English
| Native: | 94.1% (4,948) |
| Foreign-born: | 84.8% (318) |
White alone - Speak another language
| Native: | 9.3% (488) |
| Foreign-born: | 22.2% (83) |
Hispanic or Latino - Speak another language
| Native: | 75.8% (135) |
| Foreign-born: | 100.0% (274) |
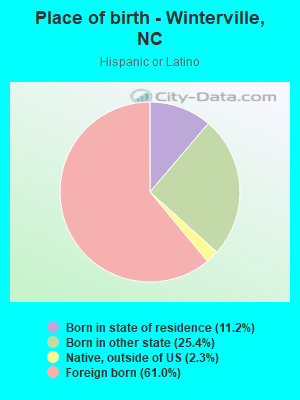
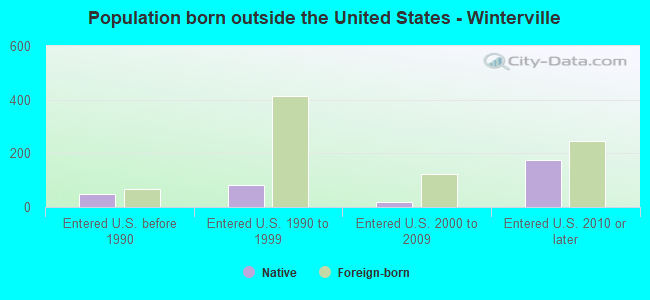
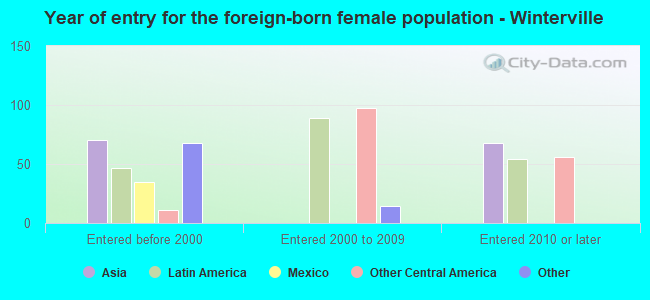
Foreign-born residents in Winterville
664 residents are foreign born (2.7% Latin America, 1.5% Asia, 1.1% North America).
| This city: | 6.2% |
| North Carolina: | 8.3% |
Marital status for residents in Winterville
Marital status - White (Caucasian) population 15 years and over
- Males
- 20.1%Never married
- 60.6%Now married
- 2.3%Separated
- 2.6%Widowed
- 14.4%Divorced
- Females
- 28.6%Never married
- 59.4%Now married
- 0.0%Separated
- 2.7%Widowed
- 9.3%Divorced
Women who gave birth in the past 12 months
| Now married: | 73.8% (92) |
| Unmarried: | 26.2% (33) |
Women who did not give birth in the past 12 months
| Now married: | 50.6% (596) |
| Unmarried: | 49.4% (583) |
Marital status - Black or African American population 15 years and over
- Males
- 52.1%Never married
- 36.6%Now married
- 0.1%Separated
- 1.3%Widowed
- 9.9%Divorced
- Females
- 52.1%Never married
- 29.8%Now married
- 4.9%Separated
- 4.9%Widowed
- 8.4%Divorced
Women who did not give birth in the past 12 months
| Now married: | 15.6% (155) |
| Unmarried: | 84.4% (838) |
Marital status - Asian population 15 years and over
- Males
- 91.7%Never married
- 0.0%Now married
- 0.0%Separated
- 0.0%Widowed
- 8.3%Divorced
- Females
- 0.0%Never married
- 18.1%Now married
- 0.0%Separated
- 72.3%Widowed
- 9.6%Divorced
Women who did not give birth in the past 12 months
| Now married: | 100.0% (8) |
| Unmarried: | 0.0% (0) |
Marital status - Other race population 15 years and over
- Males
- 28.2%Never married
- 71.8%Now married
- 0.0%Separated
- 0.0%Widowed
- 0.0%Divorced
- Females
- 9.3%Never married
- 81.4%Now married
- 9.3%Separated
- 0.0%Widowed
- 0.0%Divorced
Women who did not give birth in the past 12 months
| Now married: | 89.7% (48) |
| Unmarried: | 10.3% (5) |
Marital status - Two or more races population 15 years and over
- Males
- 56.5%Never married
- 27.8%Now married
- 0.0%Separated
- 0.0%Widowed
- 15.7%Divorced
- Females
- 67.9%Never married
- 21.8%Now married
- 0.0%Separated
- 0.0%Widowed
- 10.3%Divorced
Women who gave birth in the past 12 months
| Now married: | 0.0% (0) |
| Unmarried: | 100.0% (22) |
Women who did not give birth in the past 12 months
| Now married: | 22.6% (42) |
| Unmarried: | 77.4% (145) |
Marital status - White alone, not Hispanic / Latino population 15 years and over
- Males
- 19.9%Never married
- 60.5%Now married
- 2.3%Separated
- 2.6%Widowed
- 14.7%Divorced
- Females
- 29.3%Never married
- 58.4%Now married
- 0.0%Separated
- 2.8%Widowed
- 9.5%Divorced
Women who gave birth in the past 12 months
| Now married: | 73.8% (92) |
| Unmarried: | 26.2% (33) |
Women who did not give birth in the past 12 months
| Now married: | 50.1% (584) |
| Unmarried: | 49.9% (581) |
Marital status - Hispanic or Latino population 15 years and over
- Males
- 26.1%Never married
- 73.9%Now married
- 0.0%Separated
- 0.0%Widowed
- 0.0%Divorced
- Females
- 30.2%Never married
- 58.0%Now married
- 2.4%Separated
- 0.0%Widowed
- 9.5%Divorced
Women who gave birth in the past 12 months
| Now married: | 0.0% (0) |
| Unmarried: | 100.0% (19) |
Women who did not give birth in the past 12 months
| Now married: | 51.0% (63) |
| Unmarried: | 49.0% (60) |
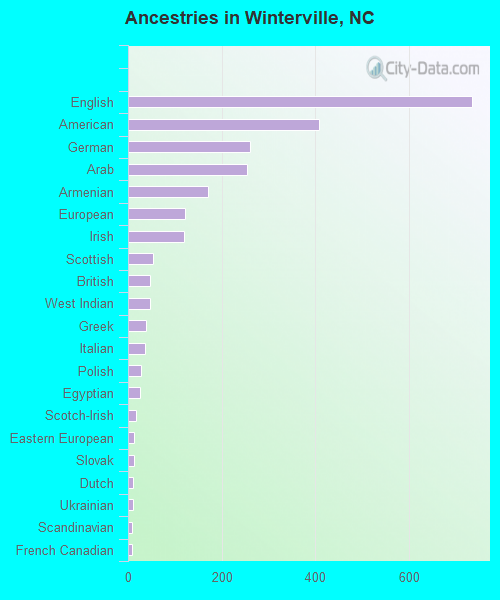
Ancestries in Winterville

- 73415.7%English
- 4088.7%American
- 2605.6%German
- 2535.4%Arab
- 1703.6%Armenian
- 1212.6%European
- 1202.6%Irish
- 531.1%Scottish
- 481.0%British
- 481.0%West Indian
- 390.8%Greek
- 370.8%Italian
- 280.6%Polish
- 260.6%Egyptian
- 180.4%Scotch-Irish
- 130.3%Eastern European
- 120.3%Slovak
- 110.2%Dutch
- 110.2%Ukrainian
- 90.2%Scandinavian
- 80.2%French Canadian
- 60.1%Canadian
- 20.04%African
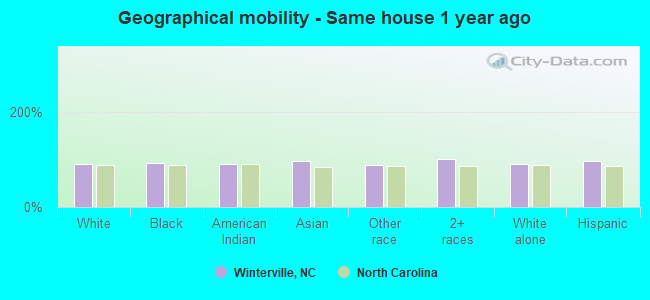
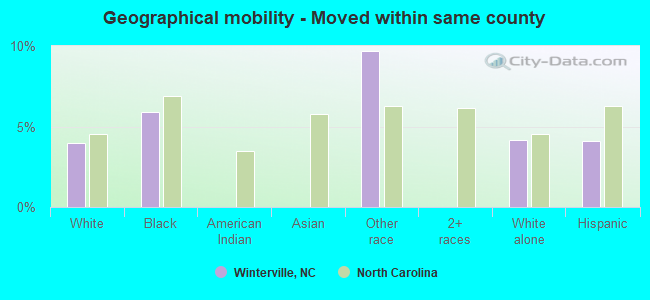
Geographical mobility in Winterville

- Same house 1 year ago
- 5,23490.8%White (Caucasian)
- 3,61191.9%Black or African American
- 890.1%American Indian / Alaska Native
- 10896.2%Asian
- 22087.1%Other race
- 615100.0%Two or more races
- 5,15390.5%White alone, not Hispanic / Latino
- 43795.7%Hispanic or Latino
-
- Moved within same county
- 2284.0%White / Caucasian
- 2315.9%Black or African American
- 259.7%Other race
- 2384.2%White alone, not Hispanic / Latino
- 194.1%Hispanic or Latino
-
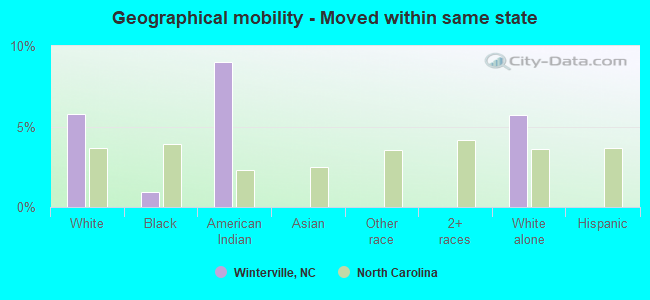
- Moved within same state
- 3325.8%White / Caucasian
- 360.9%Black or African American
- 19.0%American Indian / Alaska Native
- 3275.7%White alone, not Hispanic / Latino
-
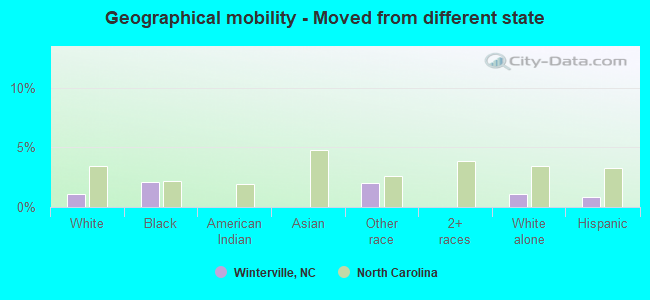
- Moved from different state
- 631.1%White / Caucasian
- 832.1%Black or African American
- 52.0%Other race
- 611.1%White alone, not Hispanic / Latino
- 40.9%Hispanic or Latino
-
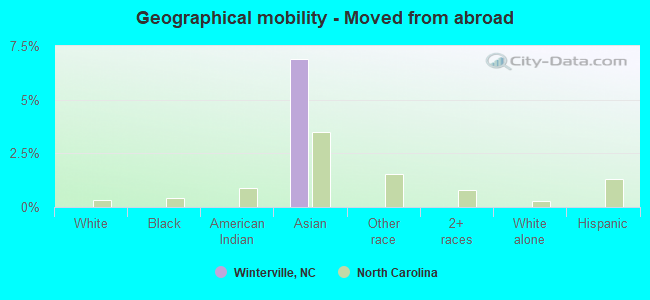
- Moved from abroad
- 86.9%Asian
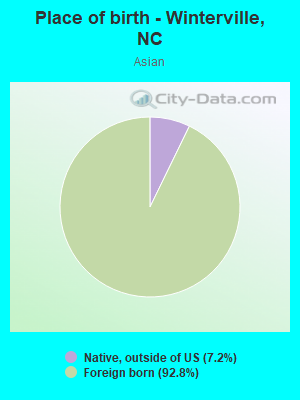
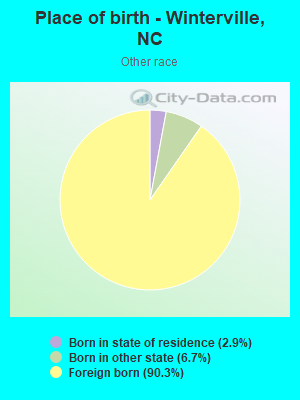
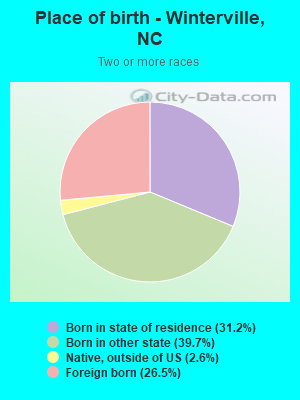
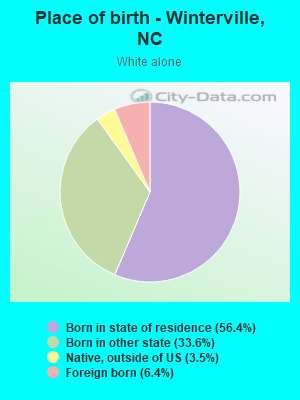
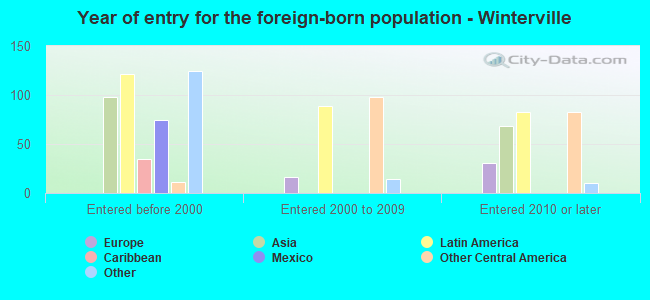
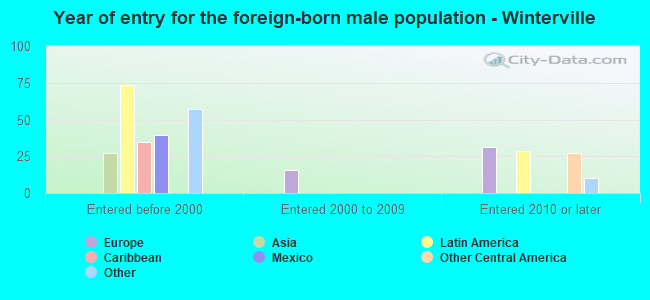
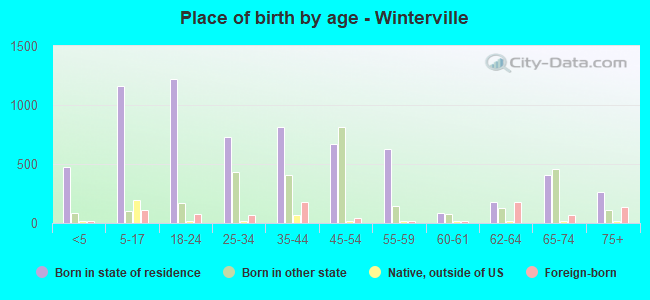
Children Nativity (place of birth) in Winterville
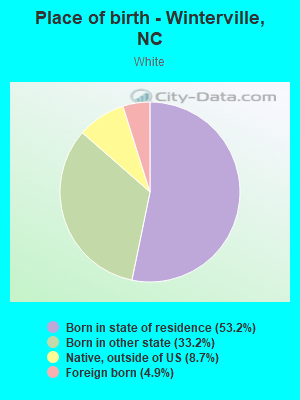
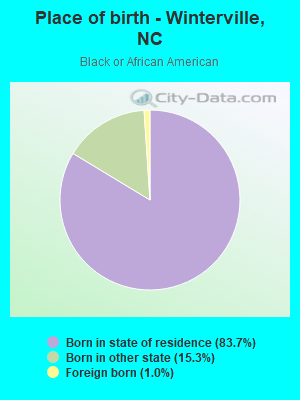
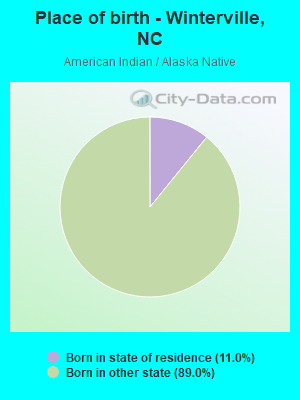
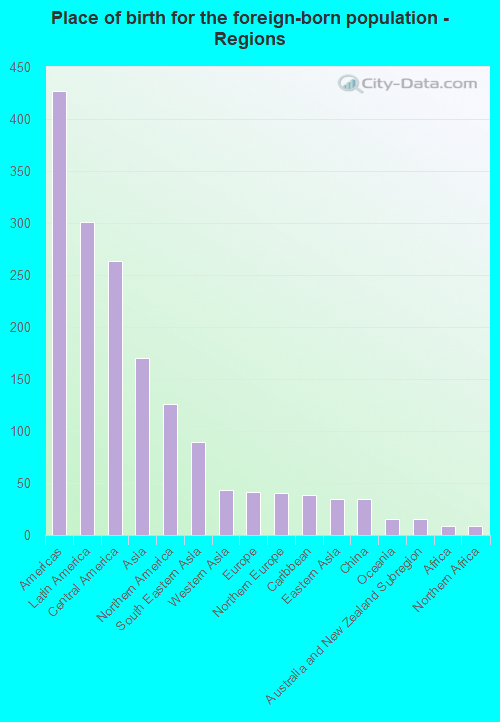
Place of birth for residents in Winterville
![Place of birth for the foreign-born population - Regions]()
- 427Americas
- 301Latin America
- 263Central America
- 170Asia
- 126Northern America
- 89South Eastern Asia
- 43Western Asia
- 41Europe
- 40Northern Europe
- 38Caribbean
- 35Eastern Asia
- 35China
- 15Oceania
- 15Australia and New Zealand Subregion
- 9Africa
- 9Northern Africa
- 1Western Europe
- 1South Central Asia
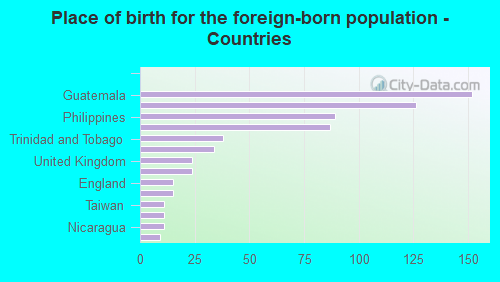
![Place of birth for the foreign-born population - Countries]()
- 152Guatemala
- 126Canada
- 89Philippines
- 87Mexico
- 38Trinidad and Tobago
- 34Yemen
- 24United Kingdom
- 24China
- 15England
- 15New Zealand
- 11Taiwan
- 11Honduras
- 11Nicaragua
- 9Egypt
- 1Germany
- 1India
Grandparents responsible for own grandchildren in Winterville
Zip codes: 28590.