Races in Wisconsin Rapids, Wisconsin (WI) Detailed Stats
Ancestries, Foreign-born residents, place of birth
Settings
X


Recent posts about races in Wisconsin Rapids, Wisconsin on our local forum with over 2,400,000 registered users:
 | Houses in Wisconsin Rapids (5 replies) |
| Considering Moving to Madison-Fitting In (35 replies) |
| What's your favorite Wisconsin city? (44 replies) |
| --The Wisconsin Chat-- (1595 replies) |
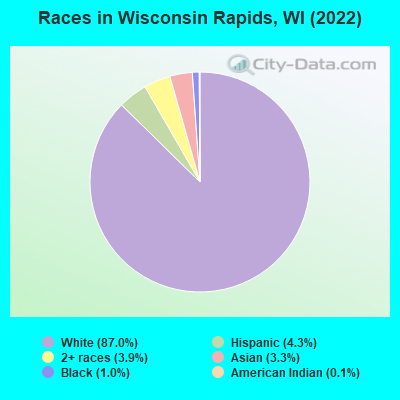
According to 2022 data, the most numerous races in Wisconsin Rapids, WI are White alone (16,315 residents), Hispanic (808 residents), and Black alone (188 residents). 94.9% of Wisconsin Rapids residents speak English at home. 1.8% of Wisconsin Rapids, WI residents are foreign-born , which is 179.0% less than the foreign-born rate of 5.0% across the entire state of Wisconsin.
Race distribution in Wisconsin Rapids
2000
2022

- 17,19593.3%White alone
- 6383.5%Asian alone
- 2421.3%Hispanic
- 1470.8%Two or more races
- 1410.8%American Indian alone
- 630.3%Black alone
- 70.04%Other race alone
- 20.01%Native Hawaiian and Other
Pacific Islander alone

-
- 16,31587.0%White alone
- 8084.3%Hispanic
- 7313.9%Two or more races
- 6173.3%Asian alone
- 1881.0%Black alone
- 250.1%American Indian alone
- 120.06%Other race alone
2000
2022
-
- 4,681,63087.3%White alone
- 300,2455.6%Black alone
- 192,9213.6%Hispanic
- 87,9951.6%Asian alone
- 51,9211.0%Two or more races
- 43,9800.8%American Indian alone
- 3,6370.07%Other race alone
- 1,3460.03%Native Hawaiian and Other
Pacific Islander alone

-
- 4,654,03179.0%White alone
- 447,0227.6%Hispanic
- 345,6785.9%Black alone
- 217,5323.7%Two or more races
- 172,2422.9%Asian alone
- 33,7620.6%American Indian alone
- 19,6800.3%Other race alone
- 2,5920.04%Native Hawaiian and Other
Pacific Islander alone

Income and house value in Wisconsin Rapids
- Median household income in 2022
- $50,267White non-Hispanic householders
- $59,659American Indian and Alaska Native householders
- $96,620Asian householders
- $23,410Some other race householders
- $58,484Two or more races householders
- Median 2022 house value
- $127,595White Non-Hispanic householders
- $112,246American Indian or Alaska Native householders
- $115,575Asian householders
- $110,952Two or more races householders
- $118,904Hispanic or Latino householders
Household income for White non-Hispanic householders

Household income for Black householders

Household income for American Indian and Alaska Native householders

Household income for Asian householders

Household income for Some other race householders

Household income for Two or more races householders

Household income for Hispanic or Latino race householders

Median age by race in Wisconsin Rapids
- 41.4Median age for White residents
- 38.8Males
- 45.7Females
- 22.9Median age for Black or African American residents
- 29.0Males
- 23.9Females
- 26.5Median age for American Indian / Alaska Native residents
- 25.6Males
- -689,393,938.7Females
- 23.2Median age for Asian residents
- 23.0Males
- 27.9Females
- -666,666,666.0Median age for Native Hawaiian / Pacific Islander residents
- -666,666,666.0Males
- -666,666,666.0Females
- 19.7Median age for Other race residents
- 18.5Males
- 16.3Females
- 12.1Median age for Two or more races residents
- 18.1Males
- 9.2Females
- 41.4Median age for White alone residents
- 38.4Males
- 45.9Females
- 30.3Median age for Hispanic or Latino residents
- 31.2Males
- 25.1Females
Owner/renter occupied households by race in Wisconsin Rapids
- House owners and renters - White residents
- 4,77960.6%Owner occupied
- 3,10539.4%Renter occupied
- House owners and renters - Black or African American residents
- 53100.0%Renter occupied
- House owners and renters - American Indian / Alaska Native residents
- 1623.2%Owner occupied
- 5276.8%Renter occupied
- House owners and renters - Asian residents
- 7135.9%Owner occupied
- 12764.1%Renter occupied
- House owners and renters - Other race residents
- 99.6%Owner occupied
- 8990.4%Renter occupied
- House owners and renters - Two or more races residents
- 98.4%Owner occupied
- 9391.6%Renter occupied
- House owners and renters - White alone residents
- 4,69060.0%Owner occupied
- 3,13040.0%Renter occupied
- House owners and renters - Hispanic or Latino residents
- 11858.4%Owner occupied
- 8441.6%Renter occupied
Language usage in Wisconsin Rapids
- English speakers - Total
- 94.9% of residents of Wisconsin Rapids speak English at home.
- 0.9% of residents speak Spanish at home
- 12882.6%Speak English very well
- 2717.4%Speak English less than very well
- 4.2% of residents speak other language at home
- 59279.1%Speak English very well
- 15620.9%Speak English less than very well
- English speakers - Born in the United States
- 95.2% of residents of Wisconsin Rapids speak English at home.
- 1.7% of residents speak Spanish at home
- 3769.8%Speak English very well
- 1630.2%Speak English less than very well
- 3.1% of residents speak other language at home
- 7072.9%Speak English very well
- 2627.1%Speak English less than very well
All residents speak only English at home
- English speakers - Foreign-born
- 25.0% of residents of Wisconsin Rapids speak English at home.
- 3.3% of residents speak Spanish at home
- 11100.0%Speak English less than very well
- 71.4% of residents speak other language at home
- 14660.8%Speak English very well
- 9439.2%Speak English less than very well
White (Caucasian) - Speak only English
| Native: | 98.7% (15,472) |
| Foreign-born: | 49.0% (37) |
Asian - Speak only English
| Native: | 5.4% (25) |
| Foreign-born: | 3.0% (7) |
Asian - Speak another language
| Native: | 87.4% (400) |
| Foreign-born: | 98.6% (240) |
Other race - Speak only English
| Native: | 88.9% (172) |
| Foreign-born: | 90.3% (40) |
Other race - Speak another language
| Native: | 23.9% (46) |
| Foreign-born: | 19.8% (9) |
White alone - Speak only English
| Native: | 98.4% (15,260) |
| Foreign-born: | 45.4% (40) |
Hispanic or Latino - Speak only English
| Native: | 86.2% (407) |
| Foreign-born: | 100.0% (51) |
Hispanic or Latino - Speak another language
| Native: | 13.8% (65) |
| Foreign-born: | 20.3% (10) |
Foreign-born residents in Wisconsin Rapids
336 residents are foreign born
| This city: | 1.8% |
| Wisconsin: | 5.0% |


Marital status for residents in Wisconsin Rapids
Marital status - White (Caucasian) population 15 years and over
- Males
- 36.4%Never married
- 46.2%Now married
- 0.5%Separated
- 3.4%Widowed
- 13.4%Divorced
- Females
- 33.7%Never married
- 33.2%Now married
- 1.7%Separated
- 13.0%Widowed
- 18.3%Divorced
Women who gave birth in the past 12 months
| Now married: | 17.9% (48) |
| Unmarried: | 82.1% (220) |
Women who did not give birth in the past 12 months
| Now married: | 33.1% (1,188) |
| Unmarried: | 66.9% (2,406) |
Marital status - Black or African American population 15 years and over
- Males
- 60.3%Never married
- 24.7%Now married
- 0.0%Separated
- 0.0%Widowed
- 15.1%Divorced
- Females
- 40.0%Never married
- 0.0%Now married
- 0.0%Separated
- 0.0%Widowed
- 60.0%Divorced
Women who did not give birth in the past 12 months
| Now married: | 0.0% (0) |
| Unmarried: | 100.0% (17) |
Marital status - American Indian / Alaska Native population 15 years and over
- Males
- 46.9%Never married
- 43.8%Now married
- 0.0%Separated
- 0.0%Widowed
- 9.4%Divorced
- Females
- 10.2%Never married
- 89.8%Now married
- 0.0%Separated
- 0.0%Widowed
- 0.0%Divorced
Women who did not give birth in the past 12 months
| Now married: | 89.8% (50) |
| Unmarried: | 10.2% (6) |
Marital status - Asian population 15 years and over
- Males
- 56.4%Never married
- 43.6%Now married
- 0.0%Separated
- 0.0%Widowed
- 0.0%Divorced
- Females
- 3.2%Never married
- 38.9%Now married
- 0.0%Separated
- 15.0%Widowed
- 42.9%Divorced
Women who gave birth in the past 12 months
| Now married: | 0.0% (0) |
| Unmarried: | 100.0% (12) |
Women who did not give birth in the past 12 months
| Now married: | 52.1% (73) |
| Unmarried: | 47.9% (67) |
Marital status - Other race population 15 years and over
- Males
- 47.3%Never married
- 43.0%Now married
- 0.0%Separated
- 0.0%Widowed
- 9.7%Divorced
- Females
- 0.0%Never married
- 0.0%Now married
- 0.0%Separated
- 0.0%Widowed
- 100.0%Divorced
Women who did not give birth in the past 12 months
| Now married: | 0.0% (0) |
| Unmarried: | 100.0% (41) |
Marital status - Two or more races population 15 years and over
- Males
- 60.9%Never married
- 32.8%Now married
- 6.3%Separated
- 0.0%Widowed
- 0.0%Divorced
- Females
- 68.9%Never married
- 29.3%Now married
- 0.0%Separated
- 0.0%Widowed
- 1.8%Divorced
Women who did not give birth in the past 12 months
| Now married: | 22.6% (49) |
| Unmarried: | 77.4% (168) |
Marital status - White alone, not Hispanic / Latino population 15 years and over
- Males
- 36.4%Never married
- 47.1%Now married
- 0.6%Separated
- 3.4%Widowed
- 12.5%Divorced
- Females
- 32.9%Never married
- 33.8%Now married
- 1.8%Separated
- 13.3%Widowed
- 18.1%Divorced
Women who gave birth in the past 12 months
| Now married: | 17.9% (48) |
| Unmarried: | 82.1% (221) |
Women who did not give birth in the past 12 months
| Now married: | 34.0% (1,190) |
| Unmarried: | 66.0% (2,307) |
Marital status - Hispanic or Latino population 15 years and over
- Males
- 51.8%Never married
- 17.5%Now married
- 0.0%Separated
- 0.0%Widowed
- 30.7%Divorced
- Females
- 41.8%Never married
- 27.1%Now married
- 0.0%Separated
- 0.0%Widowed
- 31.1%Divorced
Women who did not give birth in the past 12 months
| Now married: | 26.7% (60) |
| Unmarried: | 73.3% (166) |
Ancestries in Wisconsin Rapids

- 3,05435.9%German
- 1,05912.4%American
- 87310.3%Polish
- 3283.9%English
- 2643.1%Dutch
- 2482.9%Norwegian
- 2382.8%Irish
- 1802.1%Italian
- 1161.4%European
- 680.8%French
- 390.5%Danish
- 390.5%French Canadian
- 280.3%Swedish
- 220.3%Lebanese
- 220.3%Greek
- 170.2%Czech
- 130.2%Finnish
- 110.1%Haitian
- 100.1%Belgian
- 100.1%British
- 40.05%African
- 20.02%Portuguese

Geographical mobility in Wisconsin Rapids

- Same house 1 year ago
- 13,44982.5%White (Caucasian)
- 14776.5%Black or African American
- 2722.7%American Indian / Alaska Native
- 65187.1%Asian
- 22294.9%Other race
- 63468.3%Two or more races
- 13,29482.4%White alone, not Hispanic / Latino
- 58674.2%Hispanic or Latino

-
- Moved within same county
- 1,3608.3%White / Caucasian
- 94.6%Black or African American
- 7260.8%American Indian / Alaska Native
- 7910.6%Asian
- 31.2%Other race
- 15016.1%Two or more races
- 1,3408.3%White alone, not Hispanic / Latino
- 16520.9%Hispanic or Latino

-
- Moved within same state
- 7344.5%White / Caucasian
- 21.1%Black or African American
- 707.6%Two or more races
- 7704.8%White alone, not Hispanic / Latino

-
- Moved from different state
- 2771.7%White / Caucasian
- 4020.7%Black or African American
- 86.8%American Indian / Alaska Native
- 576.1%Two or more races
- 2811.7%White alone, not Hispanic / Latino
- 172.1%Hispanic or Latino

-
- Moved from abroad
- 20.0%White
- 20.0%White alone, not Hispanic / Latino

Children Nativity (place of birth) in Wisconsin Rapids
Place of birth for residents in Wisconsin Rapids
![Place of birth for the foreign-born population - Regions]()
- 241Asia
- 222South Eastern Asia
- 50Americas
- 49Latin America
- 49Central America
- 43Europe
- 43Northern Europe
- 18South Central Asia

![Place of birth for the foreign-born population - Countries]()
- 118Laos
- 69Thailand
- 49Mexico
- 33Philippines
- 24England
- 18United Kingdom
- 18India

Grandparents responsible for own grandchildren in Wisconsin Rapids
Zip codes: 54494.