Races in Woodfield, South Carolina (SC) Detailed Stats
Data:
Races - White alone (%)
Races - White alone (% change since 2000)
Races - Black alone (%)
Races - Black alone (% change since 2000)
Races - American Indian alone (%)
Races - American Indian alone (% change since 2000)
Races - Asian alone (%)
Races - Asian alone (% change since 2000)
Races - Hispanic (%)
Races - Hispanic (% change since 2000)
Races - Native Hawaiian and Other Pacific Islander alone (%)
Races - Native Hawaiian and Other Pacific Islander alone (% change since 2000)
Races - Two or more races(%)
Races - Two or more races(% change since 2000)
Races - Other race alone (%)
Races - Other race alone (% change since 2000)
Racial diversity
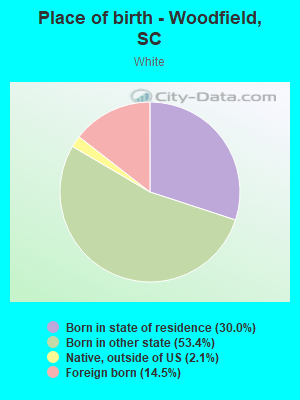
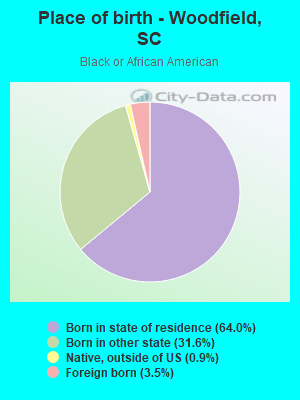
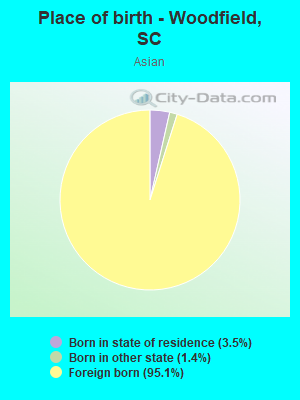
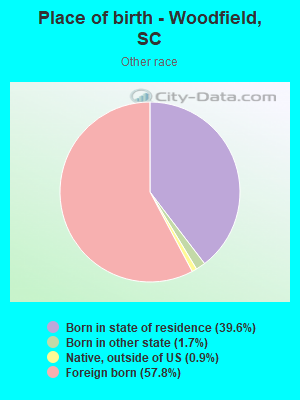
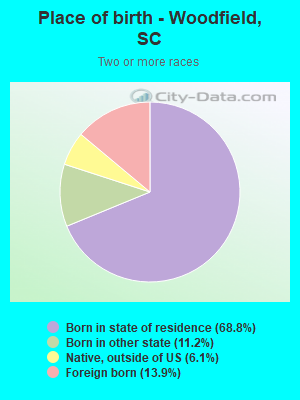
Place of birth - Born in state of residence (%)
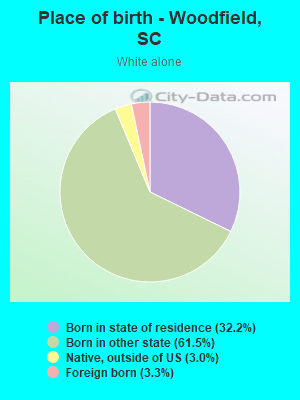
Place of birth - Born in state of residence (%) - White
Place of birth - Born in state of residence (%) - Black or African American
Place of birth - Born in state of residence (%) - Asian
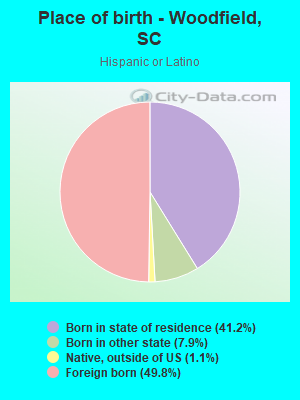
Place of birth - Born in state of residence (%) - Hispanic or Latino
Place of birth - Born in state of residence (%) - American Indian and Alaska Native
Place of birth - Born in state of residence (%) - Multirace
Place of birth - Born in state of residence (%) - Other Race
Place of birth - Born in other state (%)
Place of birth - Born in other state (%) - White
Place of birth - Born in other state (%) - Black or African American
Place of birth - Born in other state (%) - Asian
Place of birth - Born in other state (%) - Hispanic or Latino
Place of birth - Born in other state (%) - American Indian and Alaska Native
Place of birth - Born in other state (%) - Multirace
Place of birth - Born in other state (%) - Other Race
Place of birth - Native, outside of US (%)
Place of birth - Native, outside of US (%) - White
Place of birth - Native, outside of US (%) - Black or African American
Place of birth - Native, outside of US (%) - Asian
Place of birth - Native, outside of US (%) - Hispanic or Latino
Place of birth - Native, outside of US (%) - American Indian and Alaska Native
Place of birth - Native, outside of US (%) - Multirace
Place of birth - Native, outside of US (%) - Other Race
Place of birth - Foreign born (%)
Place of birth - Foreign born (%) - White
Place of birth - Foreign born (%) - Black or African American
Place of birth - Foreign born (%) - Asian
Place of birth - Foreign born (%) - Hispanic or Latino
Place of birth - Foreign born (%) - American Indian and Alaska Native
Place of birth - Foreign born (%) - Multirace
Place of birth - Foreign born (%) - Other Race
Residents speaking English at home (%)
Residents speaking English at home - Born in the United States (%)
Residents speaking English at home - Native, born elsewhere (%)
Residents speaking English at home - Foreign born (%)
Residents speaking Spanish at home (%)
Residents speaking Spanish at home - Born in the United States (%)
Residents speaking Spanish at home - Native, born elsewhere (%)
Residents speaking Spanish at home - Foreign born (%)
Residents speaking other language at home (%)
Residents speaking other language at home - Born in the United States (%)
Residents speaking other language at home - Native, born elsewhere (%)
Residents speaking other language at home - Foreign born (%)
Marital status - Never married (%)
Marital status - Now married (%)
Marital status - Separated (%)
Marital status - Widowed (%)
Marital status - Divorced (%)
Ancestries Reported - Arab (%)
Ancestries Reported - Czech (%)
Ancestries Reported - Danish (%)
Ancestries Reported - Dutch (%)
Ancestries Reported - English (%)
Ancestries Reported - French (%)
Ancestries Reported - French Canadian (%)
Ancestries Reported - German (%)
Ancestries Reported - Greek (%)
Ancestries Reported - Hungarian (%)
Ancestries Reported - Irish (%)
Ancestries Reported - Italian (%)
Ancestries Reported - Lithuanian (%)
Ancestries Reported - Norwegian (%)
Ancestries Reported - Polish (%)
Ancestries Reported - Portuguese (%)
Ancestries Reported - Russian (%)
Ancestries Reported - Scotch-Irish (%)
Ancestries Reported - Scottish (%)
Ancestries Reported - Slovak (%)
Ancestries Reported - Subsaharan African (%)
Ancestries Reported - Swedish (%)
Ancestries Reported - Swiss (%)
Ancestries Reported - Ukrainian (%)
Ancestries Reported - United States (%)
Ancestries Reported - Welsh (%)
Ancestries Reported - West Indian (%)
Ancestries Reported - Other (%)
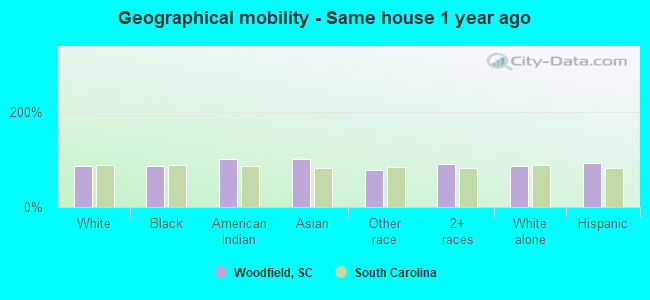
Geographical mobility - Same house 1 year ago (%)
Geographical mobility - Same house 1 year ago (%) - White
Geographical mobility - Same house 1 year ago (%) - Black or African American
Geographical mobility - Same house 1 year ago (%) - Asian
Geographical mobility - Same house 1 year ago (%) - Hispanic or Latino
Geographical mobility - Same house 1 year ago (%) - American Indian and Alaska Native
Geographical mobility - Same house 1 year ago (%) - Multirace
Geographical mobility - Same house 1 year ago (%) - Other Race
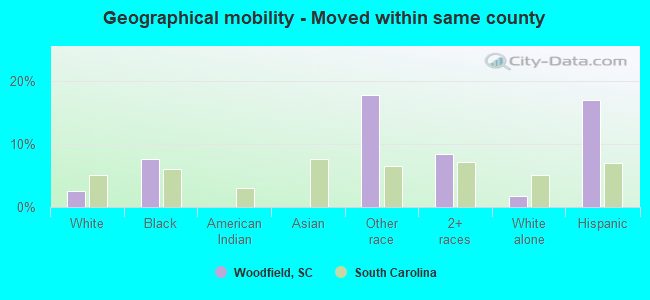
Geographical mobility - Moved within same county (%)
Geographical mobility - Moved within same county (%) - White
Geographical mobility - Moved within same county (%) - Black or African American
Geographical mobility - Moved within same county (%) - Asian
Geographical mobility - Moved within same county (%) - Hispanic or Latino
Geographical mobility - Moved within same county (%) - American Indian and Alaska Native
Geographical mobility - Moved within same county (%) - Multirace
Geographical mobility - Moved within same county (%) - Other Race
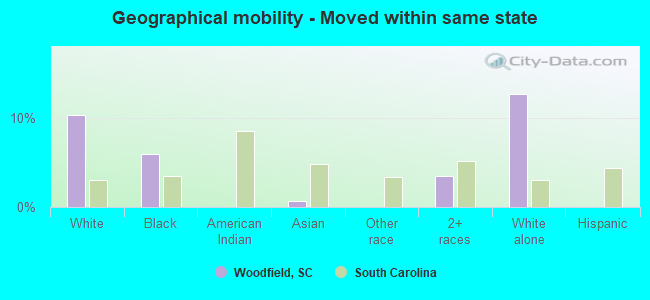
Geographical mobility - Moved from different county within same state (%)
Geographical mobility - Moved from different county within same state (%) - White
Geographical mobility - Moved from different county within same state (%) - Black or African American
Geographical mobility - Moved from different county within same state (%) - Asian
Geographical mobility - Moved from different county within same state (%) - Hispanic or Latino
Geographical mobility - Moved from different county within same state (%) - American Indian and Alaska Native
Geographical mobility - Moved from different county within same state (%) - Multirace
Geographical mobility - Moved from different county within same state (%) - Other Race
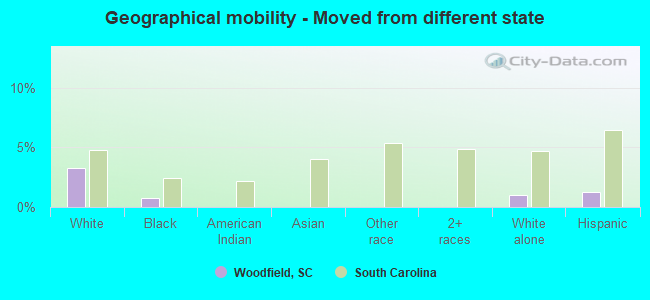
Geographical mobility - Moved from different state (%)
Geographical mobility - Moved from different state (%) - White
Geographical mobility - Moved from different state (%) - Black or African American
Geographical mobility - Moved from different state (%) - Asian
Geographical mobility - Moved from different state (%) - Hispanic or Latino
Geographical mobility - Moved from different state (%) - American Indian and Alaska Native
Geographical mobility - Moved from different state (%) - Multirace
Geographical mobility - Moved from different state (%) - Other Race
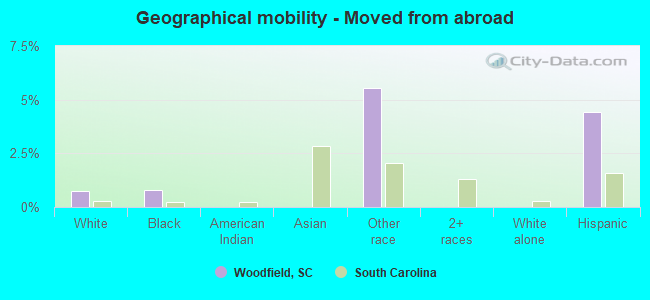
Geographical mobility - Moved from abroad (%)
Geographical mobility - Moved from abroad (%) - White
Geographical mobility - Moved from abroad (%) - Black or African American
Geographical mobility - Moved from abroad (%) - Asian
Geographical mobility - Moved from abroad (%) - Hispanic or Latino
Geographical mobility - Moved from abroad (%) - American Indian and Alaska Native
Geographical mobility - Moved from abroad (%) - Multirace
Geographical mobility - Moved from abroad (%) - Other Race
Place of birth for the foreign-born population - Ireland (%)
Place of birth for the foreign-born population - Denmark (%)
Place of birth for the foreign-born population - Norway (%)
Place of birth for the foreign-born population - Sweden (%)
Place of birth for the foreign-born population - United Kingdom (%)
Place of birth for the foreign-born population - England (%)
Place of birth for the foreign-born population - Scotland (%)
Place of birth for the foreign-born population - Other Northern Europe (%)
Place of birth for the foreign-born population - Austria (%)
Place of birth for the foreign-born population - Belgium (%)
Place of birth for the foreign-born population - France (%)
Place of birth for the foreign-born population - Germany (%)
Place of birth for the foreign-born population - Netherlands (%)
Place of birth for the foreign-born population - Switzerland (%)
Place of birth for the foreign-born population - Other Western Europe (%)
Place of birth for the foreign-born population - Greece (%)
Place of birth for the foreign-born population - Italy (%)
Place of birth for the foreign-born population - Portugal (%)
Place of birth for the foreign-born population - Spain (%)
Place of birth for the foreign-born population - Other Southern Europe (%)
Place of birth for the foreign-born population - Albania (%)
Place of birth for the foreign-born population - Belarus (%)
Place of birth for the foreign-born population - Bosnia and Herzegovina (%)
Place of birth for the foreign-born population - Bulgaria (%)
Place of birth for the foreign-born population - Croatia (%)
Place of birth for the foreign-born population - Czechoslovakia (%)
Place of birth for the foreign-born population - Hungary (%)
Place of birth for the foreign-born population - Latvia (%)
Place of birth for the foreign-born population - Lithuania (%)
Place of birth for the foreign-born population - North Macedonia (Macedonia) (%)
Place of birth for the foreign-born population - Moldova (%)
Place of birth for the foreign-born population - Poland (%)
Place of birth for the foreign-born population - Romania (%)
Place of birth for the foreign-born population - Russia (%)
Place of birth for the foreign-born population - Serbia (%)
Place of birth for the foreign-born population - Ukraine (%)
Place of birth for the foreign-born population - Other Eastern Europe (%)
Place of birth for the foreign-born population - China (%)
Place of birth for the foreign-born population - Hong Kong (%)
Place of birth for the foreign-born population - Taiwan (%)
Place of birth for the foreign-born population - Japan (%)
Place of birth for the foreign-born population - Korea (%)
Place of birth for the foreign-born population - Other Eastern Asia (%)
Place of birth for the foreign-born population - Afghanistan (%)
Place of birth for the foreign-born population - Bangladesh (%)
Place of birth for the foreign-born population - India (%)
Place of birth for the foreign-born population - Iran (%)
Place of birth for the foreign-born population - Kazakhstan (%)
Place of birth for the foreign-born population - Nepal (%)
Place of birth for the foreign-born population - Pakistan (%)
Place of birth for the foreign-born population - Sri Lanka (%)
Place of birth for the foreign-born population - Uzbekistan (%)
Place of birth for the foreign-born population - Other South Central Asia (%)
Place of birth for the foreign-born population - Burma (%)
Place of birth for the foreign-born population - Cambodia (%)
Place of birth for the foreign-born population - Indonesia (%)
Place of birth for the foreign-born population - Laos (%)
Place of birth for the foreign-born population - Malaysia (%)
Place of birth for the foreign-born population - Philippines (%)
Place of birth for the foreign-born population - Singapore (%)
Place of birth for the foreign-born population - Thailand (%)
Place of birth for the foreign-born population - Vietnam (%)
Place of birth for the foreign-born population - Other South Eastern Asia (%)
Place of birth for the foreign-born population - Armenia (%)
Place of birth for the foreign-born population - Iraq (%)
Place of birth for the foreign-born population - Israel (%)
Place of birth for the foreign-born population - Jordan (%)
Place of birth for the foreign-born population - Kuwait (%)
Place of birth for the foreign-born population - Lebanon (%)
Place of birth for the foreign-born population - Saudi Arabia (%)
Place of birth for the foreign-born population - Syria (%)
Place of birth for the foreign-born population - Turkey (%)
Place of birth for the foreign-born population - Yemen (%)
Place of birth for the foreign-born population - Other Western Asia (%)
Place of birth for the foreign-born population - Eritrea (%)
Place of birth for the foreign-born population - Ethiopia (%)
Place of birth for the foreign-born population - Kenya (%)
Place of birth for the foreign-born population - Somalia (%)
Place of birth for the foreign-born population - Uganda (%)
Place of birth for the foreign-born population - Zimbabwe (%)
Place of birth for the foreign-born population - Other Eastern Africa (%)
Place of birth for the foreign-born population - Cameroon (%)
Place of birth for the foreign-born population - Congo (%)
Place of birth for the foreign-born population - Democratic Republic of Congo (Zaire) (%)
Place of birth for the foreign-born population - Other Middle Africa (%)
Place of birth for the foreign-born population - Egypt (%)
Place of birth for the foreign-born population - Morocco (%)
Place of birth for the foreign-born population - Sudan (%)
Place of birth for the foreign-born population - Other Northern Africa (%)
Place of birth for the foreign-born population - South Africa (%)
Place of birth for the foreign-born population - Other Southern Africa (%)
Place of birth for the foreign-born population - Cabo Verde (%)
Place of birth for the foreign-born population - Ghana (%)
Place of birth for the foreign-born population - Liberia (%)
Place of birth for the foreign-born population - Nigeria (%)
Place of birth for the foreign-born population - Senegal (%)
Place of birth for the foreign-born population - Sierra Leone (%)
Place of birth for the foreign-born population - Other Western Africa (%)
Place of birth for the foreign-born population - Australia (%)
Place of birth for the foreign-born population - New Zealand (%)
Place of birth for the foreign-born population - Fiji (%)
Place of birth for the foreign-born population - Micronesia (%)
Place of birth for the foreign-born population - Bahamas (%)
Place of birth for the foreign-born population - Barbados (%)
Place of birth for the foreign-born population - Cuba (%)
Place of birth for the foreign-born population - Dominica (%)
Place of birth for the foreign-born population - Dominican Republic (%)
Place of birth for the foreign-born population - Grenada (%)
Place of birth for the foreign-born population - Haiti (%)
Place of birth for the foreign-born population - Jamaica (%)
Place of birth for the foreign-born population - St. Vincent and the Grenadines (%)
Place of birth for the foreign-born population - Trinidad and Tobago (%)
Place of birth for the foreign-born population - West Indies (%)
Place of birth for the foreign-born population - Other Caribbean (%)
Place of birth for the foreign-born population - Belize (%)
Place of birth for the foreign-born population - Costa Rica (%)
Place of birth for the foreign-born population - El Salvador (%)
Place of birth for the foreign-born population - Guatemala (%)
Place of birth for the foreign-born population - Honduras (%)
Place of birth for the foreign-born population - Mexico (%)
Place of birth for the foreign-born population - Nicaragua (%)
Place of birth for the foreign-born population - Panama (%)
Place of birth for the foreign-born population - Other Central America (%)
Place of birth for the foreign-born population - Argentina (%)
Place of birth for the foreign-born population - Bolivia (%)
Place of birth for the foreign-born population - Brazil (%)
Place of birth for the foreign-born population - Chile (%)
Place of birth for the foreign-born population - Colombia (%)
Place of birth for the foreign-born population - Ecuador (%)
Place of birth for the foreign-born population - Guyana (%)
Place of birth for the foreign-born population - Peru (%)
Place of birth for the foreign-born population - Uruguay (%)
Place of birth for the foreign-born population - Venezuela (%)
Place of birth for the foreign-born population - Other South America (%)
Place of birth for the foreign-born population - Canada (%)
Place of birth for the foreign-born population - Other Northern America (%)
Place of birth for the foreign-born population - Other (%)
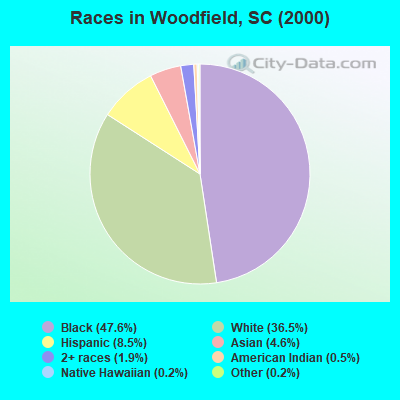
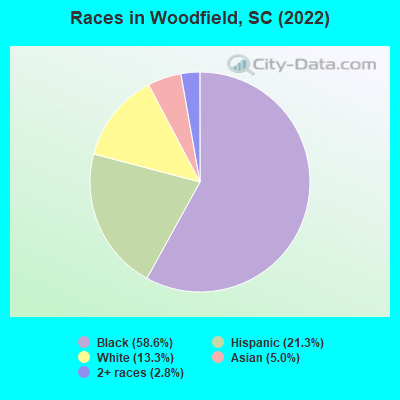
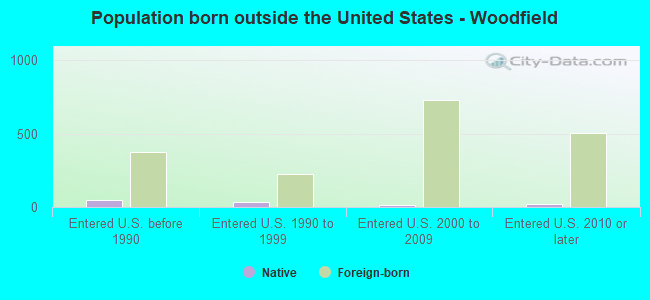
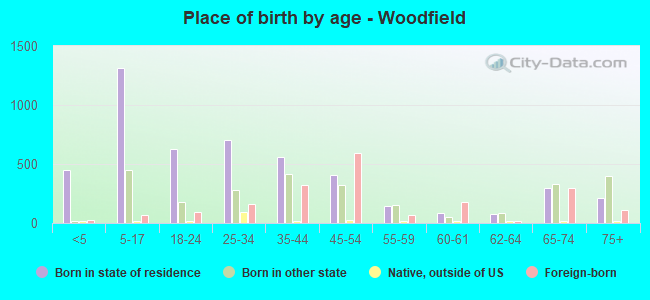
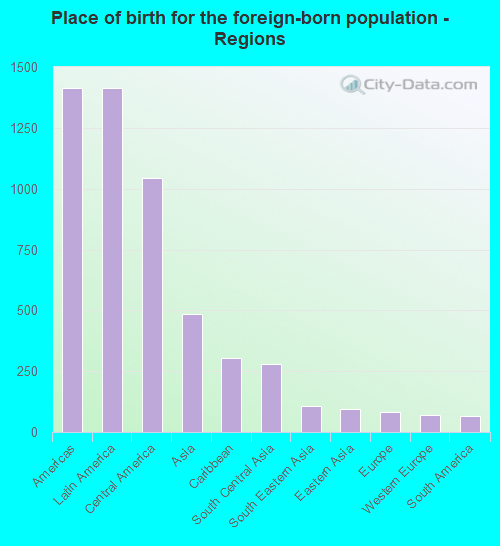
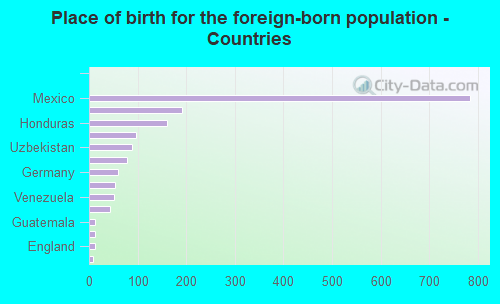
According to 2022 data, the most numerous races in Woodfield, SC are White alone (1,274 residents), Black alone (5,616 residents), and Hispanic (2,038 residents). 75.1% of Woodfield residents speak English at home. 20.6% of Woodfield, SC residents are foreign-born (14.7% born in Latin America, 5.0% born in Asia), which is 75.8% greater than the foreign-born rate of 5.0% across the entire state of South Carolina.
Race distribution in Woodfield
2000 2022
2,652,291 66.1% White alone 1,178,486 29.4% Black alone 95,076 2.4% Hispanic 35,568 0.9% Asian alone 33,290 0.8% Two or more races 12,765 0.3% American Indian alone 3,266 0.08% Other race alone 1,270 0.03% Native Hawaiian and Other
3,301,739 62.5% White alone 1,313,290 24.9% Black alone 343,783 6.5% Hispanic 190,508 3.6% Two or more races 89,888 1.7% Asian alone 29,390 0.6% Other race alone 12,112 0.2% American Indian alone 1,924 0.04% Native Hawaiian and Other
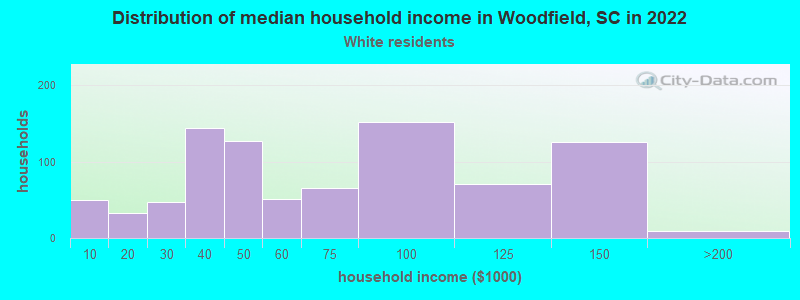
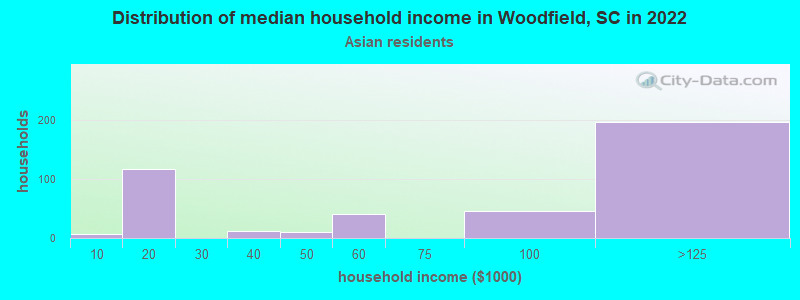
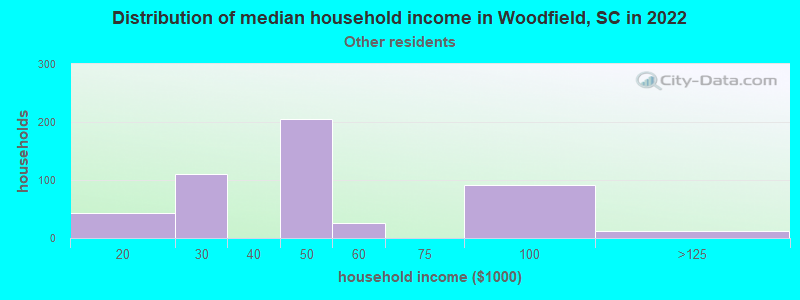
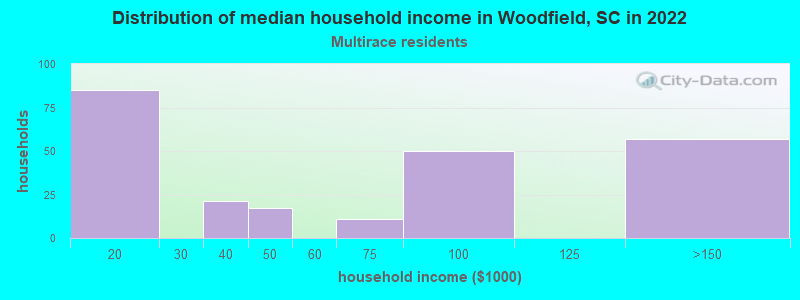
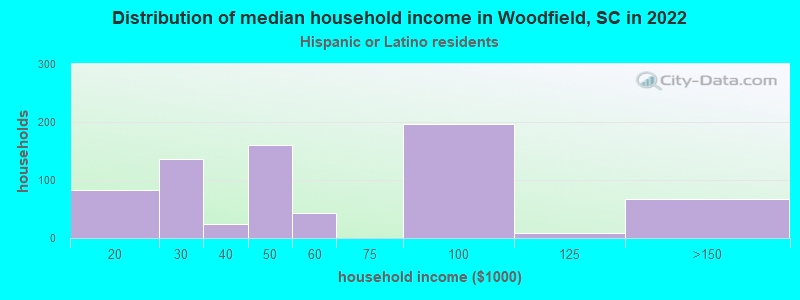
Income and house value in Woodfield Median household income in 2022 $53,782 White non-Hispanic householders$35,155 Black householders$131,649 Asian householders$56,154 Some other race householders$47,938 Hispanic or Latino race householdersMedian 2022 house value $131,446 White Non-Hispanic householders$150,901 Black or African American householders$101,301 American Indian or Alaska Native householders $136,704 Asian householders$140,735 Some other race householders$139,158 Two or more races householders$124,436 Hispanic or Latino householders
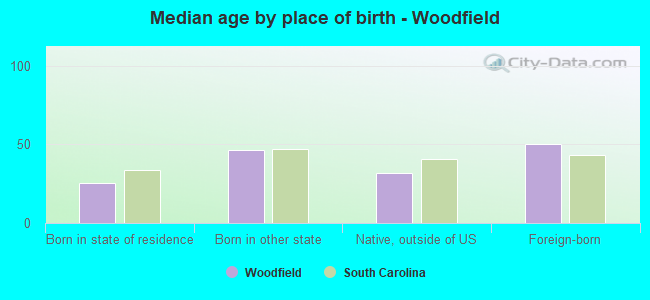
Median age by race in Woodfield
61.1 Median age for White residents61.1 58.4 32.3 Median age for Black or African American residents27.6 39.3 -373,815,675.8 Median age for American Indian / Alaska Native residents-364,102,563.7 -712,765,956.7 91.0 Median age for Asian residents44.0 89.2 -698,412,697.7 Median age for Native Hawaiian / Pacific Islander residents-551,574,375.1 -1,016,109,044.8 24.4 Median age for Other race residents31.7 13.3 35.2 Median age for Two or more races residents34.1 35.4 66.1 Median age for White alone residents66.8 61.5 28.3 Median age for Hispanic or Latino residents34.7 21.6
Owner/renter occupied households by race in Woodfield
House owners and renters - White residents 633 72.3% Owner occupied243 27.7% Renter occupiedHouse owners and renters - Black or African American residents 878 36.1% Owner occupied1,555 63.9% Renter occupiedHouse owners and renters - Asian residents 435 100.0% Owner occupiedHouse owners and renters - Other race residents 268 68.4% Owner occupied124 31.6% Renter occupiedHouse owners and renters - Two or more races residents 55 28.4% Owner occupied140 71.6% Renter occupiedHouse owners and renters - White alone residents 503 68.1% Owner occupied236 31.9% Renter occupiedHouse owners and renters - Hispanic or Latino residents 452 60.1% Owner occupied301 39.9% Renter occupied
Language usage in Woodfield
English speakers - Total 75.1% of residents of Woodfield speak English at home.
15.5% of residents speak Spanish at home 845 59.9% Speak English very well565 40.1% Speak English less than very well9.0% of residents speak other language at home 655 80.2% Speak English very well162 19.8% Speak English less than very well
English speakers - Born in the United States 95.3% of residents of Woodfield speak English at home.
1.3% of residents speak Spanish at home 35 100.0% Speak English very well3.7% of residents speak other language at home 97 100.0% Speak English very well
English speakers - Native, born elsewhere 86.6% of residents of Woodfield speak English at home.
13.4% of residents speak Spanish at home 17 100.0% Speak English less than very well
English speakers - Foreign-born 13.8% of residents of Woodfield speak English at home.
64.9% of residents speak Spanish at home 717 62.1% Speak English very well437 37.9% Speak English less than very well27.4% of residents speak other language at home 400 82.1% Speak English very well87 17.9% Speak English less than very well
White (Caucasian) - Speak only English Native:
94.1% (1,185)Foreign-born:
11.9% (26)
White (Caucasian) - Speak another language Native:
5.8% (74)Foreign-born:
77.6% (169)
Black or African American - Speak only English Native:
95.2% (5,084)Foreign-born:
66.5% (135)
Black or African American - Speak another language Native:
4.3% (231)Foreign-born:
5.2% (11)
Asian - Speak only English Native:
17.6% (5)Foreign-born:
2.7% (13)
Asian - Speak another language Native:
87.0% (25)Foreign-born:
100.0% (474)
Other race - Speak another language Native:
88.0% (280)Foreign-born:
100.0% (778)
Two or more races - Speak another language Native:
20.3% (80)Foreign-born:
100.0% (70)
White alone - Speak only English Native:
95.1% (1,153)Foreign-born:
27.9% (12)
White alone - Speak another language Native:
5.9% (71)Foreign-born:
68.2% (28)
Hispanic or Latino - Speak only English Native:
51.8% (343)Foreign-born:
1.1% (12)
Hispanic or Latino - Speak another language Native:
46.7% (309)Foreign-born:
100.0% (1,108)
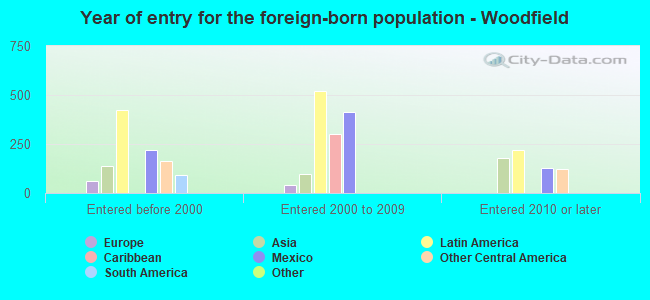
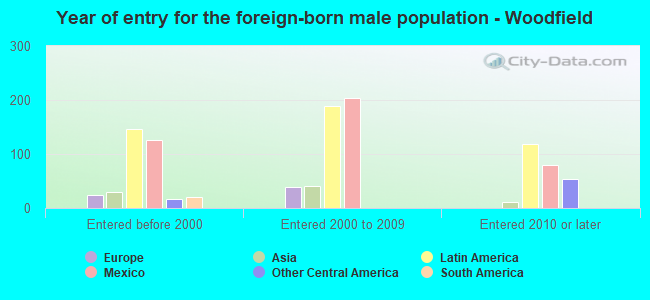
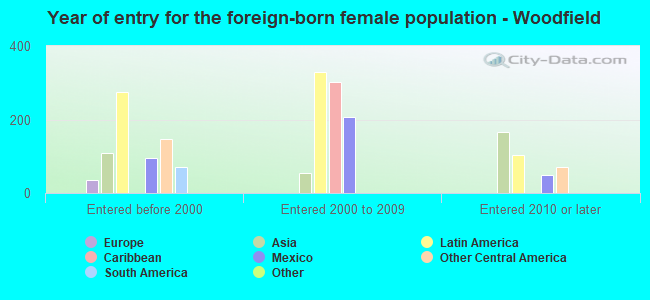
Foreign-born residents in Woodfield 1,979 residents are foreign born (14.7% Latin America , 5.0% Asia ).
This city:
20.6%South Carolina:
5.3%
Marital status for residents in Woodfield Marital status - White (Caucasian) population 15 years and over
Males 16.2% Never married49.9% Now married0.0% Separated10.5% Widowed23.3% DivorcedFemales 20.5% Never married50.8% Now married2.7% Separated16.0% Widowed10.0% DivorcedWomen who did not give birth in the past 12 months Now married:
41.0% (108)Unmarried:
59.0% (155)
Marital status - Black or African American population 15 years and over
Males 52.2% Never married28.7% Now married4.3% Separated2.4% Widowed12.5% DivorcedFemales 51.4% Never married20.7% Now married0.6% Separated3.1% Widowed24.2% DivorcedWomen who gave birth in the past 12 months Now married:
56.0% (14)Unmarried:
44.0% (11)
Women who did not give birth in the past 12 months Now married:
11.7% (204)Unmarried:
88.3% (1,534)
Marital status - Asian population 15 years and over
Males 36.5% Never married63.5% Now married0.0% Separated0.0% Widowed0.0% DivorcedFemales 3.5% Never married26.7% Now married0.0% Separated47.9% Widowed21.9% DivorcedWomen who did not give birth in the past 12 months Now married:
77.0% (52)Unmarried:
23.0% (16)
Marital status - Other race population 15 years and over
Males 64.9% Never married35.1% Now married0.0% Separated0.0% Widowed0.0% DivorcedFemales 42.2% Never married33.1% Now married6.5% Separated0.0% Widowed18.1% DivorcedWomen who did not give birth in the past 12 months Now married:
35.8% (101)Unmarried:
64.2% (181)
Marital status - Two or more races population 15 years and over
Males 70.1% Never married0.0% Now married9.0% Separated0.0% Widowed20.8% DivorcedFemales 56.2% Never married0.0% Now married0.0% Separated31.2% Widowed12.5% DivorcedWomen who did not give birth in the past 12 months Now married:
0.0% (0)Unmarried:
100.0% (89)
Marital status - White alone, not Hispanic / Latino population 15 years and over
Males 15.7% Never married49.8% Now married0.0% Separated13.3% Widowed21.2% DivorcedFemales 17.7% Never married49.9% Now married3.2% Separated17.2% Widowed12.0% DivorcedWomen who did not give birth in the past 12 months Now married:
43.1% (87)Unmarried:
56.9% (115)
Marital status - Hispanic or Latino population 15 years and over
Males 59.6% Never married33.7% Now married0.0% Separated0.0% Widowed6.8% DivorcedFemales 42.1% Never married39.1% Now married4.3% Separated2.4% Widowed12.0% DivorcedWomen who did not give birth in the past 12 months Now married:
36.1% (141)Unmarried:
63.9% (249)
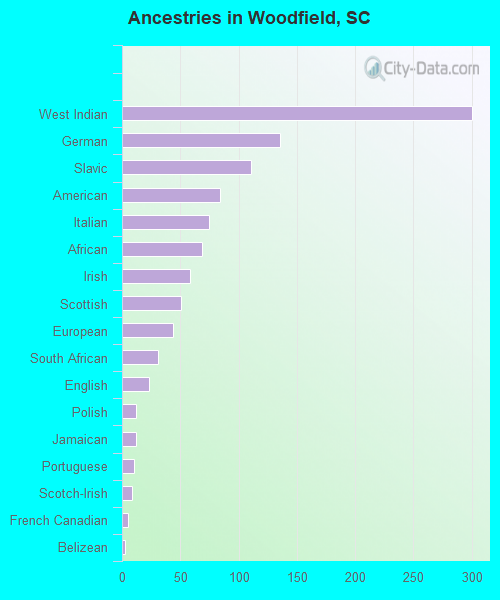
Ancestries in Woodfield
300 5.3% West Indian136 2.4% German111 2.0% Slavic84 1.5% American75 1.3% Italian69 1.2% African58 1.0% Irish51 0.9% Scottish44 0.8% European31 0.5% South African23 0.4% English12 0.2% Polish12 0.2% Jamaican10 0.2% Portuguese9 0.2% Scotch-Irish5 0.09% French Canadian3 0.05% Belizean1 0.02% Ethiopian
Children Nativity (place of birth) in Woodfield
Children under 6 years - Living with two parents Both parents native 58 100.0% NativeBoth parents foreign-born 24 100.0% NativeOne native, one foreign-born parent 13 100.0% NativeChildren under 6 years - Living with one parent Native parent 315 100.0% NativeForeign-born parent 71 52.7% Native64 47.3% Foreign-bornChildren 6 to 17 years - Living with two parents Both parents native 151 100.0% NativeBoth parents foreign-born 38 58.4% Native27 41.6% Foreign-bornChildren 6 to 17 years - Living with one parent Native parent 701 100.0% NativeForeign-born parent 789 47.7% Native865 52.3% Foreign-born
Grandparents responsible for own grandchildren in Woodfield
Grandparents (30 to 59 years) Black or African American 30 45.6% Responsible for grandchildren36 54.4% Not responsible for grandchildrenOther race 31 100.0% Not responsible for grandchildrenHispanic or Latino 39 100.0% Not responsible for grandchildren
Grandparents (60 years and over) Black or African American 86 100.0% Not responsible for grandchildrenHispanic or Latino 10 100.0% Not responsible for grandchildren