Races in Woodlawn-Oakdale, Kentucky (KY) Detailed Stats
Ancestries, Foreign-born residents, place of birth

Discuss Woodlawn-Oakdale, Kentucky races on our local forum with over 2,400,000 registered users
0.1% of Woodlawn-Oakdale, KY residents are foreign-born , which is 2721.1% less than the foreign-born rate of 4.0% across the entire state of Kentucky.
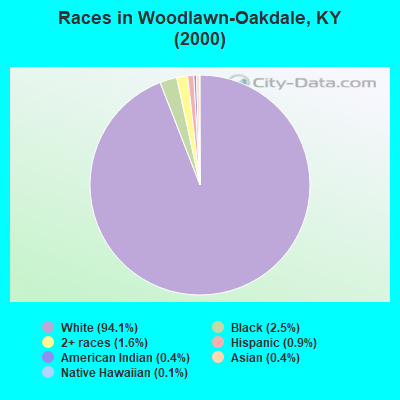
Race distribution in Woodlawn-Oakdale

- 4,64594.1%White alone
- 1242.5%Black alone
- 781.6%Two or more races
- 430.9%Hispanic
- 200.4%Asian alone
- 200.4%American Indian alone
- 50.1%Native Hawaiian and Other
Pacific Islander alone - 20.04%Other race alone
2000
2022
-
- 3,608,01389.3%White alone
- 293,6397.3%Black alone
- 59,9391.5%Hispanic
- 37,7500.9%Two or more races
- 29,3680.7%Asian alone
- 7,9390.2%American Indian alone
- 3,8460.10%Other race alone
- 1,2750.03%Native Hawaiian and Other
Pacific Islander alone

-
- 3,710,99882.2%White alone
- 343,1947.6%Black alone
- 187,4834.2%Hispanic
- 187,3944.2%Two or more races
- 62,2401.4%Asian alone
- 13,5290.3%Other race alone
- 4,3020.10%American Indian alone
- 3,1700.07%Native Hawaiian and Other
Pacific Islander alone

Income and house value in Woodlawn-Oakdale
- Median household income in 2022
- $52,922White non-Hispanic householders
- $34,265Black householders
- $58,877Two or more races householders
- $26,132Hispanic or Latino race householders
- Median 2022 house value
- $144,586White Non-Hispanic householders
- $177,359Black or African American householders
- $228,928Asian householders
- $24,095Two or more races householders
Household income for White non-Hispanic householders

Household income for Black householders

Household income for American Indian and Alaska Native householders

Household income for Asian householders

Household income for Two or more races householders

Household income for Hispanic or Latino race householders

Foreign-born residents in Woodlawn-Oakdale
7 residents are foreign born
| This city: | 0.1% |
| Kentucky: | 2.0% |
Ancestries in Woodlawn-Oakdale

- 92224.8%United States
- 88123.7%Other
- 66717.9%Irish
- 45012.1%German
- 3339.0%English
- 1092.9%French
- 651.7%Dutch
- 561.5%Scotch-Irish
- 541.5%Scottish
- 431.2%Italian
- 320.9%Welsh
- 290.8%Polish
- 230.6%French Canadian
- 190.5%Hungarian
- 170.5%Swedish
- 110.3%Danish
- 80.2%Czech

Zip codes: 42003.