Races in Woodstock, Illinois (IL) Detailed Stats
Data:
Races - White alone (%)
Races - White alone (% change since 2000)
Races - Black alone (%)
Races - Black alone (% change since 2000)
Races - American Indian alone (%)
Races - American Indian alone (% change since 2000)
Races - Asian alone (%)
Races - Asian alone (% change since 2000)
Races - Hispanic (%)
Races - Hispanic (% change since 2000)
Races - Native Hawaiian and Other Pacific Islander alone (%)
Races - Native Hawaiian and Other Pacific Islander alone (% change since 2000)
Races - Two or more races(%)
Races - Two or more races(% change since 2000)
Races - Other race alone (%)
Races - Other race alone (% change since 2000)
Racial diversity
Place of birth - Born in state of residence (%)
Place of birth - Born in state of residence (%) - White
Place of birth - Born in state of residence (%) - Black or African American
Place of birth - Born in state of residence (%) - Asian
Place of birth - Born in state of residence (%) - Hispanic or Latino
Place of birth - Born in state of residence (%) - American Indian and Alaska Native
Place of birth - Born in state of residence (%) - Multirace
Place of birth - Born in state of residence (%) - Other Race
Place of birth - Born in other state (%)
Place of birth - Born in other state (%) - White
Place of birth - Born in other state (%) - Black or African American
Place of birth - Born in other state (%) - Asian
Place of birth - Born in other state (%) - Hispanic or Latino
Place of birth - Born in other state (%) - American Indian and Alaska Native
Place of birth - Born in other state (%) - Multirace
Place of birth - Born in other state (%) - Other Race
Place of birth - Native, outside of US (%)
Place of birth - Native, outside of US (%) - White
Place of birth - Native, outside of US (%) - Black or African American
Place of birth - Native, outside of US (%) - Asian
Place of birth - Native, outside of US (%) - Hispanic or Latino
Place of birth - Native, outside of US (%) - American Indian and Alaska Native
Place of birth - Native, outside of US (%) - Multirace
Place of birth - Native, outside of US (%) - Other Race
Place of birth - Foreign born (%)
Place of birth - Foreign born (%) - White
Place of birth - Foreign born (%) - Black or African American
Place of birth - Foreign born (%) - Asian
Place of birth - Foreign born (%) - Hispanic or Latino
Place of birth - Foreign born (%) - American Indian and Alaska Native
Place of birth - Foreign born (%) - Multirace
Place of birth - Foreign born (%) - Other Race
Residents speaking English at home (%)
Residents speaking English at home - Born in the United States (%)
Residents speaking English at home - Native, born elsewhere (%)
Residents speaking English at home - Foreign born (%)
Residents speaking Spanish at home (%)
Residents speaking Spanish at home - Born in the United States (%)
Residents speaking Spanish at home - Native, born elsewhere (%)
Residents speaking Spanish at home - Foreign born (%)
Residents speaking other language at home (%)
Residents speaking other language at home - Born in the United States (%)
Residents speaking other language at home - Native, born elsewhere (%)
Residents speaking other language at home - Foreign born (%)
Marital status - Never married (%)
Marital status - Now married (%)
Marital status - Separated (%)
Marital status - Widowed (%)
Marital status - Divorced (%)
Ancestries Reported - Arab (%)
Ancestries Reported - Czech (%)
Ancestries Reported - Danish (%)
Ancestries Reported - Dutch (%)
Ancestries Reported - English (%)
Ancestries Reported - French (%)
Ancestries Reported - French Canadian (%)
Ancestries Reported - German (%)
Ancestries Reported - Greek (%)
Ancestries Reported - Hungarian (%)
Ancestries Reported - Irish (%)
Ancestries Reported - Italian (%)
Ancestries Reported - Lithuanian (%)
Ancestries Reported - Norwegian (%)
Ancestries Reported - Polish (%)
Ancestries Reported - Portuguese (%)
Ancestries Reported - Russian (%)
Ancestries Reported - Scotch-Irish (%)
Ancestries Reported - Scottish (%)
Ancestries Reported - Slovak (%)
Ancestries Reported - Subsaharan African (%)
Ancestries Reported - Swedish (%)
Ancestries Reported - Swiss (%)
Ancestries Reported - Ukrainian (%)
Ancestries Reported - United States (%)
Ancestries Reported - Welsh (%)
Ancestries Reported - West Indian (%)
Ancestries Reported - Other (%)
Geographical mobility - Same house 1 year ago (%)
Geographical mobility - Same house 1 year ago (%) - White
Geographical mobility - Same house 1 year ago (%) - Black or African American
Geographical mobility - Same house 1 year ago (%) - Asian
Geographical mobility - Same house 1 year ago (%) - Hispanic or Latino
Geographical mobility - Same house 1 year ago (%) - American Indian and Alaska Native
Geographical mobility - Same house 1 year ago (%) - Multirace
Geographical mobility - Same house 1 year ago (%) - Other Race
Geographical mobility - Moved within same county (%)
Geographical mobility - Moved within same county (%) - White
Geographical mobility - Moved within same county (%) - Black or African American
Geographical mobility - Moved within same county (%) - Asian
Geographical mobility - Moved within same county (%) - Hispanic or Latino
Geographical mobility - Moved within same county (%) - American Indian and Alaska Native
Geographical mobility - Moved within same county (%) - Multirace
Geographical mobility - Moved within same county (%) - Other Race
Geographical mobility - Moved from different county within same state (%)
Geographical mobility - Moved from different county within same state (%) - White
Geographical mobility - Moved from different county within same state (%) - Black or African American
Geographical mobility - Moved from different county within same state (%) - Asian
Geographical mobility - Moved from different county within same state (%) - Hispanic or Latino
Geographical mobility - Moved from different county within same state (%) - American Indian and Alaska Native
Geographical mobility - Moved from different county within same state (%) - Multirace
Geographical mobility - Moved from different county within same state (%) - Other Race
Geographical mobility - Moved from different state (%)
Geographical mobility - Moved from different state (%) - White
Geographical mobility - Moved from different state (%) - Black or African American
Geographical mobility - Moved from different state (%) - Asian
Geographical mobility - Moved from different state (%) - Hispanic or Latino
Geographical mobility - Moved from different state (%) - American Indian and Alaska Native
Geographical mobility - Moved from different state (%) - Multirace
Geographical mobility - Moved from different state (%) - Other Race
Geographical mobility - Moved from abroad (%)
Geographical mobility - Moved from abroad (%) - White
Geographical mobility - Moved from abroad (%) - Black or African American
Geographical mobility - Moved from abroad (%) - Asian
Geographical mobility - Moved from abroad (%) - Hispanic or Latino
Geographical mobility - Moved from abroad (%) - American Indian and Alaska Native
Geographical mobility - Moved from abroad (%) - Multirace
Geographical mobility - Moved from abroad (%) - Other Race
Place of birth for the foreign-born population - Ireland (%)
Place of birth for the foreign-born population - Denmark (%)
Place of birth for the foreign-born population - Norway (%)
Place of birth for the foreign-born population - Sweden (%)
Place of birth for the foreign-born population - United Kingdom (%)
Place of birth for the foreign-born population - England (%)
Place of birth for the foreign-born population - Scotland (%)
Place of birth for the foreign-born population - Other Northern Europe (%)
Place of birth for the foreign-born population - Austria (%)
Place of birth for the foreign-born population - Belgium (%)
Place of birth for the foreign-born population - France (%)
Place of birth for the foreign-born population - Germany (%)
Place of birth for the foreign-born population - Netherlands (%)
Place of birth for the foreign-born population - Switzerland (%)
Place of birth for the foreign-born population - Other Western Europe (%)
Place of birth for the foreign-born population - Greece (%)
Place of birth for the foreign-born population - Italy (%)
Place of birth for the foreign-born population - Portugal (%)
Place of birth for the foreign-born population - Spain (%)
Place of birth for the foreign-born population - Other Southern Europe (%)
Place of birth for the foreign-born population - Albania (%)
Place of birth for the foreign-born population - Belarus (%)
Place of birth for the foreign-born population - Bosnia and Herzegovina (%)
Place of birth for the foreign-born population - Bulgaria (%)
Place of birth for the foreign-born population - Croatia (%)
Place of birth for the foreign-born population - Czechoslovakia (%)
Place of birth for the foreign-born population - Hungary (%)
Place of birth for the foreign-born population - Latvia (%)
Place of birth for the foreign-born population - Lithuania (%)
Place of birth for the foreign-born population - North Macedonia (Macedonia) (%)
Place of birth for the foreign-born population - Moldova (%)
Place of birth for the foreign-born population - Poland (%)
Place of birth for the foreign-born population - Romania (%)
Place of birth for the foreign-born population - Russia (%)
Place of birth for the foreign-born population - Serbia (%)
Place of birth for the foreign-born population - Ukraine (%)
Place of birth for the foreign-born population - Other Eastern Europe (%)
Place of birth for the foreign-born population - China (%)
Place of birth for the foreign-born population - Hong Kong (%)
Place of birth for the foreign-born population - Taiwan (%)
Place of birth for the foreign-born population - Japan (%)
Place of birth for the foreign-born population - Korea (%)
Place of birth for the foreign-born population - Other Eastern Asia (%)
Place of birth for the foreign-born population - Afghanistan (%)
Place of birth for the foreign-born population - Bangladesh (%)
Place of birth for the foreign-born population - India (%)
Place of birth for the foreign-born population - Iran (%)
Place of birth for the foreign-born population - Kazakhstan (%)
Place of birth for the foreign-born population - Nepal (%)
Place of birth for the foreign-born population - Pakistan (%)
Place of birth for the foreign-born population - Sri Lanka (%)
Place of birth for the foreign-born population - Uzbekistan (%)
Place of birth for the foreign-born population - Other South Central Asia (%)
Place of birth for the foreign-born population - Burma (%)
Place of birth for the foreign-born population - Cambodia (%)
Place of birth for the foreign-born population - Indonesia (%)
Place of birth for the foreign-born population - Laos (%)
Place of birth for the foreign-born population - Malaysia (%)
Place of birth for the foreign-born population - Philippines (%)
Place of birth for the foreign-born population - Singapore (%)
Place of birth for the foreign-born population - Thailand (%)
Place of birth for the foreign-born population - Vietnam (%)
Place of birth for the foreign-born population - Other South Eastern Asia (%)
Place of birth for the foreign-born population - Armenia (%)
Place of birth for the foreign-born population - Iraq (%)
Place of birth for the foreign-born population - Israel (%)
Place of birth for the foreign-born population - Jordan (%)
Place of birth for the foreign-born population - Kuwait (%)
Place of birth for the foreign-born population - Lebanon (%)
Place of birth for the foreign-born population - Saudi Arabia (%)
Place of birth for the foreign-born population - Syria (%)
Place of birth for the foreign-born population - Turkey (%)
Place of birth for the foreign-born population - Yemen (%)
Place of birth for the foreign-born population - Other Western Asia (%)
Place of birth for the foreign-born population - Eritrea (%)
Place of birth for the foreign-born population - Ethiopia (%)
Place of birth for the foreign-born population - Kenya (%)
Place of birth for the foreign-born population - Somalia (%)
Place of birth for the foreign-born population - Uganda (%)
Place of birth for the foreign-born population - Zimbabwe (%)
Place of birth for the foreign-born population - Other Eastern Africa (%)
Place of birth for the foreign-born population - Cameroon (%)
Place of birth for the foreign-born population - Congo (%)
Place of birth for the foreign-born population - Democratic Republic of Congo (Zaire) (%)
Place of birth for the foreign-born population - Other Middle Africa (%)
Place of birth for the foreign-born population - Egypt (%)
Place of birth for the foreign-born population - Morocco (%)
Place of birth for the foreign-born population - Sudan (%)
Place of birth for the foreign-born population - Other Northern Africa (%)
Place of birth for the foreign-born population - South Africa (%)
Place of birth for the foreign-born population - Other Southern Africa (%)
Place of birth for the foreign-born population - Cabo Verde (%)
Place of birth for the foreign-born population - Ghana (%)
Place of birth for the foreign-born population - Liberia (%)
Place of birth for the foreign-born population - Nigeria (%)
Place of birth for the foreign-born population - Senegal (%)
Place of birth for the foreign-born population - Sierra Leone (%)
Place of birth for the foreign-born population - Other Western Africa (%)
Place of birth for the foreign-born population - Australia (%)
Place of birth for the foreign-born population - New Zealand (%)
Place of birth for the foreign-born population - Fiji (%)
Place of birth for the foreign-born population - Micronesia (%)
Place of birth for the foreign-born population - Bahamas (%)
Place of birth for the foreign-born population - Barbados (%)
Place of birth for the foreign-born population - Cuba (%)
Place of birth for the foreign-born population - Dominica (%)
Place of birth for the foreign-born population - Dominican Republic (%)
Place of birth for the foreign-born population - Grenada (%)
Place of birth for the foreign-born population - Haiti (%)
Place of birth for the foreign-born population - Jamaica (%)
Place of birth for the foreign-born population - St. Vincent and the Grenadines (%)
Place of birth for the foreign-born population - Trinidad and Tobago (%)
Place of birth for the foreign-born population - West Indies (%)
Place of birth for the foreign-born population - Other Caribbean (%)
Place of birth for the foreign-born population - Belize (%)
Place of birth for the foreign-born population - Costa Rica (%)
Place of birth for the foreign-born population - El Salvador (%)
Place of birth for the foreign-born population - Guatemala (%)
Place of birth for the foreign-born population - Honduras (%)
Place of birth for the foreign-born population - Mexico (%)
Place of birth for the foreign-born population - Nicaragua (%)
Place of birth for the foreign-born population - Panama (%)
Place of birth for the foreign-born population - Other Central America (%)
Place of birth for the foreign-born population - Argentina (%)
Place of birth for the foreign-born population - Bolivia (%)
Place of birth for the foreign-born population - Brazil (%)
Place of birth for the foreign-born population - Chile (%)
Place of birth for the foreign-born population - Colombia (%)
Place of birth for the foreign-born population - Ecuador (%)
Place of birth for the foreign-born population - Guyana (%)
Place of birth for the foreign-born population - Peru (%)
Place of birth for the foreign-born population - Uruguay (%)
Place of birth for the foreign-born population - Venezuela (%)
Place of birth for the foreign-born population - Other South America (%)
Place of birth for the foreign-born population - Canada (%)
Place of birth for the foreign-born population - Other Northern America (%)
Place of birth for the foreign-born population - Other (%)
Latest news about races in Woodstock, IL collected exclusively by city-data.com from local newspapers, TV, and radio stations
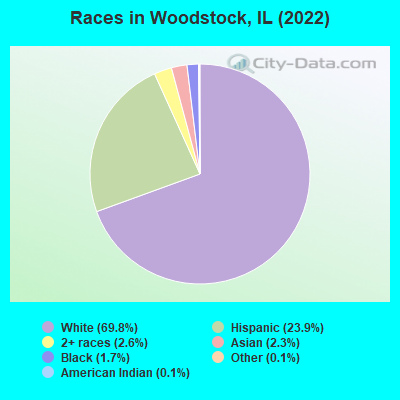
According to 2022 data, the most numerous races in Woodstock, IL are White alone (18,247 residents), Hispanic (6,246 residents), and Black alone (454 residents). 76.9% of Woodstock residents speak English at home. 11.3% of Woodstock, IL residents are foreign-born (8.5% born in Latin America, 1.4% born in Europe, 1.3% born in Asia), which is 23.5% less than the foreign-born rate of 14.0% across the entire state of Illinois.
Race distribution in Woodstock
2000 2022
8,424,140 67.8% White alone 1,856,152 14.9% Black alone 1,530,262 12.3% Hispanic 419,916 3.4% Asian alone 153,996 1.2% Two or more races 13,479 0.1% Other race alone 18,232 0.1% American Indian alone 3,116 0.03% Native Hawaiian and Other
7,356,301 58.5% White alone 2,299,726 18.3% Hispanic 1,660,423 13.2% Black alone 747,296 5.9% Asian alone 458,599 3.6% Two or more races 45,386 0.4% Other race alone 10,405 0.08% American Indian alone 3,896 0.03% Native Hawaiian and Other
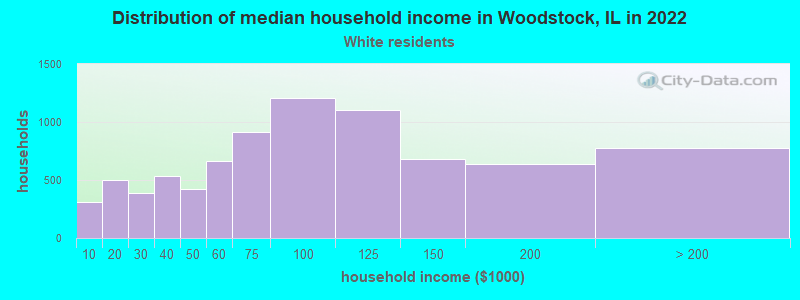
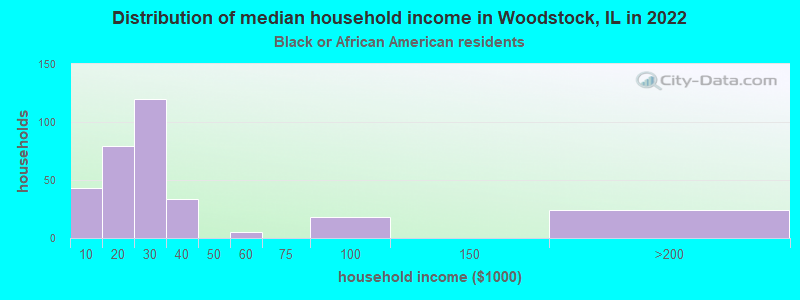
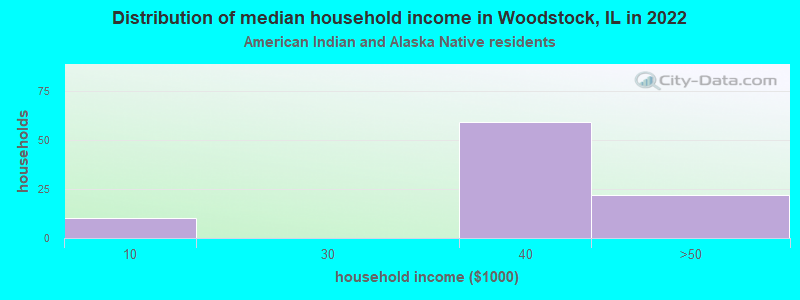
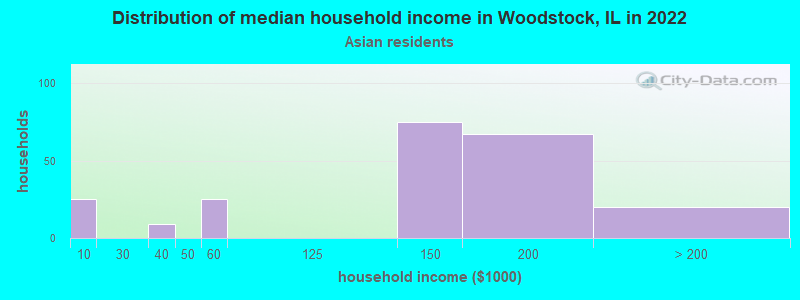
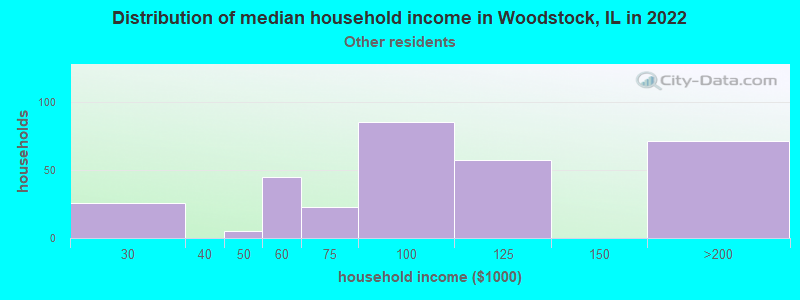
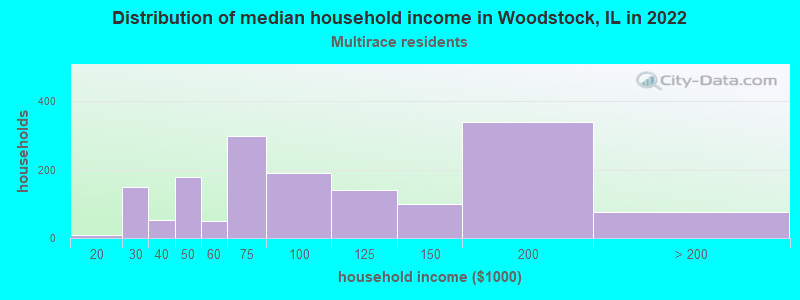
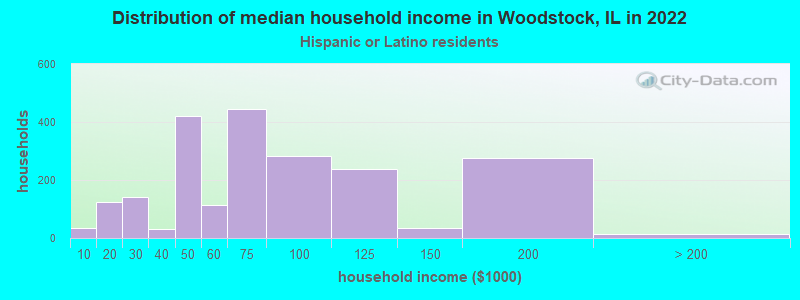
Income and house value in Woodstock Median household income in 2022 $82,654 White non-Hispanic householders$20,248 Black householders$29,701 American Indian and Alaska Native householders$133,727 Asian householders$80,050 Some other race householders$105,182 Two or more races householders$65,410 Hispanic or Latino race householdersMedian 2022 house value $238,304 White Non-Hispanic householders$262,716 Black or African American householders $234,585 Asian householders$223,268 Some other race householders$191,257 Two or more races householders$204,838 Hispanic or Latino householders
Median age by race in Woodstock
40.0 Median age for White residents37.3 43.9 26.9 Median age for Black or African American residents23.5 31.2 59.0 Median age for American Indian / Alaska Native residents58.4 72.2 32.5 Median age for Asian residents44.7 30.8 -666,666,666.0 Median age for Native Hawaiian / Pacific Islander residents-666,666,666.0 -666,666,666.0 29.6 Median age for Other race residents40.3 24.2 28.2 Median age for Two or more races residents25.9 31.1 40.9 Median age for White alone residents37.6 45.5 26.5 Median age for Hispanic or Latino residents26.0 26.8
Owner/renter occupied households by race in Woodstock
House owners and renters - White residents 5,616 71.1% Owner occupied2,284 28.9% Renter occupiedHouse owners and renters - Black or African American residents 32 10.7% Owner occupied267 89.3% Renter occupiedHouse owners and renters - American Indian / Alaska Native residents 84 100.0% Renter occupiedHouse owners and renters - Asian residents 281 92.5% Owner occupied23 7.5% Renter occupiedHouse owners and renters - Other race residents 218 65.4% Owner occupied115 34.6% Renter occupiedHouse owners and renters - Two or more races residents 1,397 76.9% Owner occupied420 23.1% Renter occupiedHouse owners and renters - White alone residents 5,331 70.9% Owner occupied2,188 29.1% Renter occupiedHouse owners and renters - Hispanic or Latino residents 1,469 75.7% Owner occupied471 24.3% Renter occupied
Language usage in Woodstock
English speakers - Total 76.9% of residents of Woodstock speak English at home.
19.7% of residents speak Spanish at home 3,479 71.4% Speak English very well1,393 28.6% Speak English less than very well4.4% of residents speak other language at home 876 79.9% Speak English very well220 20.1% Speak English less than very well
English speakers - Born in the United States 92.4% of residents of Woodstock speak English at home.
5.6% of residents speak Spanish at home 169 76.8% Speak English very well51 23.2% Speak English less than very well1.6% of residents speak other language at home 62 100.0% Speak English very well
English speakers - Native, born elsewhere 22.2% of residents of Woodstock speak English at home.
77.8% of residents speak Spanish at home 85 55.2% Speak English very well69 44.8% Speak English less than very well7.6% of residents speak other language at home 15 100.0% Speak English very well
English speakers - Foreign-born 11.5% of residents of Woodstock speak English at home.
68.8% of residents speak Spanish at home 1,014 46.2% Speak English very well1,183 53.8% Speak English less than very well19.3% of residents speak other language at home 403 65.2% Speak English very well215 34.8% Speak English less than very well
White (Caucasian) - Speak only English Native:
93.8% (16,347)Foreign-born:
12.6% (102)
White (Caucasian) - Speak another language Native:
5.6% (976)Foreign-born:
88.3% (715)
Black or African American - Speak only English Native:
94.4% (575)Foreign-born:
9.1% (5)
Black or African American - Speak another language Native:
5.6% (34)Foreign-born:
87.3% (49)
American Indian / Alaska Native - Speak another language Native:
4.9% (5)Foreign-born:
100.0% (49)
Asian - Speak only English Native:
26.8% (69)Foreign-born:
3.9% (14)
Asian - Speak another language Native:
80.5% (206)Foreign-born:
96.8% (357)
Other race - Speak only English Native:
46.9% (273)Foreign-born:
6.9% (25)
Other race - Speak another language Native:
49.7% (290)Foreign-born:
84.6% (308)
Two or more races - Speak only English Native:
44.7% (1,386)Foreign-born:
7.2% (163)
Two or more races - Speak another language Native:
61.4% (1,901)Foreign-born:
86.9% (1,976)
White alone - Speak only English Native:
96.9% (16,299)Foreign-born:
28.1% (111)
White alone - Speak another language Native:
3.2% (538)Foreign-born:
69.7% (275)
Hispanic or Latino - Speak only English Native:
31.4% (1,052)Foreign-born:
8.6% (212)
Hispanic or Latino - Speak another language Native:
72.5% (2,431)Foreign-born:
90.0% (2,220)
Foreign-born residents in Woodstock 2,962 residents are foreign born (8.5% Latin America , 1.4% Europe , 1.3% Asia ).
This city:
11.3%Illinois:
14.1%
Marital status for residents in Woodstock Marital status - White (Caucasian) population 15 years and over
Males 37.7% Never married50.8% Now married0.1% Separated1.2% Widowed10.2% DivorcedFemales 27.9% Never married43.8% Now married1.8% Separated10.8% Widowed15.7% DivorcedWomen who gave birth in the past 12 months Now married:
54.6% (124)Unmarried:
45.4% (103)
Women who did not give birth in the past 12 months Now married:
41.9% (1,715)Unmarried:
58.1% (2,382)
Marital status - Black or African American population 15 years and over
Males 83.2% Never married11.8% Now married5.0% Separated0.0% Widowed0.0% DivorcedFemales 37.1% Never married46.8% Now married0.0% Separated6.8% Widowed9.4% DivorcedWomen who gave birth in the past 12 months Now married:
100.0% (6)Unmarried:
0.0% (0)
Women who did not give birth in the past 12 months Now married:
61.5% (124)Unmarried:
38.5% (78)
Marital status - American Indian / Alaska Native population 15 years and over
Males 17.8% Never married82.2% Now married0.0% Separated0.0% Widowed0.0% DivorcedFemales 19.6% Never married17.6% Now married0.0% Separated15.7% Widowed47.1% DivorcedWomen who did not give birth in the past 12 months Now married:
47.4% (15)Unmarried:
52.6% (17)
Marital status - Asian population 15 years and over
Males 45.9% Never married20.8% Now married0.0% Separated33.3% Widowed0.0% DivorcedFemales 52.2% Never married31.8% Now married0.0% Separated16.0% Widowed0.0% DivorcedWomen who did not give birth in the past 12 months Now married:
37.9% (76)Unmarried:
62.1% (124)
Marital status - Other race population 15 years and over
Males 15.4% Never married71.5% Now married0.0% Separated0.0% Widowed13.1% DivorcedFemales 27.5% Never married63.7% Now married0.0% Separated8.8% Widowed0.0% DivorcedWomen who gave birth in the past 12 months Now married:
100.0% (29)Unmarried:
0.0% (0)
Women who did not give birth in the past 12 months Now married:
53.7% (93)Unmarried:
46.3% (80)
Marital status - Two or more races population 15 years and over
Males 45.1% Never married53.1% Now married0.0% Separated0.1% Widowed1.6% DivorcedFemales 35.8% Never married53.9% Now married0.0% Separated0.5% Widowed9.8% DivorcedWomen who did not give birth in the past 12 months Now married:
55.5% (849)Unmarried:
44.5% (681)
Marital status - White alone, not Hispanic / Latino population 15 years and over
Males 37.0% Never married50.9% Now married0.1% Separated1.3% Widowed10.7% DivorcedFemales 25.6% Never married45.4% Now married1.6% Separated11.8% Widowed15.6% DivorcedWomen who gave birth in the past 12 months Now married:
82.0% (132)Unmarried:
18.0% (29)
Women who did not give birth in the past 12 months Now married:
42.2% (1,626)Unmarried:
57.8% (2,224)
Marital status - Hispanic or Latino population 15 years and over
Males 44.1% Never married52.5% Now married0.0% Separated0.1% Widowed3.4% DivorcedFemales 42.9% Never married44.4% Now married1.7% Separated1.6% Widowed9.3% DivorcedWomen who gave birth in the past 12 months Now married:
22.9% (27)Unmarried:
77.1% (90)
Women who did not give birth in the past 12 months Now married:
49.0% (809)Unmarried:
51.0% (842)
Ancestries in Woodstock
1,511 13.8% German1,046 9.5% Irish631 5.7% Polish509 4.6% Swedish429 3.9% Italian375 3.4% English288 2.6% American181 1.6% European136 1.2% French79 0.7% Czech77 0.7% Danish55 0.5% Dutch54 0.5% Norwegian54 0.5% African43 0.4% Northern European43 0.4% Hungarian39 0.4% Croatian38 0.3% Scottish37 0.3% Scotch-Irish33 0.3% Finnish33 0.3% Ukrainian28 0.3% Lithuanian26 0.2% Russian17 0.2% Belizean15 0.1% Scandinavian13 0.1% Albanian12 0.1% Romanian10 0.09% Welsh9 0.08% Yugoslavian8 0.07% Armenian8 0.07% Eastern European6 0.05% French Canadian5 0.05% Slovene4 0.04% British4 0.04% Jamaican
Geographical mobility in Woodstock Same house 1 year ago 16,086 84.5% White (Caucasian)391 71.7% Black or African American121 81.0% American Indian / Alaska Native576 94.7% Asian594 76.9% Other race5,096 92.5% Two or more races15,412 85.5% White alone, not Hispanic / Latino5,156 83.5% Hispanic or LatinoMoved within same county 1,226 6.4% White / Caucasian109 20.1% Black or African American17 11.7% American Indian / Alaska Native28 4.7% Asian23 3.0% Other race284 5.2% Two or more races1,238 6.9% White alone, not Hispanic / Latino218 3.5% Hispanic or LatinoMoved within same state 628 3.3% White / Caucasian103 18.8% Black or African American12 8.0% American Indian / Alaska Native149 19.3% Other race80 1.4% Two or more races565 3.1% White alone, not Hispanic / Latino524 8.5% Hispanic or LatinoMoved from different state 422 2.2% White / Caucasian30 3.9% Other race329 1.8% White alone, not Hispanic / Latino275 4.5% Hispanic or LatinoMoved from abroad 102 0.5% White49 0.3% White alone, not Hispanic / Latino177 2.9% Hispanic or Latino
Children Nativity (place of birth) in Woodstock
Children under 6 years - Living with two parents Both parents native 900 100.0% NativeBoth parents foreign-born 238 100.0% NativeOne native, one foreign-born parent 29 100.0% NativeChildren under 6 years - Living with one parent Native parent 451 100.0% NativeForeign-born parent 35 100.0% NativeChildren 6 to 17 years - Living with two parents Both parents native 1,626 100.0% NativeBoth parents foreign-born 584 100.0% NativeOne native, one foreign-born parent 82 100.0% NativeChildren 6 to 17 years - Living with one parent Native parent 1,259 100.0% NativeForeign-born parent 280 49.1% Native290 50.9% Foreign-born
Grandparents responsible for own grandchildren in Woodstock
Grandparents (30 to 59 years) White / Caucasian 32 37.4% Responsible for grandchildren53 62.6% Not responsible for grandchildrenTwo or more races 30 100.0% Not responsible for grandchildrenWhite alone, not Hispanic / Latino 15 37.5% Responsible for grandchildren25 62.5% Not responsible for grandchildrenHispanic or Latino 36 39.3% Responsible for grandchildren55 60.7% Not responsible for grandchildrenGrandparents (60 years and over) White / Caucasian 28 20.8% Responsible for grandchildren105 79.2% Not responsible for grandchildrenTwo or more races 5 100.0% Not responsible for grandchildrenWhite alone, not Hispanic / Latino 32 22.0% Responsible for grandchildren113 78.0% Not responsible for grandchildrenHispanic or Latino 40 93.5% Responsible for grandchildren3 6.5% Not responsible for grandchildren