Races in Woodville, South Carolina (SC) Detailed Stats
Ancestries, Foreign-born residents, place of birth
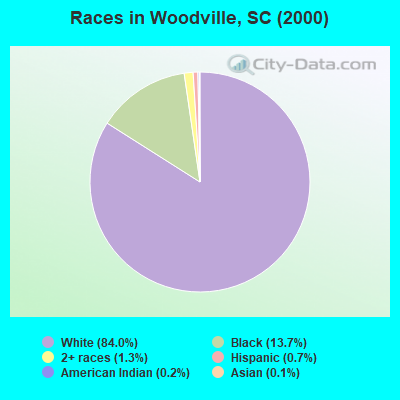
Race distribution in Woodville

- 6,89784.0%White alone
- 1,12413.7%Black alone
- 1051.3%Two or more races
- 580.7%Hispanic
- 130.2%American Indian alone
- 110.1%Asian alone
2000
2022
-
- 2,652,29166.1%White alone
- 1,178,48629.4%Black alone
- 95,0762.4%Hispanic
- 35,5680.9%Asian alone
- 33,2900.8%Two or more races
- 12,7650.3%American Indian alone
- 3,2660.08%Other race alone
- 1,2700.03%Native Hawaiian and Other
Pacific Islander alone

-
- 3,301,73962.5%White alone
- 1,313,29024.9%Black alone
- 343,7836.5%Hispanic
- 190,5083.6%Two or more races
- 89,8881.7%Asian alone
- 29,3900.6%Other race alone
- 12,1120.2%American Indian alone
- 1,9240.04%Native Hawaiian and Other
Pacific Islander alone

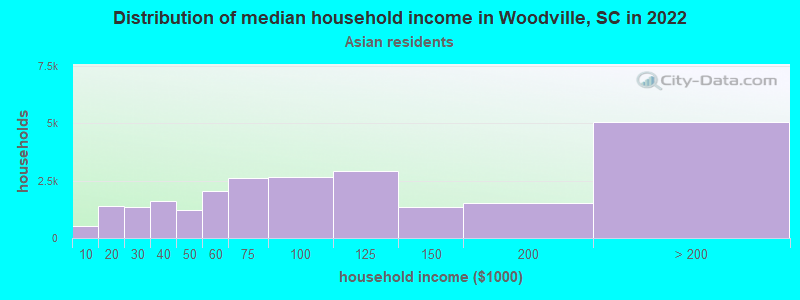
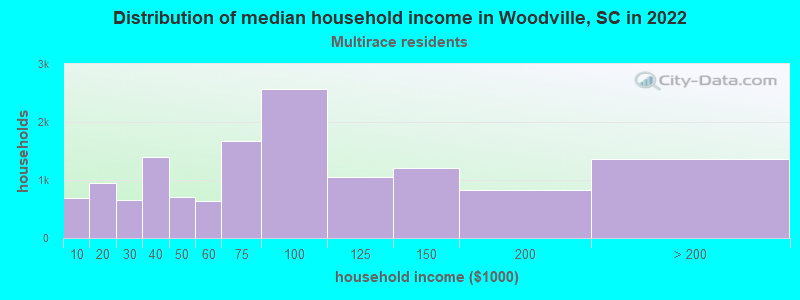
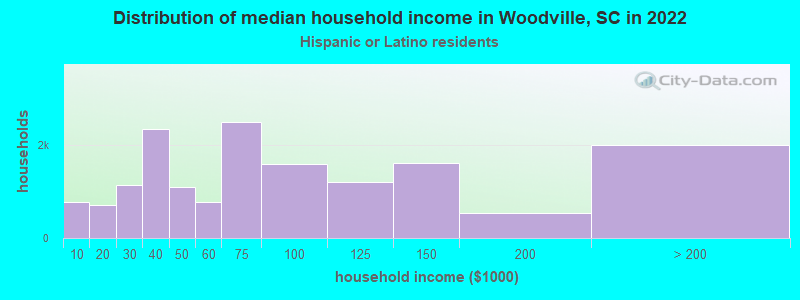
Income and house value in Woodville
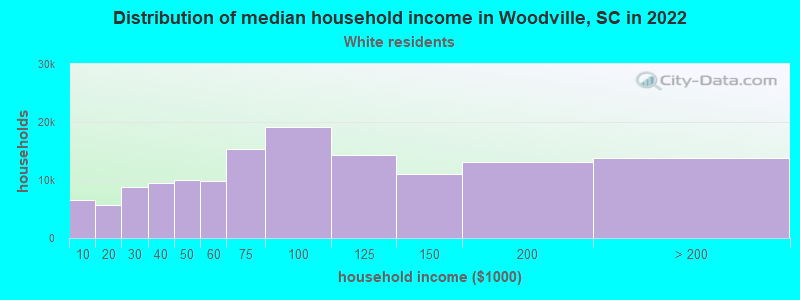
- Median household income in 2022
- $68,243White non-Hispanic householders
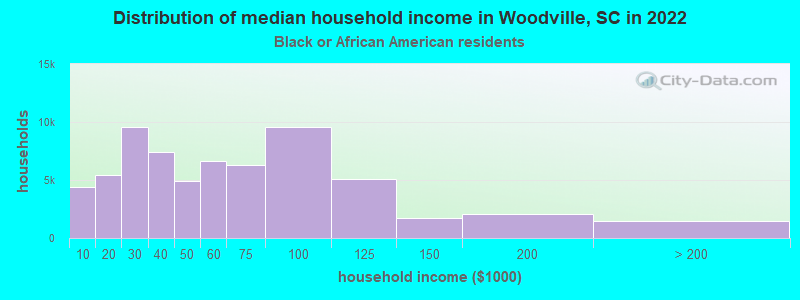
- $87,091Black householders
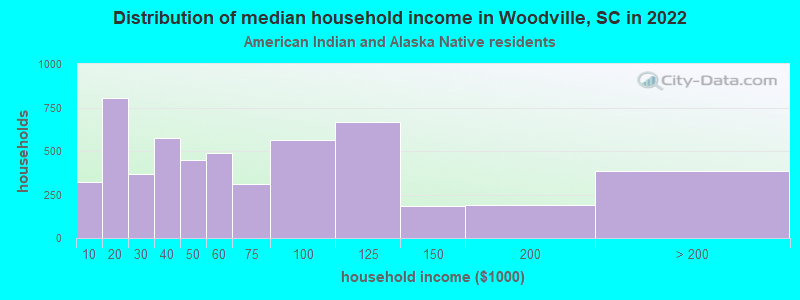
- $65,905American Indian and Alaska Native householders
- $51,985Asian householders
- $89,792Two or more races householders
- $65,975Hispanic or Latino race householders
- Median 2022 house value
- $251,486White Non-Hispanic householders
- $245,579Black or African American householders
- $457,120Asian householders
- $316,467Two or more races householders
- $182,848Hispanic or Latino householders
Household income for White non-Hispanic householders
Household income for Black householders
Household income for American Indian and Alaska Native householders
Household income for Asian householders
Household income for Two or more races householders
Household income for Hispanic or Latino race householders
Zip code: 29669