Races in Worland, Wyoming (WY) Detailed Stats
Data:
Races - White alone (%)
Races - White alone (% change since 2000)
Races - Black alone (%)
Races - Black alone (% change since 2000)
Races - American Indian alone (%)
Races - American Indian alone (% change since 2000)
Races - Asian alone (%)
Races - Asian alone (% change since 2000)
Races - Hispanic (%)
Races - Hispanic (% change since 2000)
Races - Native Hawaiian and Other Pacific Islander alone (%)
Races - Native Hawaiian and Other Pacific Islander alone (% change since 2000)
Races - Two or more races(%)
Races - Two or more races(% change since 2000)
Races - Other race alone (%)
Races - Other race alone (% change since 2000)
Racial diversity
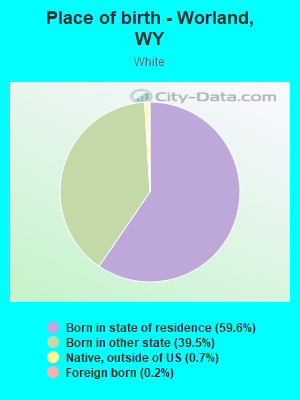
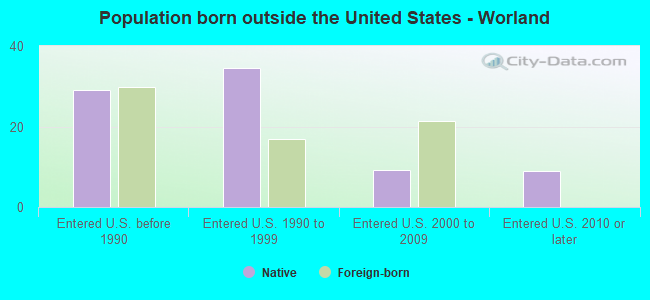
Place of birth - Born in state of residence (%)
Place of birth - Born in state of residence (%) - White
Place of birth - Born in state of residence (%) - Black or African American
Place of birth - Born in state of residence (%) - Asian
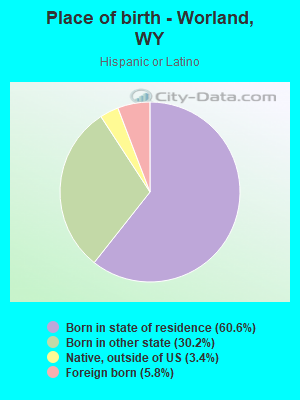
Place of birth - Born in state of residence (%) - Hispanic or Latino
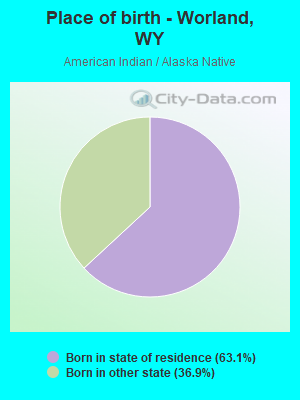
Place of birth - Born in state of residence (%) - American Indian and Alaska Native
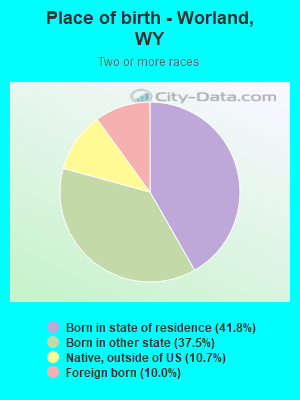
Place of birth - Born in state of residence (%) - Multirace
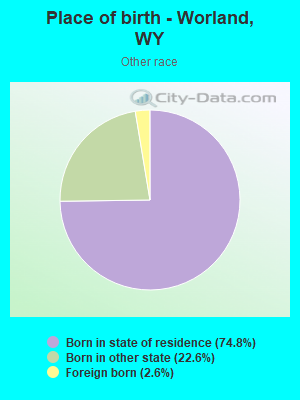
Place of birth - Born in state of residence (%) - Other Race
Place of birth - Born in other state (%)
Place of birth - Born in other state (%) - White
Place of birth - Born in other state (%) - Black or African American
Place of birth - Born in other state (%) - Asian
Place of birth - Born in other state (%) - Hispanic or Latino
Place of birth - Born in other state (%) - American Indian and Alaska Native
Place of birth - Born in other state (%) - Multirace
Place of birth - Born in other state (%) - Other Race
Place of birth - Native, outside of US (%)
Place of birth - Native, outside of US (%) - White
Place of birth - Native, outside of US (%) - Black or African American
Place of birth - Native, outside of US (%) - Asian
Place of birth - Native, outside of US (%) - Hispanic or Latino
Place of birth - Native, outside of US (%) - American Indian and Alaska Native
Place of birth - Native, outside of US (%) - Multirace
Place of birth - Native, outside of US (%) - Other Race
Place of birth - Foreign born (%)
Place of birth - Foreign born (%) - White
Place of birth - Foreign born (%) - Black or African American
Place of birth - Foreign born (%) - Asian
Place of birth - Foreign born (%) - Hispanic or Latino
Place of birth - Foreign born (%) - American Indian and Alaska Native
Place of birth - Foreign born (%) - Multirace
Place of birth - Foreign born (%) - Other Race
Residents speaking English at home (%)
Residents speaking English at home - Born in the United States (%)
Residents speaking English at home - Native, born elsewhere (%)
Residents speaking English at home - Foreign born (%)
Residents speaking Spanish at home (%)
Residents speaking Spanish at home - Born in the United States (%)
Residents speaking Spanish at home - Native, born elsewhere (%)
Residents speaking Spanish at home - Foreign born (%)
Residents speaking other language at home (%)
Residents speaking other language at home - Born in the United States (%)
Residents speaking other language at home - Native, born elsewhere (%)
Residents speaking other language at home - Foreign born (%)
Marital status - Never married (%)
Marital status - Now married (%)
Marital status - Separated (%)
Marital status - Widowed (%)
Marital status - Divorced (%)
Ancestries Reported - Arab (%)
Ancestries Reported - Czech (%)
Ancestries Reported - Danish (%)
Ancestries Reported - Dutch (%)
Ancestries Reported - English (%)
Ancestries Reported - French (%)
Ancestries Reported - French Canadian (%)
Ancestries Reported - German (%)
Ancestries Reported - Greek (%)
Ancestries Reported - Hungarian (%)
Ancestries Reported - Irish (%)
Ancestries Reported - Italian (%)
Ancestries Reported - Lithuanian (%)
Ancestries Reported - Norwegian (%)
Ancestries Reported - Polish (%)
Ancestries Reported - Portuguese (%)
Ancestries Reported - Russian (%)
Ancestries Reported - Scotch-Irish (%)
Ancestries Reported - Scottish (%)
Ancestries Reported - Slovak (%)
Ancestries Reported - Subsaharan African (%)
Ancestries Reported - Swedish (%)
Ancestries Reported - Swiss (%)
Ancestries Reported - Ukrainian (%)
Ancestries Reported - United States (%)
Ancestries Reported - Welsh (%)
Ancestries Reported - West Indian (%)
Ancestries Reported - Other (%)
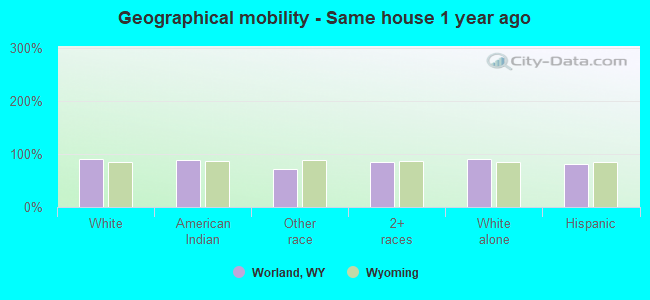
Geographical mobility - Same house 1 year ago (%)
Geographical mobility - Same house 1 year ago (%) - White
Geographical mobility - Same house 1 year ago (%) - Black or African American
Geographical mobility - Same house 1 year ago (%) - Asian
Geographical mobility - Same house 1 year ago (%) - Hispanic or Latino
Geographical mobility - Same house 1 year ago (%) - American Indian and Alaska Native
Geographical mobility - Same house 1 year ago (%) - Multirace
Geographical mobility - Same house 1 year ago (%) - Other Race
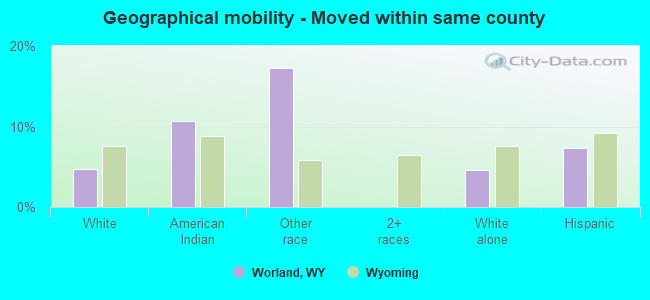
Geographical mobility - Moved within same county (%)
Geographical mobility - Moved within same county (%) - White
Geographical mobility - Moved within same county (%) - Black or African American
Geographical mobility - Moved within same county (%) - Asian
Geographical mobility - Moved within same county (%) - Hispanic or Latino
Geographical mobility - Moved within same county (%) - American Indian and Alaska Native
Geographical mobility - Moved within same county (%) - Multirace
Geographical mobility - Moved within same county (%) - Other Race
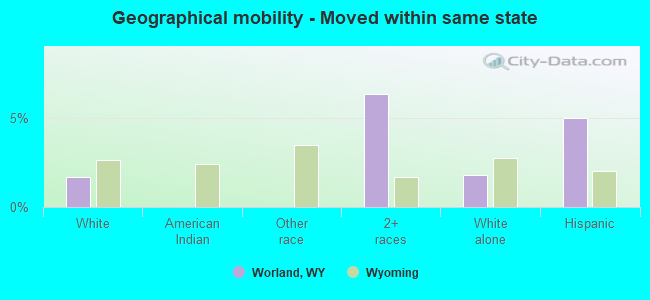
Geographical mobility - Moved from different county within same state (%)
Geographical mobility - Moved from different county within same state (%) - White
Geographical mobility - Moved from different county within same state (%) - Black or African American
Geographical mobility - Moved from different county within same state (%) - Asian
Geographical mobility - Moved from different county within same state (%) - Hispanic or Latino
Geographical mobility - Moved from different county within same state (%) - American Indian and Alaska Native
Geographical mobility - Moved from different county within same state (%) - Multirace
Geographical mobility - Moved from different county within same state (%) - Other Race
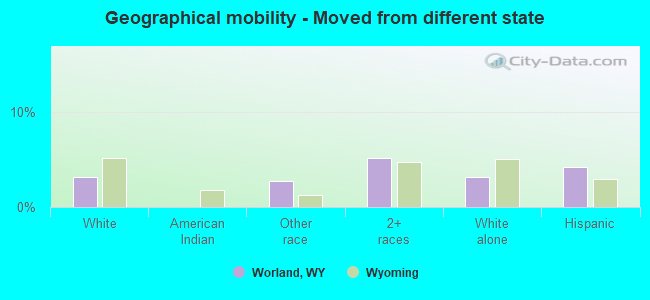
Geographical mobility - Moved from different state (%)
Geographical mobility - Moved from different state (%) - White
Geographical mobility - Moved from different state (%) - Black or African American
Geographical mobility - Moved from different state (%) - Asian
Geographical mobility - Moved from different state (%) - Hispanic or Latino
Geographical mobility - Moved from different state (%) - American Indian and Alaska Native
Geographical mobility - Moved from different state (%) - Multirace
Geographical mobility - Moved from different state (%) - Other Race
Geographical mobility - Moved from abroad (%)
Geographical mobility - Moved from abroad (%) - White
Geographical mobility - Moved from abroad (%) - Black or African American
Geographical mobility - Moved from abroad (%) - Asian
Geographical mobility - Moved from abroad (%) - Hispanic or Latino
Geographical mobility - Moved from abroad (%) - American Indian and Alaska Native
Geographical mobility - Moved from abroad (%) - Multirace
Geographical mobility - Moved from abroad (%) - Other Race
Place of birth for the foreign-born population - Ireland (%)
Place of birth for the foreign-born population - Denmark (%)
Place of birth for the foreign-born population - Norway (%)
Place of birth for the foreign-born population - Sweden (%)
Place of birth for the foreign-born population - United Kingdom (%)
Place of birth for the foreign-born population - England (%)
Place of birth for the foreign-born population - Scotland (%)
Place of birth for the foreign-born population - Other Northern Europe (%)
Place of birth for the foreign-born population - Austria (%)
Place of birth for the foreign-born population - Belgium (%)
Place of birth for the foreign-born population - France (%)
Place of birth for the foreign-born population - Germany (%)
Place of birth for the foreign-born population - Netherlands (%)
Place of birth for the foreign-born population - Switzerland (%)
Place of birth for the foreign-born population - Other Western Europe (%)
Place of birth for the foreign-born population - Greece (%)
Place of birth for the foreign-born population - Italy (%)
Place of birth for the foreign-born population - Portugal (%)
Place of birth for the foreign-born population - Spain (%)
Place of birth for the foreign-born population - Other Southern Europe (%)
Place of birth for the foreign-born population - Albania (%)
Place of birth for the foreign-born population - Belarus (%)
Place of birth for the foreign-born population - Bosnia and Herzegovina (%)
Place of birth for the foreign-born population - Bulgaria (%)
Place of birth for the foreign-born population - Croatia (%)
Place of birth for the foreign-born population - Czechoslovakia (%)
Place of birth for the foreign-born population - Hungary (%)
Place of birth for the foreign-born population - Latvia (%)
Place of birth for the foreign-born population - Lithuania (%)
Place of birth for the foreign-born population - North Macedonia (Macedonia) (%)
Place of birth for the foreign-born population - Moldova (%)
Place of birth for the foreign-born population - Poland (%)
Place of birth for the foreign-born population - Romania (%)
Place of birth for the foreign-born population - Russia (%)
Place of birth for the foreign-born population - Serbia (%)
Place of birth for the foreign-born population - Ukraine (%)
Place of birth for the foreign-born population - Other Eastern Europe (%)
Place of birth for the foreign-born population - China (%)
Place of birth for the foreign-born population - Hong Kong (%)
Place of birth for the foreign-born population - Taiwan (%)
Place of birth for the foreign-born population - Japan (%)
Place of birth for the foreign-born population - Korea (%)
Place of birth for the foreign-born population - Other Eastern Asia (%)
Place of birth for the foreign-born population - Afghanistan (%)
Place of birth for the foreign-born population - Bangladesh (%)
Place of birth for the foreign-born population - India (%)
Place of birth for the foreign-born population - Iran (%)
Place of birth for the foreign-born population - Kazakhstan (%)
Place of birth for the foreign-born population - Nepal (%)
Place of birth for the foreign-born population - Pakistan (%)
Place of birth for the foreign-born population - Sri Lanka (%)
Place of birth for the foreign-born population - Uzbekistan (%)
Place of birth for the foreign-born population - Other South Central Asia (%)
Place of birth for the foreign-born population - Burma (%)
Place of birth for the foreign-born population - Cambodia (%)
Place of birth for the foreign-born population - Indonesia (%)
Place of birth for the foreign-born population - Laos (%)
Place of birth for the foreign-born population - Malaysia (%)
Place of birth for the foreign-born population - Philippines (%)
Place of birth for the foreign-born population - Singapore (%)
Place of birth for the foreign-born population - Thailand (%)
Place of birth for the foreign-born population - Vietnam (%)
Place of birth for the foreign-born population - Other South Eastern Asia (%)
Place of birth for the foreign-born population - Armenia (%)
Place of birth for the foreign-born population - Iraq (%)
Place of birth for the foreign-born population - Israel (%)
Place of birth for the foreign-born population - Jordan (%)
Place of birth for the foreign-born population - Kuwait (%)
Place of birth for the foreign-born population - Lebanon (%)
Place of birth for the foreign-born population - Saudi Arabia (%)
Place of birth for the foreign-born population - Syria (%)
Place of birth for the foreign-born population - Turkey (%)
Place of birth for the foreign-born population - Yemen (%)
Place of birth for the foreign-born population - Other Western Asia (%)
Place of birth for the foreign-born population - Eritrea (%)
Place of birth for the foreign-born population - Ethiopia (%)
Place of birth for the foreign-born population - Kenya (%)
Place of birth for the foreign-born population - Somalia (%)
Place of birth for the foreign-born population - Uganda (%)
Place of birth for the foreign-born population - Zimbabwe (%)
Place of birth for the foreign-born population - Other Eastern Africa (%)
Place of birth for the foreign-born population - Cameroon (%)
Place of birth for the foreign-born population - Congo (%)
Place of birth for the foreign-born population - Democratic Republic of Congo (Zaire) (%)
Place of birth for the foreign-born population - Other Middle Africa (%)
Place of birth for the foreign-born population - Egypt (%)
Place of birth for the foreign-born population - Morocco (%)
Place of birth for the foreign-born population - Sudan (%)
Place of birth for the foreign-born population - Other Northern Africa (%)
Place of birth for the foreign-born population - South Africa (%)
Place of birth for the foreign-born population - Other Southern Africa (%)
Place of birth for the foreign-born population - Cabo Verde (%)
Place of birth for the foreign-born population - Ghana (%)
Place of birth for the foreign-born population - Liberia (%)
Place of birth for the foreign-born population - Nigeria (%)
Place of birth for the foreign-born population - Senegal (%)
Place of birth for the foreign-born population - Sierra Leone (%)
Place of birth for the foreign-born population - Other Western Africa (%)
Place of birth for the foreign-born population - Australia (%)
Place of birth for the foreign-born population - New Zealand (%)
Place of birth for the foreign-born population - Fiji (%)
Place of birth for the foreign-born population - Micronesia (%)
Place of birth for the foreign-born population - Bahamas (%)
Place of birth for the foreign-born population - Barbados (%)
Place of birth for the foreign-born population - Cuba (%)
Place of birth for the foreign-born population - Dominica (%)
Place of birth for the foreign-born population - Dominican Republic (%)
Place of birth for the foreign-born population - Grenada (%)
Place of birth for the foreign-born population - Haiti (%)
Place of birth for the foreign-born population - Jamaica (%)
Place of birth for the foreign-born population - St. Vincent and the Grenadines (%)
Place of birth for the foreign-born population - Trinidad and Tobago (%)
Place of birth for the foreign-born population - West Indies (%)
Place of birth for the foreign-born population - Other Caribbean (%)
Place of birth for the foreign-born population - Belize (%)
Place of birth for the foreign-born population - Costa Rica (%)
Place of birth for the foreign-born population - El Salvador (%)
Place of birth for the foreign-born population - Guatemala (%)
Place of birth for the foreign-born population - Honduras (%)
Place of birth for the foreign-born population - Mexico (%)
Place of birth for the foreign-born population - Nicaragua (%)
Place of birth for the foreign-born population - Panama (%)
Place of birth for the foreign-born population - Other Central America (%)
Place of birth for the foreign-born population - Argentina (%)
Place of birth for the foreign-born population - Bolivia (%)
Place of birth for the foreign-born population - Brazil (%)
Place of birth for the foreign-born population - Chile (%)
Place of birth for the foreign-born population - Colombia (%)
Place of birth for the foreign-born population - Ecuador (%)
Place of birth for the foreign-born population - Guyana (%)
Place of birth for the foreign-born population - Peru (%)
Place of birth for the foreign-born population - Uruguay (%)
Place of birth for the foreign-born population - Venezuela (%)
Place of birth for the foreign-born population - Other South America (%)
Place of birth for the foreign-born population - Canada (%)
Place of birth for the foreign-born population - Other Northern America (%)
Place of birth for the foreign-born population - Other (%)
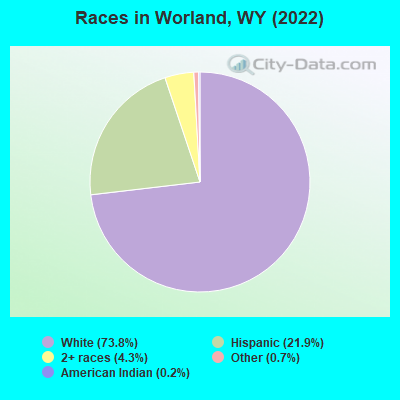
According to 2022 data, the most numerous races in Worland, WY are White alone (3,570 residents), Hispanic (1,062 residents), and Two or more races (206 residents). 90.1% of Worland residents speak English at home. 1.7% of Worland, WY residents are foreign-born , which is 79.3% less than the foreign-born rate of 3.0% across the entire state of Wyoming.
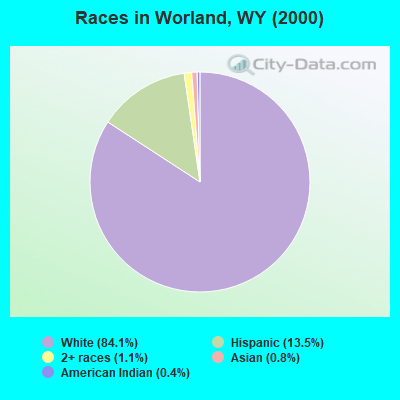
Race distribution in Worland
2000 2022
438,799 88.9% White alone 31,669 6.4% Hispanic 10,238 2.1% American Indian alone 6,164 1.2% Two or more races 3,504 0.7% Black alone 2,670 0.5% Asian alone 474 0.10% Other race alone 264 0.05% Native Hawaiian and Other
473,220 81.4% White alone 62,803 10.8% Hispanic 22,911 3.9% Two or more races 9,589 1.6% American Indian alone 4,997 0.9% Other race alone 3,990 0.7% Black alone 3,577 0.6% Asian alone 294 0.05% Native Hawaiian and Other
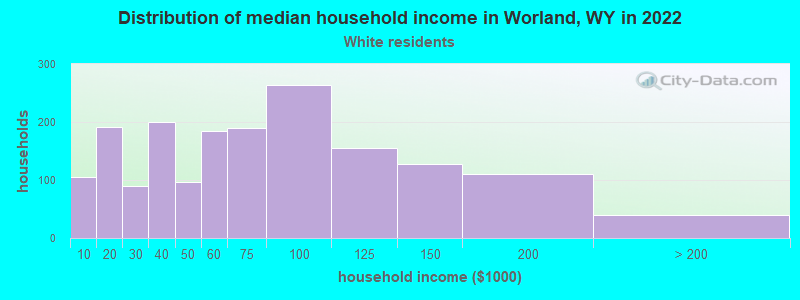
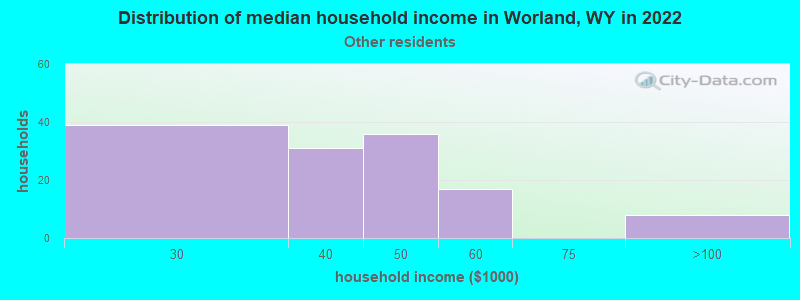
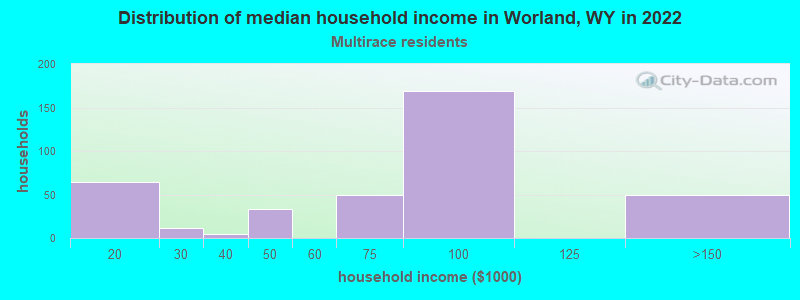
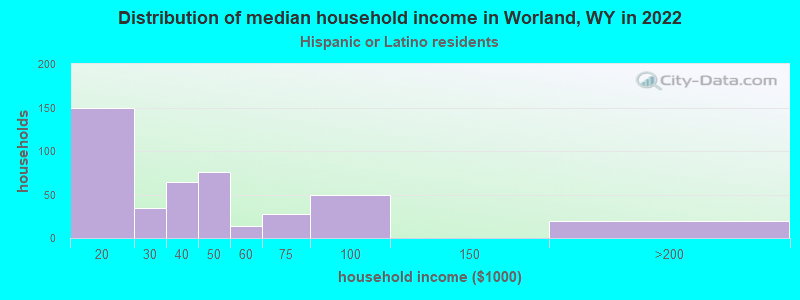
Income and house value in Worland Median household income in 2022 $59,999 White non-Hispanic householders$34,478 Some other race householders$83,290 Two or more races householders$39,023 Hispanic or Latino race householdersMedian 2022 house value $204,776 White Non-Hispanic householders$237,990 Some other race householders$196,930 Hispanic or Latino householders
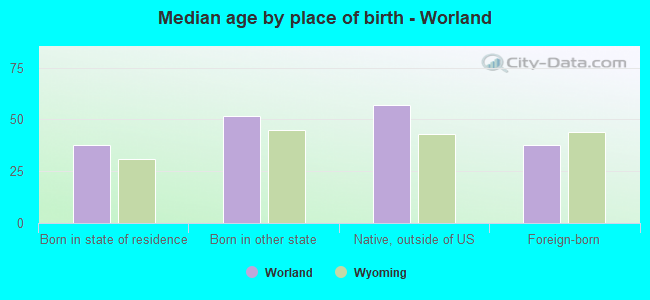
Median age by race in Worland
42.5 Median age for White residents40.6 47.5 -662,146,892.0 Median age for Black or African American residents-558,558,558.0 -746,302,615.9 53.6 Median age for American Indian / Alaska Native residents79.1 -642,934,195.7 -802,845,527.7 Median age for Asian residents-684,684,684.0 -929,503,915.5 -594,708,994.1 Median age for Native Hawaiian / Pacific Islander residents-652,729,383.8 -865,828,091.4 25.1 Median age for Other race residents26.6 23.4 44.2 Median age for Two or more races residents43.4 47.1 44.9 Median age for White alone residents42.1 50.2 31.3 Median age for Hispanic or Latino residents24.8 40.2
Owner/renter occupied households by race in Worland
House owners and renters - White residents 1,261 72.8% Owner occupied472 27.2% Renter occupiedHouse owners and renters - American Indian / Alaska Native residents 31 100.0% Owner occupiedHouse owners and renters - Other race residents 63 32.4% Owner occupied131 67.6% Renter occupiedHouse owners and renters - Two or more races residents 314 68.0% Owner occupied148 32.0% Renter occupiedHouse owners and renters - White alone residents 1,266 75.8% Owner occupied403 24.2% Renter occupiedHouse owners and renters - Hispanic or Latino residents 230 48.2% Owner occupied247 51.8% Renter occupied
Language usage in Worland
English speakers - Total 90.1% of residents of Worland speak English at home.
9.3% of residents speak Spanish at home 350 82.2% Speak English very well76 17.8% Speak English less than very well0.8% of residents speak other language at home 30 78.9% Speak English very well8 21.1% Speak English less than very well
English speakers - Born in the United States 92.7% of residents of Worland speak English at home.
7.0% of residents speak Spanish at home 129 100.0% Speak English very well0.4% of residents speak other language at home 8 100.0% Speak English very well
English speakers - Native, born elsewhere 31.9% of residents of Worland speak English at home.
47.2% of residents speak Spanish at home 34 100.0% Speak English very well6.9% of residents speak other language at home 5 100.0% Speak English very well
English speakers - Foreign-born 8.3% of residents of Worland speak English at home.
90.3% of residents speak Spanish at home 14 21.5% Speak English very well51 78.5% Speak English less than very well6.9% of residents speak other language at home 5 100.0% Speak English very well
White (Caucasian) - Speak only English Native:
97.6% (3,549)Foreign-born:
58.4% (5)
White (Caucasian) - Speak another language Native:
2.1% (76)Foreign-born:
44.0% (4)
Other race - Speak only English Native:
70.4% (227)Foreign-born:
10.1% (1)
Other race - Speak another language Native:
30.8% (99)Foreign-born:
89.1% (8)
Two or more races - Speak another language Native:
38.4% (276)Foreign-born:
100.0% (81)
White alone - Speak only English Native:
97.1% (3,300)Foreign-born:
49.1% (5)
White alone - Speak another language Native:
2.4% (82)Foreign-born:
51.3% (6)
Hispanic or Latino - Speak only English Native:
67.9% (660)Foreign-born:
1.8% (1)
Hispanic or Latino - Speak another language Native:
32.1% (312)Foreign-born:
100.0% (61)
Foreign-born residents in Worland 81 residents are foreign born
This city:
1.7%Wyoming:
3.4%
Marital status for residents in Worland Marital status - White (Caucasian) population 15 years and over
Males 25.4% Never married55.9% Now married1.8% Separated2.3% Widowed14.5% DivorcedFemales 20.5% Never married45.2% Now married0.0% Separated15.8% Widowed18.6% DivorcedWomen who gave birth in the past 12 months Now married:
23.9% (11)Unmarried:
76.1% (34)
Women who did not give birth in the past 12 months Now married:
43.0% (281)Unmarried:
57.0% (372)
Marital status - American Indian / Alaska Native population 15 years and over
Males 24.0% Never married0.0% Now married0.0% Separated0.0% Widowed76.0% DivorcedFemales 0.0% Never married100.0% Now married0.0% Separated0.0% Widowed0.0% DivorcedWomen who did not give birth in the past 12 months Now married:
100.0% (21)Unmarried:
0.0% (0)
Marital status - Other race population 15 years and over
Males 88.5% Never married9.3% Now married0.0% Separated0.0% Widowed2.2% DivorcedFemales 50.8% Never married11.1% Now married0.0% Separated0.0% Widowed38.1% DivorcedWomen who gave birth in the past 12 months Now married:
0.0% (0)Unmarried:
100.0% (37)
Women who did not give birth in the past 12 months Now married:
21.9% (8)Unmarried:
78.1% (30)
Marital status - Two or more races population 15 years and over
Males 13.9% Never married41.4% Now married0.0% Separated0.0% Widowed44.7% DivorcedFemales 2.2% Never married47.3% Now married0.0% Separated0.0% Widowed50.5% DivorcedWomen who did not give birth in the past 12 months Now married:
50.0% (51)Unmarried:
50.0% (51)
Marital status - White alone, not Hispanic / Latino population 15 years and over
Males 25.6% Never married55.4% Now married1.9% Separated2.3% Widowed14.8% DivorcedFemales 17.9% Never married47.9% Now married0.0% Separated15.9% Widowed18.3% DivorcedWomen who gave birth in the past 12 months Now married:
23.9% (11)Unmarried:
76.1% (34)
Women who did not give birth in the past 12 months Now married:
47.1% (287)Unmarried:
52.9% (322)
Marital status - Hispanic or Latino population 15 years and over
Males 46.4% Never married24.9% Now married0.0% Separated0.0% Widowed28.7% DivorcedFemales 31.2% Never married31.5% Now married0.0% Separated4.1% Widowed33.2% DivorcedWomen who gave birth in the past 12 months Now married:
0.0% (0)Unmarried:
100.0% (31)
Women who did not give birth in the past 12 months Now married:
25.5% (39)Unmarried:
74.5% (114)
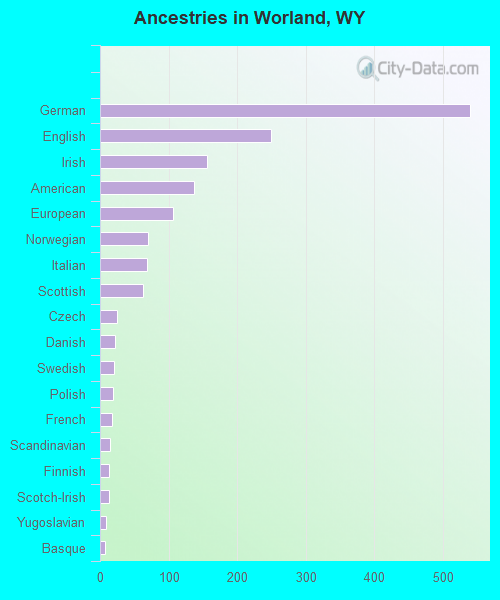
Ancestries in Worland
540 25.9% German249 11.9% English156 7.5% Irish137 6.6% American106 5.1% European70 3.4% Norwegian69 3.3% Italian63 3.0% Scottish25 1.2% Czech22 1.1% Danish21 1.0% Swedish19 0.9% Polish17 0.8% French15 0.7% Scandinavian13 0.6% Finnish13 0.6% Scotch-Irish9 0.4% Yugoslavian7 0.3% Basque
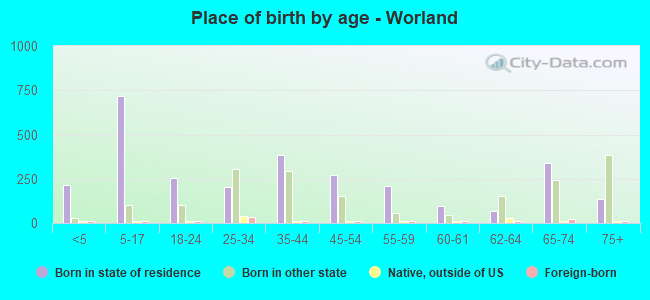
Children Nativity (place of birth) in Worland
Children under 6 years - Living with two parents Both parents native 234 100.0% NativeBoth parents foreign-born 7 100.0% NativeChildren under 6 years - Living with one parent Native parent 73 100.0% Native
Children 6 to 17 years - Living with two parents Both parents native 396 100.0% NativeBoth parents foreign-born 21 100.0% NativeOne native, one foreign-born parent 63 100.0% NativeChildren 6 to 17 years - Living with one parent Native parent 236 100.0% Native
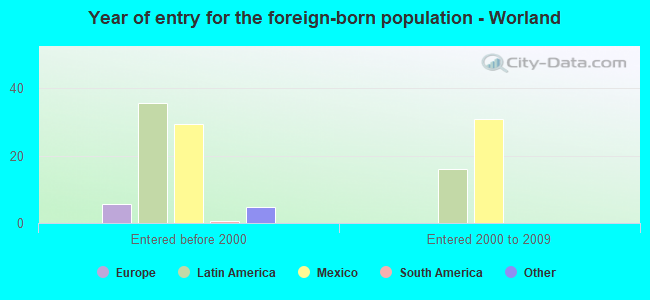
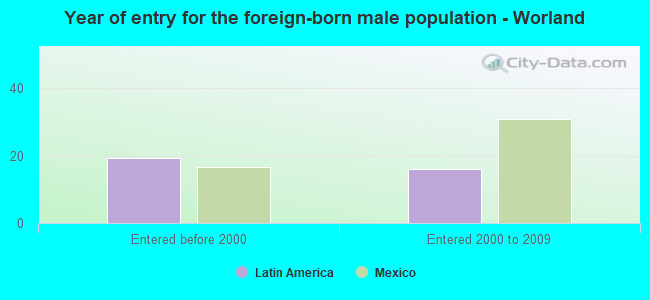
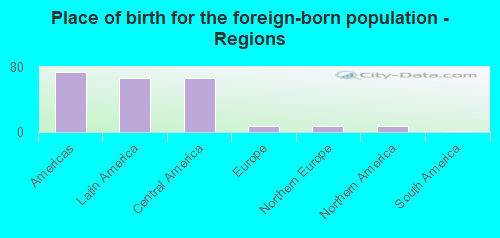
Place of birth for residents in Worland 74 Americas67 Latin America66 Central America7 Europe7 Northern Europe7 Northern America1 South America
Grandparents responsible for own grandchildren in Worland
Grandparents (30 to 59 years) White / Caucasian 4 23.5% Responsible for grandchildren14 76.5% Not responsible for grandchildrenWhite alone, not Hispanic / Latino 6 28.2% Responsible for grandchildren14 71.8% Not responsible for grandchildrenGrandparents (60 years and over) White / Caucasian 7 15.4% Responsible for grandchildren40 84.6% Not responsible for grandchildrenWhite alone, not Hispanic / Latino 8 16.3% Responsible for grandchildren39 83.7% Not responsible for grandchildren