Races in Wyandanch, New York (NY) Detailed Stats
Data:
Races - White alone (%)
Races - White alone (% change since 2000)
Races - Black alone (%)
Races - Black alone (% change since 2000)
Races - American Indian alone (%)
Races - American Indian alone (% change since 2000)
Races - Asian alone (%)
Races - Asian alone (% change since 2000)
Races - Hispanic (%)
Races - Hispanic (% change since 2000)
Races - Native Hawaiian and Other Pacific Islander alone (%)
Races - Native Hawaiian and Other Pacific Islander alone (% change since 2000)
Races - Two or more races(%)
Races - Two or more races(% change since 2000)
Races - Other race alone (%)
Races - Other race alone (% change since 2000)
Racial diversity
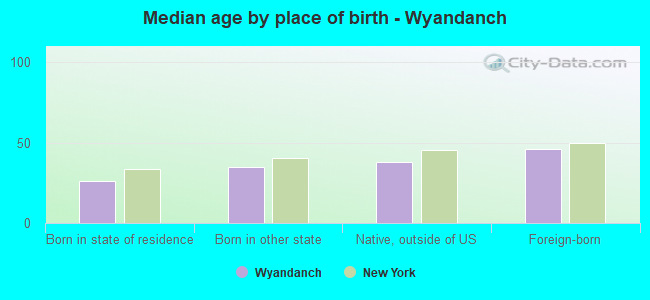
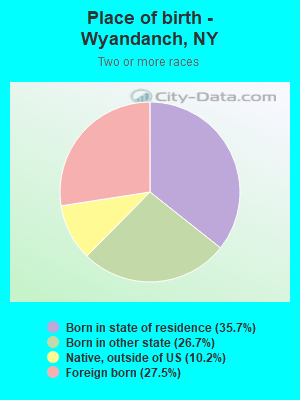
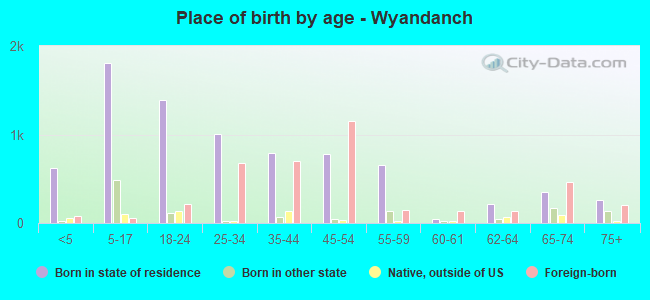
Place of birth - Born in state of residence (%)
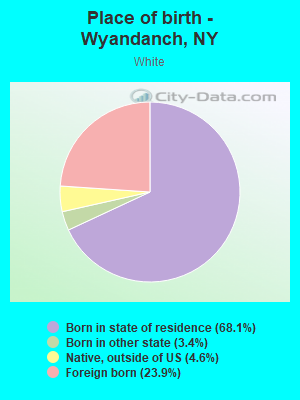
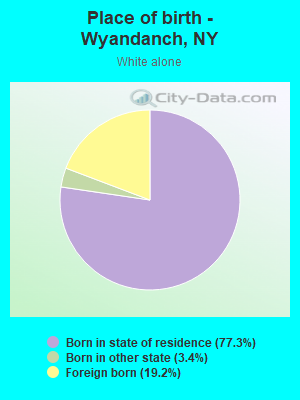
Place of birth - Born in state of residence (%) - White
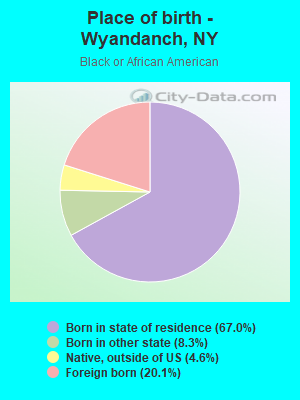
Place of birth - Born in state of residence (%) - Black or African American
Place of birth - Born in state of residence (%) - Asian
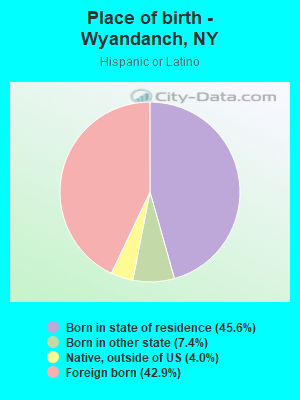
Place of birth - Born in state of residence (%) - Hispanic or Latino
Place of birth - Born in state of residence (%) - American Indian and Alaska Native
Place of birth - Born in state of residence (%) - Multirace
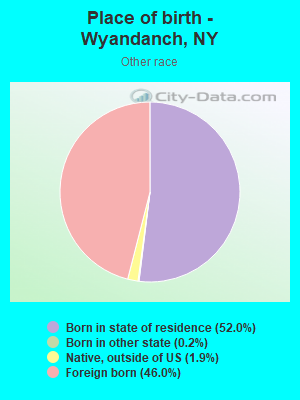
Place of birth - Born in state of residence (%) - Other Race
Place of birth - Born in other state (%)
Place of birth - Born in other state (%) - White
Place of birth - Born in other state (%) - Black or African American
Place of birth - Born in other state (%) - Asian
Place of birth - Born in other state (%) - Hispanic or Latino
Place of birth - Born in other state (%) - American Indian and Alaska Native
Place of birth - Born in other state (%) - Multirace
Place of birth - Born in other state (%) - Other Race
Place of birth - Native, outside of US (%)
Place of birth - Native, outside of US (%) - White
Place of birth - Native, outside of US (%) - Black or African American
Place of birth - Native, outside of US (%) - Asian
Place of birth - Native, outside of US (%) - Hispanic or Latino
Place of birth - Native, outside of US (%) - American Indian and Alaska Native
Place of birth - Native, outside of US (%) - Multirace
Place of birth - Native, outside of US (%) - Other Race
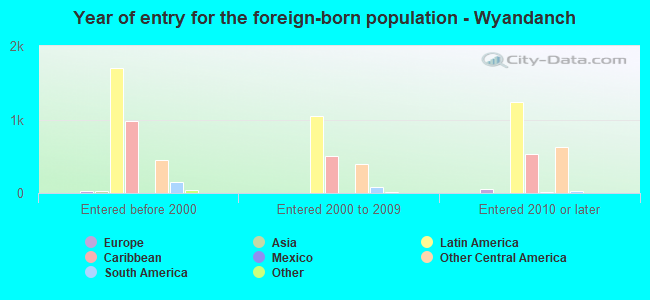
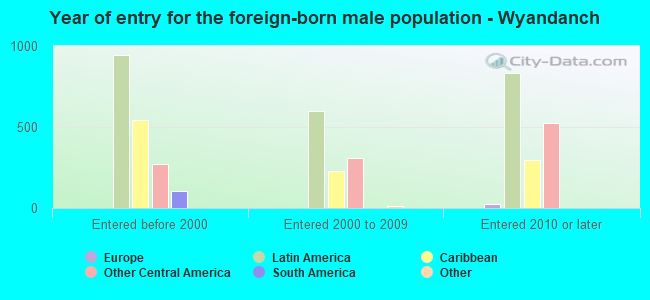
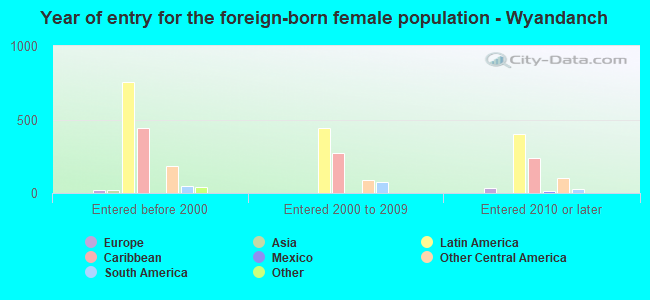
Place of birth - Foreign born (%)
Place of birth - Foreign born (%) - White
Place of birth - Foreign born (%) - Black or African American
Place of birth - Foreign born (%) - Asian
Place of birth - Foreign born (%) - Hispanic or Latino
Place of birth - Foreign born (%) - American Indian and Alaska Native
Place of birth - Foreign born (%) - Multirace
Place of birth - Foreign born (%) - Other Race
Residents speaking English at home (%)
Residents speaking English at home - Born in the United States (%)
Residents speaking English at home - Native, born elsewhere (%)
Residents speaking English at home - Foreign born (%)
Residents speaking Spanish at home (%)
Residents speaking Spanish at home - Born in the United States (%)
Residents speaking Spanish at home - Native, born elsewhere (%)
Residents speaking Spanish at home - Foreign born (%)
Residents speaking other language at home (%)
Residents speaking other language at home - Born in the United States (%)
Residents speaking other language at home - Native, born elsewhere (%)
Residents speaking other language at home - Foreign born (%)
Marital status - Never married (%)
Marital status - Now married (%)
Marital status - Separated (%)
Marital status - Widowed (%)
Marital status - Divorced (%)
Ancestries Reported - Arab (%)
Ancestries Reported - Czech (%)
Ancestries Reported - Danish (%)
Ancestries Reported - Dutch (%)
Ancestries Reported - English (%)
Ancestries Reported - French (%)
Ancestries Reported - French Canadian (%)
Ancestries Reported - German (%)
Ancestries Reported - Greek (%)
Ancestries Reported - Hungarian (%)
Ancestries Reported - Irish (%)
Ancestries Reported - Italian (%)
Ancestries Reported - Lithuanian (%)
Ancestries Reported - Norwegian (%)
Ancestries Reported - Polish (%)
Ancestries Reported - Portuguese (%)
Ancestries Reported - Russian (%)
Ancestries Reported - Scotch-Irish (%)
Ancestries Reported - Scottish (%)
Ancestries Reported - Slovak (%)
Ancestries Reported - Subsaharan African (%)
Ancestries Reported - Swedish (%)
Ancestries Reported - Swiss (%)
Ancestries Reported - Ukrainian (%)
Ancestries Reported - United States (%)
Ancestries Reported - Welsh (%)
Ancestries Reported - West Indian (%)
Ancestries Reported - Other (%)
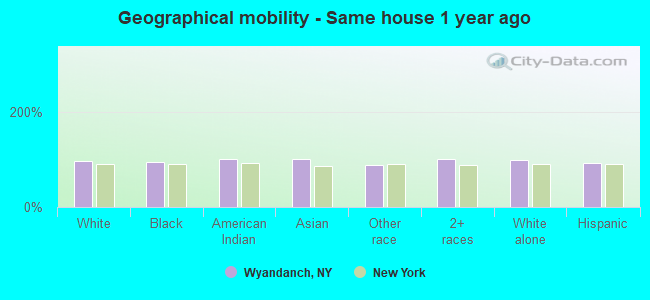
Geographical mobility - Same house 1 year ago (%)
Geographical mobility - Same house 1 year ago (%) - White
Geographical mobility - Same house 1 year ago (%) - Black or African American
Geographical mobility - Same house 1 year ago (%) - Asian
Geographical mobility - Same house 1 year ago (%) - Hispanic or Latino
Geographical mobility - Same house 1 year ago (%) - American Indian and Alaska Native
Geographical mobility - Same house 1 year ago (%) - Multirace
Geographical mobility - Same house 1 year ago (%) - Other Race
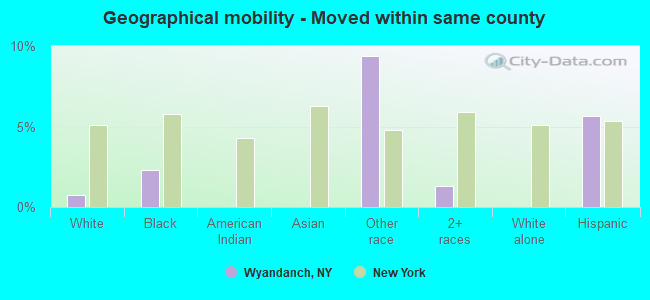
Geographical mobility - Moved within same county (%)
Geographical mobility - Moved within same county (%) - White
Geographical mobility - Moved within same county (%) - Black or African American
Geographical mobility - Moved within same county (%) - Asian
Geographical mobility - Moved within same county (%) - Hispanic or Latino
Geographical mobility - Moved within same county (%) - American Indian and Alaska Native
Geographical mobility - Moved within same county (%) - Multirace
Geographical mobility - Moved within same county (%) - Other Race
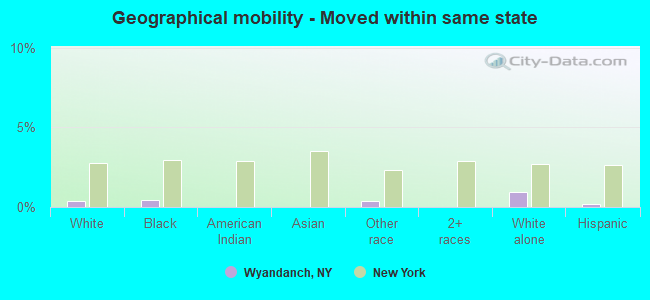
Geographical mobility - Moved from different county within same state (%)
Geographical mobility - Moved from different county within same state (%) - White
Geographical mobility - Moved from different county within same state (%) - Black or African American
Geographical mobility - Moved from different county within same state (%) - Asian
Geographical mobility - Moved from different county within same state (%) - Hispanic or Latino
Geographical mobility - Moved from different county within same state (%) - American Indian and Alaska Native
Geographical mobility - Moved from different county within same state (%) - Multirace
Geographical mobility - Moved from different county within same state (%) - Other Race
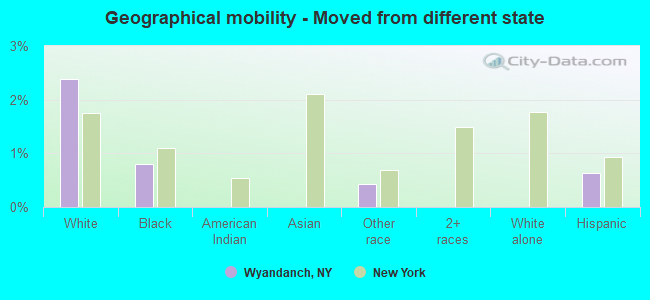
Geographical mobility - Moved from different state (%)
Geographical mobility - Moved from different state (%) - White
Geographical mobility - Moved from different state (%) - Black or African American
Geographical mobility - Moved from different state (%) - Asian
Geographical mobility - Moved from different state (%) - Hispanic or Latino
Geographical mobility - Moved from different state (%) - American Indian and Alaska Native
Geographical mobility - Moved from different state (%) - Multirace
Geographical mobility - Moved from different state (%) - Other Race
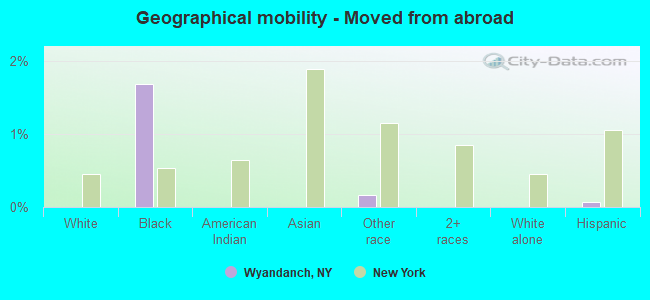
Geographical mobility - Moved from abroad (%)
Geographical mobility - Moved from abroad (%) - White
Geographical mobility - Moved from abroad (%) - Black or African American
Geographical mobility - Moved from abroad (%) - Asian
Geographical mobility - Moved from abroad (%) - Hispanic or Latino
Geographical mobility - Moved from abroad (%) - American Indian and Alaska Native
Geographical mobility - Moved from abroad (%) - Multirace
Geographical mobility - Moved from abroad (%) - Other Race
Place of birth for the foreign-born population - Ireland (%)
Place of birth for the foreign-born population - Denmark (%)
Place of birth for the foreign-born population - Norway (%)
Place of birth for the foreign-born population - Sweden (%)
Place of birth for the foreign-born population - United Kingdom (%)
Place of birth for the foreign-born population - England (%)
Place of birth for the foreign-born population - Scotland (%)
Place of birth for the foreign-born population - Other Northern Europe (%)
Place of birth for the foreign-born population - Austria (%)
Place of birth for the foreign-born population - Belgium (%)
Place of birth for the foreign-born population - France (%)
Place of birth for the foreign-born population - Germany (%)
Place of birth for the foreign-born population - Netherlands (%)
Place of birth for the foreign-born population - Switzerland (%)
Place of birth for the foreign-born population - Other Western Europe (%)
Place of birth for the foreign-born population - Greece (%)
Place of birth for the foreign-born population - Italy (%)
Place of birth for the foreign-born population - Portugal (%)
Place of birth for the foreign-born population - Spain (%)
Place of birth for the foreign-born population - Other Southern Europe (%)
Place of birth for the foreign-born population - Albania (%)
Place of birth for the foreign-born population - Belarus (%)
Place of birth for the foreign-born population - Bosnia and Herzegovina (%)
Place of birth for the foreign-born population - Bulgaria (%)
Place of birth for the foreign-born population - Croatia (%)
Place of birth for the foreign-born population - Czechoslovakia (%)
Place of birth for the foreign-born population - Hungary (%)
Place of birth for the foreign-born population - Latvia (%)
Place of birth for the foreign-born population - Lithuania (%)
Place of birth for the foreign-born population - North Macedonia (Macedonia) (%)
Place of birth for the foreign-born population - Moldova (%)
Place of birth for the foreign-born population - Poland (%)
Place of birth for the foreign-born population - Romania (%)
Place of birth for the foreign-born population - Russia (%)
Place of birth for the foreign-born population - Serbia (%)
Place of birth for the foreign-born population - Ukraine (%)
Place of birth for the foreign-born population - Other Eastern Europe (%)
Place of birth for the foreign-born population - China (%)
Place of birth for the foreign-born population - Hong Kong (%)
Place of birth for the foreign-born population - Taiwan (%)
Place of birth for the foreign-born population - Japan (%)
Place of birth for the foreign-born population - Korea (%)
Place of birth for the foreign-born population - Other Eastern Asia (%)
Place of birth for the foreign-born population - Afghanistan (%)
Place of birth for the foreign-born population - Bangladesh (%)
Place of birth for the foreign-born population - India (%)
Place of birth for the foreign-born population - Iran (%)
Place of birth for the foreign-born population - Kazakhstan (%)
Place of birth for the foreign-born population - Nepal (%)
Place of birth for the foreign-born population - Pakistan (%)
Place of birth for the foreign-born population - Sri Lanka (%)
Place of birth for the foreign-born population - Uzbekistan (%)
Place of birth for the foreign-born population - Other South Central Asia (%)
Place of birth for the foreign-born population - Burma (%)
Place of birth for the foreign-born population - Cambodia (%)
Place of birth for the foreign-born population - Indonesia (%)
Place of birth for the foreign-born population - Laos (%)
Place of birth for the foreign-born population - Malaysia (%)
Place of birth for the foreign-born population - Philippines (%)
Place of birth for the foreign-born population - Singapore (%)
Place of birth for the foreign-born population - Thailand (%)
Place of birth for the foreign-born population - Vietnam (%)
Place of birth for the foreign-born population - Other South Eastern Asia (%)
Place of birth for the foreign-born population - Armenia (%)
Place of birth for the foreign-born population - Iraq (%)
Place of birth for the foreign-born population - Israel (%)
Place of birth for the foreign-born population - Jordan (%)
Place of birth for the foreign-born population - Kuwait (%)
Place of birth for the foreign-born population - Lebanon (%)
Place of birth for the foreign-born population - Saudi Arabia (%)
Place of birth for the foreign-born population - Syria (%)
Place of birth for the foreign-born population - Turkey (%)
Place of birth for the foreign-born population - Yemen (%)
Place of birth for the foreign-born population - Other Western Asia (%)
Place of birth for the foreign-born population - Eritrea (%)
Place of birth for the foreign-born population - Ethiopia (%)
Place of birth for the foreign-born population - Kenya (%)
Place of birth for the foreign-born population - Somalia (%)
Place of birth for the foreign-born population - Uganda (%)
Place of birth for the foreign-born population - Zimbabwe (%)
Place of birth for the foreign-born population - Other Eastern Africa (%)
Place of birth for the foreign-born population - Cameroon (%)
Place of birth for the foreign-born population - Congo (%)
Place of birth for the foreign-born population - Democratic Republic of Congo (Zaire) (%)
Place of birth for the foreign-born population - Other Middle Africa (%)
Place of birth for the foreign-born population - Egypt (%)
Place of birth for the foreign-born population - Morocco (%)
Place of birth for the foreign-born population - Sudan (%)
Place of birth for the foreign-born population - Other Northern Africa (%)
Place of birth for the foreign-born population - South Africa (%)
Place of birth for the foreign-born population - Other Southern Africa (%)
Place of birth for the foreign-born population - Cabo Verde (%)
Place of birth for the foreign-born population - Ghana (%)
Place of birth for the foreign-born population - Liberia (%)
Place of birth for the foreign-born population - Nigeria (%)
Place of birth for the foreign-born population - Senegal (%)
Place of birth for the foreign-born population - Sierra Leone (%)
Place of birth for the foreign-born population - Other Western Africa (%)
Place of birth for the foreign-born population - Australia (%)
Place of birth for the foreign-born population - New Zealand (%)
Place of birth for the foreign-born population - Fiji (%)
Place of birth for the foreign-born population - Micronesia (%)
Place of birth for the foreign-born population - Bahamas (%)
Place of birth for the foreign-born population - Barbados (%)
Place of birth for the foreign-born population - Cuba (%)
Place of birth for the foreign-born population - Dominica (%)
Place of birth for the foreign-born population - Dominican Republic (%)
Place of birth for the foreign-born population - Grenada (%)
Place of birth for the foreign-born population - Haiti (%)
Place of birth for the foreign-born population - Jamaica (%)
Place of birth for the foreign-born population - St. Vincent and the Grenadines (%)
Place of birth for the foreign-born population - Trinidad and Tobago (%)
Place of birth for the foreign-born population - West Indies (%)
Place of birth for the foreign-born population - Other Caribbean (%)
Place of birth for the foreign-born population - Belize (%)
Place of birth for the foreign-born population - Costa Rica (%)
Place of birth for the foreign-born population - El Salvador (%)
Place of birth for the foreign-born population - Guatemala (%)
Place of birth for the foreign-born population - Honduras (%)
Place of birth for the foreign-born population - Mexico (%)
Place of birth for the foreign-born population - Nicaragua (%)
Place of birth for the foreign-born population - Panama (%)
Place of birth for the foreign-born population - Other Central America (%)
Place of birth for the foreign-born population - Argentina (%)
Place of birth for the foreign-born population - Bolivia (%)
Place of birth for the foreign-born population - Brazil (%)
Place of birth for the foreign-born population - Chile (%)
Place of birth for the foreign-born population - Colombia (%)
Place of birth for the foreign-born population - Ecuador (%)
Place of birth for the foreign-born population - Guyana (%)
Place of birth for the foreign-born population - Peru (%)
Place of birth for the foreign-born population - Uruguay (%)
Place of birth for the foreign-born population - Venezuela (%)
Place of birth for the foreign-born population - Other South America (%)
Place of birth for the foreign-born population - Canada (%)
Place of birth for the foreign-born population - Other Northern America (%)
Place of birth for the foreign-born population - Other (%)
Latest news about races in Wyandanch, NY collected exclusively by city-data.com from local newspapers, TV, and radio stations
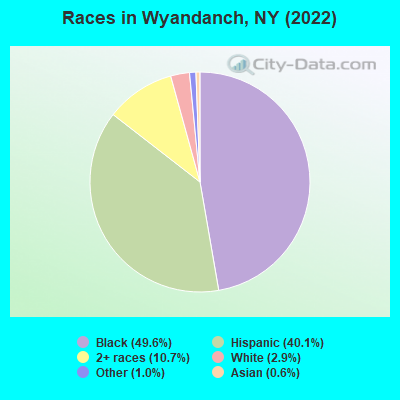
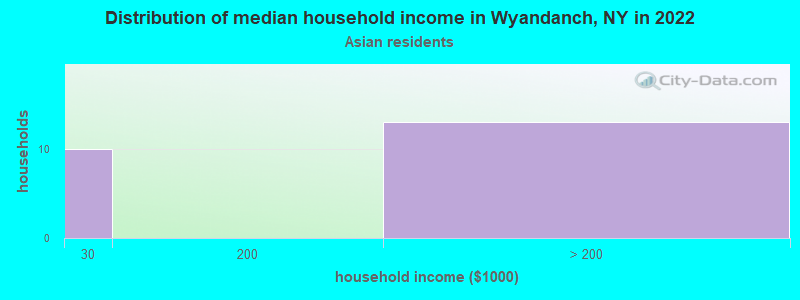
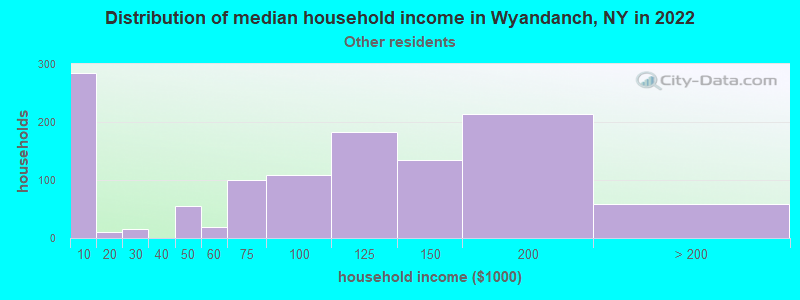
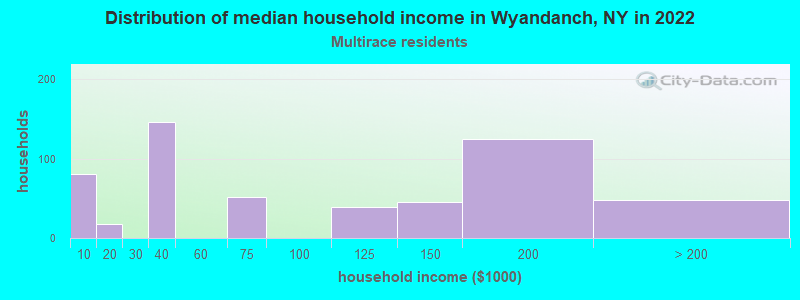
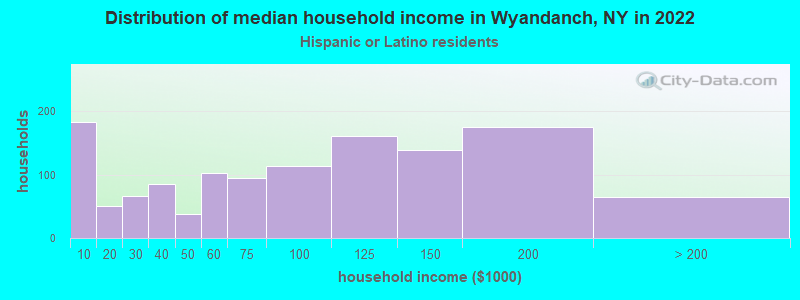
According to 2022 data, the most numerous races in Wyandanch, NY are White alone (395 residents), Hispanic (5,460 residents), and Black alone (6,752 residents). 61.6% of Wyandanch residents speak English at home. 27.0% of Wyandanch, NY residents are foreign-born (26.3% born in Latin America), which is 18.4% greater than the foreign-born rate of 22.0% across the entire state of New York.
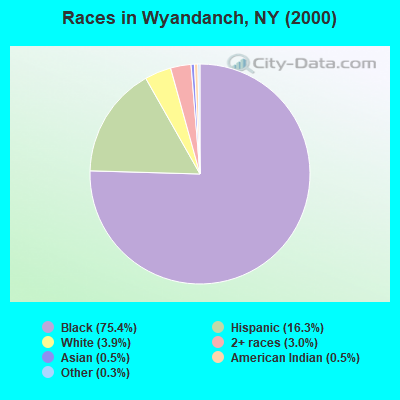
Race distribution in Wyandanch
2000 2022
11,760,981 62.0% White alone 2,867,583 15.1% Hispanic 2,812,623 14.8% Black alone 1,035,926 5.5% Asian alone 366,116 1.9% Two or more races 75,499 0.4% Other race alone 52,499 0.3% American Indian alone 5,230 0.03% Native Hawaiian and Other
10,408,933 52.9% White alone 3,867,299 19.7% Hispanic 2,633,840 13.4% Black alone 1,776,286 9.0% Asian alone 732,670 3.7% Two or more races 216,110 1.1% Other race alone 35,082 0.2% American Indian alone 6,931 0.04% Native Hawaiian and Other
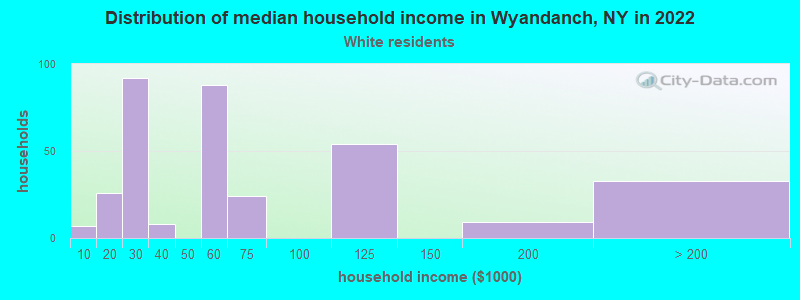
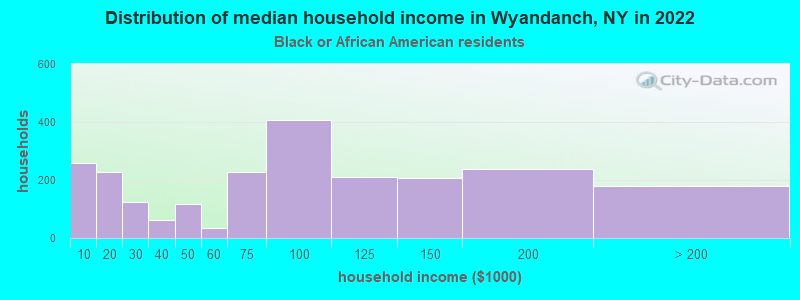
Income and house value in Wyandanch Median household income in 2022 $62,142 White non-Hispanic householders$82,673 Black householders$105,567 Some other race householders$90,328 Hispanic or Latino race householdersMedian 2022 house value $451,221 White Non-Hispanic householders$373,190 Black or African American householders$424,080 American Indian or Alaska Native householders $837,057 Asian householders$366,405 Some other race householders$404,958 Two or more races householders$397,864 Hispanic or Latino householders
Median age by race in Wyandanch
28.6 Median age for White residents27.5 37.9 40.0 Median age for Black or African American residents39.5 40.2 -748,832,865.7 Median age for American Indian / Alaska Native residents-807,017,543.1 -513,692,161.9 52.9 Median age for Asian residents-693,106,703.7 53.5 -742,816,091.2 Median age for Native Hawaiian / Pacific Islander residents-831,187,409.8 -771,300,447.7 30.8 Median age for Other race residents35.2 24.9 27.3 Median age for Two or more races residents34.6 25.7 28.3 Median age for White alone residents25.2 49.1 28.4 Median age for Hispanic or Latino residents34.0 22.0
Owner/renter occupied households by race in Wyandanch
House owners and renters - White residents 130 38.5% Owner occupied208 61.5% Renter occupiedHouse owners and renters - Black or African American residents 1,456 64.3% Owner occupied807 35.7% Renter occupiedHouse owners and renters - Asian residents 29 100.0% Owner occupiedHouse owners and renters - Other race residents 754 70.2% Owner occupied319 29.8% Renter occupiedHouse owners and renters - Two or more races residents 393 74.3% Owner occupied136 25.7% Renter occupiedHouse owners and renters - White alone residents 42 35.4% Owner occupied77 64.6% Renter occupiedHouse owners and renters - Hispanic or Latino residents 760 59.9% Owner occupied509 40.1% Renter occupied
Language usage in Wyandanch
English speakers - Total 61.6% of residents of Wyandanch speak English at home.
29.4% of residents speak Spanish at home 2,039 54.1% Speak English very well1,729 45.9% Speak English less than very well9.9% of residents speak other language at home 835 66.0% Speak English very well431 34.0% Speak English less than very well
English speakers - Born in the United States 91.2% of residents of Wyandanch speak English at home.
6.3% of residents speak Spanish at home 73 100.0% Speak English very well2.4% of residents speak other language at home 28 100.0% Speak English very well
English speakers - Native, born elsewhere 30.2% of residents of Wyandanch speak English at home.
51.9% of residents speak Spanish at home 265 88.0% Speak English very well36 12.0% Speak English less than very well11.7% of residents speak other language at home 31 45.6% Speak English very well37 54.4% Speak English less than very well
English speakers - Foreign-born 30.2% of residents of Wyandanch speak English at home.
50.3% of residents speak Spanish at home 454 23.2% Speak English very well1,500 76.8% Speak English less than very well20.1% of residents speak other language at home 396 50.7% Speak English very well385 49.3% Speak English less than very well
White (Caucasian) - Speak only English Native:
42.9% (293)Foreign-born:
9.9% (23)
White (Caucasian) - Speak another language Native:
43.3% (296)Foreign-born:
84.1% (199)
Black or African American - Speak only English Native:
88.7% (4,922)Foreign-born:
62.3% (855)
Black or African American - Speak another language Native:
11.1% (618)Foreign-born:
39.2% (539)
Other race - Speak only English Native:
34.4% (674)Foreign-born:
2.3% (46)
Other race - Speak another language Native:
65.0% (1,274)Foreign-born:
98.9% (2,021)
Two or more races - Speak only English Native:
70.7% (1,409)Foreign-born:
51.2% (417)
Two or more races - Speak another language Native:
29.4% (587)Foreign-born:
43.7% (356)
White alone - Speak only English Native:
70.1% (194)Foreign-born:
3.9% (3)
White alone - Speak another language Native:
31.7% (88)Foreign-born:
96.0% (73)
Hispanic or Latino - Speak only English Native:
36.7% (1,004)Foreign-born:
12.5% (280)
Hispanic or Latino - Speak another language Native:
62.5% (1,710)Foreign-born:
87.0% (1,950)
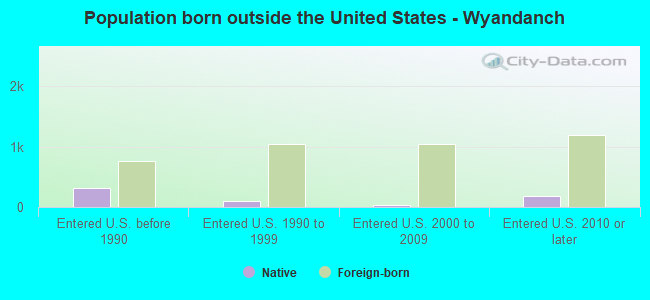
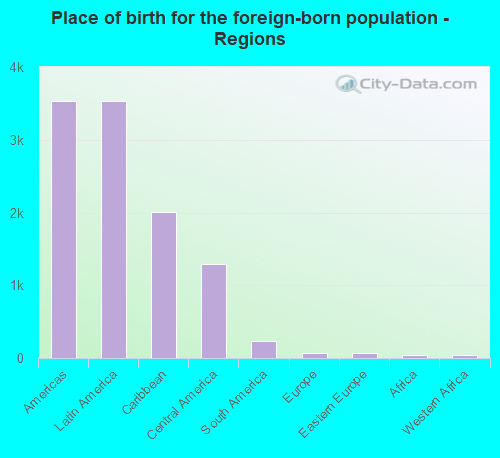
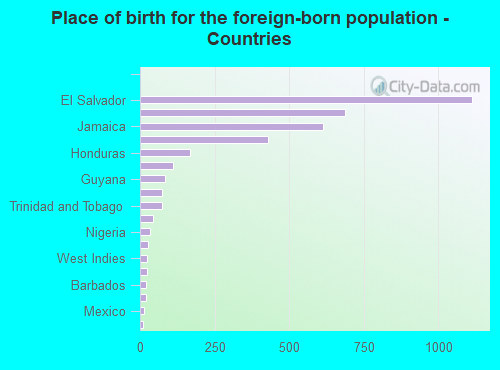
Foreign-born residents in Wyandanch 3,670 residents are foreign born (26.3% Latin America ).
This city:
27.0%New York:
22.6%
Marital status for residents in Wyandanch Marital status - White (Caucasian) population 15 years and over
Males 57.3% Never married38.5% Now married0.0% Separated0.0% Widowed4.3% DivorcedFemales 37.7% Never married17.7% Now married24.5% Separated17.9% Widowed2.1% DivorcedWomen who gave birth in the past 12 months Now married:
100.0% (9)Unmarried:
0.0% (0)
Women who did not give birth in the past 12 months Now married:
20.9% (42)Unmarried:
79.1% (160)
Marital status - Black or African American population 15 years and over
Males 50.3% Never married30.4% Now married4.6% Separated2.9% Widowed11.8% DivorcedFemales 44.6% Never married29.4% Now married6.6% Separated7.9% Widowed11.6% DivorcedWomen who gave birth in the past 12 months Now married:
0.0% (0)Unmarried:
100.0% (69)
Women who did not give birth in the past 12 months Now married:
29.0% (422)Unmarried:
71.0% (1,035)
Marital status - Asian population 15 years and over
Males 0.0% Never married100.0% Now married0.0% Separated0.0% Widowed0.0% DivorcedFemales 0.0% Never married71.4% Now married0.0% Separated0.0% Widowed28.6% DivorcedWomen who did not give birth in the past 12 months Now married:
100.0% (15)Unmarried:
0.0% (0)
Marital status - Other race population 15 years and over
Males 64.1% Never married33.4% Now married0.0% Separated0.0% Widowed2.5% DivorcedFemales 51.2% Never married33.7% Now married3.4% Separated0.0% Widowed11.7% DivorcedWomen who gave birth in the past 12 months Now married:
89.2% (48)Unmarried:
10.8% (6)
Women who did not give birth in the past 12 months Now married:
32.9% (405)Unmarried:
67.1% (827)
Marital status - Two or more races population 15 years and over
Males 78.5% Never married13.2% Now married0.0% Separated0.0% Widowed8.3% DivorcedFemales 58.4% Never married13.7% Now married6.3% Separated13.7% Widowed7.8% DivorcedWomen who did not give birth in the past 12 months Now married:
11.1% (66)Unmarried:
88.9% (530)
Marital status - White alone, not Hispanic / Latino population 15 years and over
Males 58.2% Never married41.8% Now married0.0% Separated0.0% Widowed0.0% DivorcedFemales 33.7% Never married36.6% Now married0.0% Separated29.7% Widowed0.0% DivorcedWomen who did not give birth in the past 12 months Now married:
44.1% (24)Unmarried:
55.9% (31)
Marital status - Hispanic or Latino population 15 years and over
Males 66.4% Never married28.4% Now married0.0% Separated1.1% Widowed4.1% DivorcedFemales 49.3% Never married26.7% Now married8.6% Separated3.9% Widowed11.5% DivorcedWomen who gave birth in the past 12 months Now married:
91.5% (44)Unmarried:
8.5% (4)
Women who did not give birth in the past 12 months Now married:
27.7% (357)Unmarried:
72.3% (934)
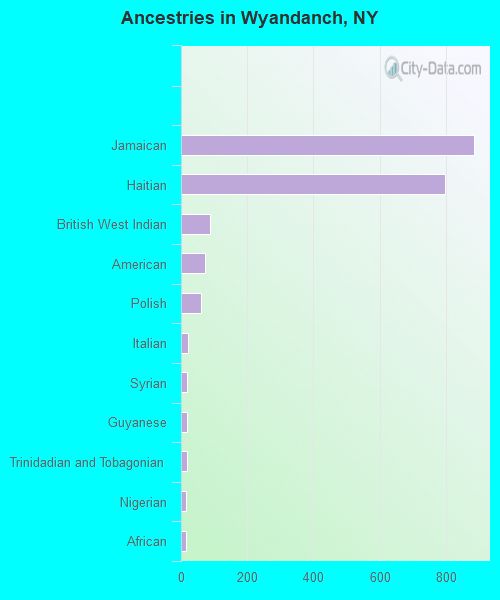
Ancestries in Wyandanch
886 11.7% Jamaican797 10.5% Haitian87 1.1% British West Indian72 0.9% American60 0.8% Polish21 0.3% Italian19 0.3% Syrian19 0.3% Guyanese17 0.2% Trinidadian and Tobagonian15 0.2% Nigerian15 0.2% African
Children Nativity (place of birth) in Wyandanch
Children under 6 years - Living with two parents Both parents native 6 100.0% NativeBoth parents foreign-born 114 100.0% NativeOne native, one foreign-born parent 152 100.0% NativeChildren under 6 years - Living with one parent Native parent 367 100.0% NativeForeign-born parent 210 100.0% NativeChildren 6 to 17 years - Living with two parents Both parents native 0 7.7% Foreign-bornBoth parents foreign-born 367 93.5% Native26 6.5% Foreign-bornOne native, one foreign-born parent 206 100.0% NativeChildren 6 to 17 years - Living with one parent Native parent 1,205 100.0% NativeForeign-born parent 414 52.9% Native369 47.1% Foreign-born
Grandparents responsible for own grandchildren in Wyandanch
Grandparents (30 to 59 years) Black or African American 59 41.6% Responsible for grandchildren82 58.4% Not responsible for grandchildrenOther race 95 30.0% Responsible for grandchildren222 70.0% Not responsible for grandchildrenHispanic or Latino 108 32.2% Responsible for grandchildren226 67.8% Not responsible for grandchildrenGrandparents (60 years and over) Black or African American 119 100.0% Not responsible for grandchildrenHispanic or Latino 40 53.4% Responsible for grandchildren35 46.6% Not responsible for grandchildren