Races in Wylie, Texas (TX) Detailed Stats
Data:
Races - White alone (%)
Races - White alone (% change since 2000)
Races - Black alone (%)
Races - Black alone (% change since 2000)
Races - American Indian alone (%)
Races - American Indian alone (% change since 2000)
Races - Asian alone (%)
Races - Asian alone (% change since 2000)
Races - Hispanic (%)
Races - Hispanic (% change since 2000)
Races - Native Hawaiian and Other Pacific Islander alone (%)
Races - Native Hawaiian and Other Pacific Islander alone (% change since 2000)
Races - Two or more races(%)
Races - Two or more races(% change since 2000)
Races - Other race alone (%)
Races - Other race alone (% change since 2000)
Racial diversity
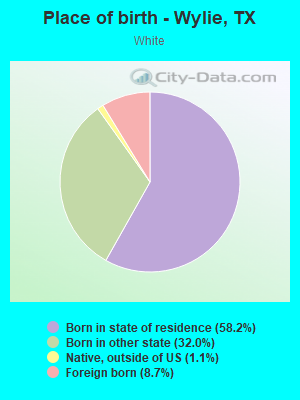
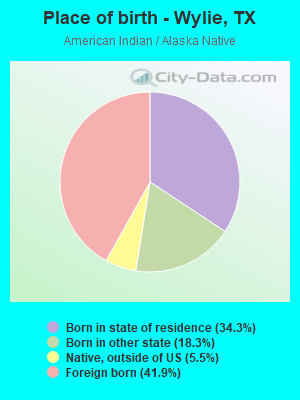
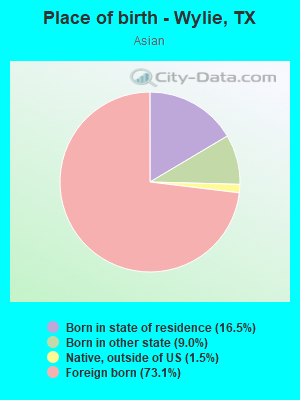
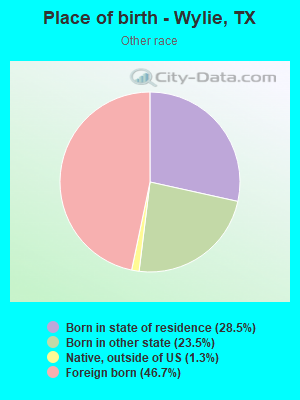
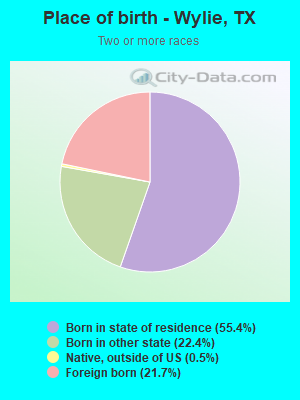
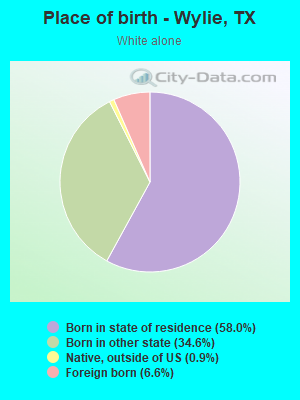
Place of birth - Born in state of residence (%)
Place of birth - Born in state of residence (%) - White
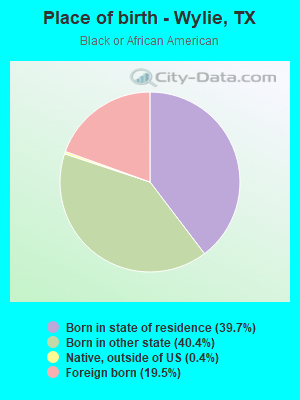
Place of birth - Born in state of residence (%) - Black or African American
Place of birth - Born in state of residence (%) - Asian
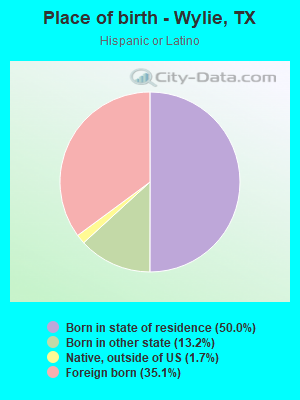
Place of birth - Born in state of residence (%) - Hispanic or Latino
Place of birth - Born in state of residence (%) - American Indian and Alaska Native
Place of birth - Born in state of residence (%) - Multirace
Place of birth - Born in state of residence (%) - Other Race
Place of birth - Born in other state (%)
Place of birth - Born in other state (%) - White
Place of birth - Born in other state (%) - Black or African American
Place of birth - Born in other state (%) - Asian
Place of birth - Born in other state (%) - Hispanic or Latino
Place of birth - Born in other state (%) - American Indian and Alaska Native
Place of birth - Born in other state (%) - Multirace
Place of birth - Born in other state (%) - Other Race
Place of birth - Native, outside of US (%)
Place of birth - Native, outside of US (%) - White
Place of birth - Native, outside of US (%) - Black or African American
Place of birth - Native, outside of US (%) - Asian
Place of birth - Native, outside of US (%) - Hispanic or Latino
Place of birth - Native, outside of US (%) - American Indian and Alaska Native
Place of birth - Native, outside of US (%) - Multirace
Place of birth - Native, outside of US (%) - Other Race
Place of birth - Foreign born (%)
Place of birth - Foreign born (%) - White
Place of birth - Foreign born (%) - Black or African American
Place of birth - Foreign born (%) - Asian
Place of birth - Foreign born (%) - Hispanic or Latino
Place of birth - Foreign born (%) - American Indian and Alaska Native
Place of birth - Foreign born (%) - Multirace
Place of birth - Foreign born (%) - Other Race
Residents speaking English at home (%)
Residents speaking English at home - Born in the United States (%)
Residents speaking English at home - Native, born elsewhere (%)
Residents speaking English at home - Foreign born (%)
Residents speaking Spanish at home (%)
Residents speaking Spanish at home - Born in the United States (%)
Residents speaking Spanish at home - Native, born elsewhere (%)
Residents speaking Spanish at home - Foreign born (%)
Residents speaking other language at home (%)
Residents speaking other language at home - Born in the United States (%)
Residents speaking other language at home - Native, born elsewhere (%)
Residents speaking other language at home - Foreign born (%)
Marital status - Never married (%)
Marital status - Now married (%)
Marital status - Separated (%)
Marital status - Widowed (%)
Marital status - Divorced (%)
Ancestries Reported - Arab (%)
Ancestries Reported - Czech (%)
Ancestries Reported - Danish (%)
Ancestries Reported - Dutch (%)
Ancestries Reported - English (%)
Ancestries Reported - French (%)
Ancestries Reported - French Canadian (%)
Ancestries Reported - German (%)
Ancestries Reported - Greek (%)
Ancestries Reported - Hungarian (%)
Ancestries Reported - Irish (%)
Ancestries Reported - Italian (%)
Ancestries Reported - Lithuanian (%)
Ancestries Reported - Norwegian (%)
Ancestries Reported - Polish (%)
Ancestries Reported - Portuguese (%)
Ancestries Reported - Russian (%)
Ancestries Reported - Scotch-Irish (%)
Ancestries Reported - Scottish (%)
Ancestries Reported - Slovak (%)
Ancestries Reported - Subsaharan African (%)
Ancestries Reported - Swedish (%)
Ancestries Reported - Swiss (%)
Ancestries Reported - Ukrainian (%)
Ancestries Reported - United States (%)
Ancestries Reported - Welsh (%)
Ancestries Reported - West Indian (%)
Ancestries Reported - Other (%)
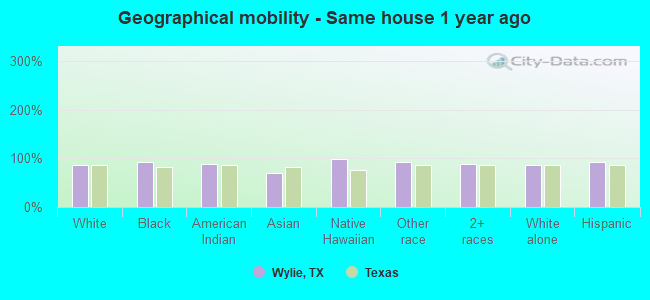
Geographical mobility - Same house 1 year ago (%)
Geographical mobility - Same house 1 year ago (%) - White
Geographical mobility - Same house 1 year ago (%) - Black or African American
Geographical mobility - Same house 1 year ago (%) - Asian
Geographical mobility - Same house 1 year ago (%) - Hispanic or Latino
Geographical mobility - Same house 1 year ago (%) - American Indian and Alaska Native
Geographical mobility - Same house 1 year ago (%) - Multirace
Geographical mobility - Same house 1 year ago (%) - Other Race
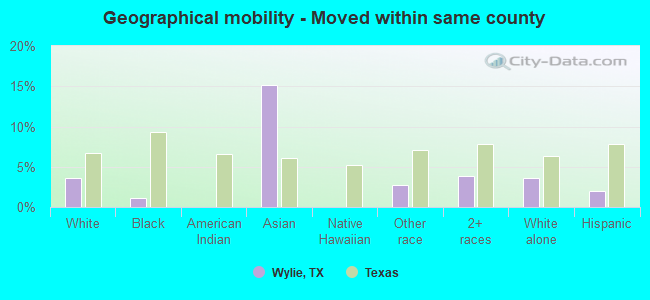
Geographical mobility - Moved within same county (%)
Geographical mobility - Moved within same county (%) - White
Geographical mobility - Moved within same county (%) - Black or African American
Geographical mobility - Moved within same county (%) - Asian
Geographical mobility - Moved within same county (%) - Hispanic or Latino
Geographical mobility - Moved within same county (%) - American Indian and Alaska Native
Geographical mobility - Moved within same county (%) - Multirace
Geographical mobility - Moved within same county (%) - Other Race
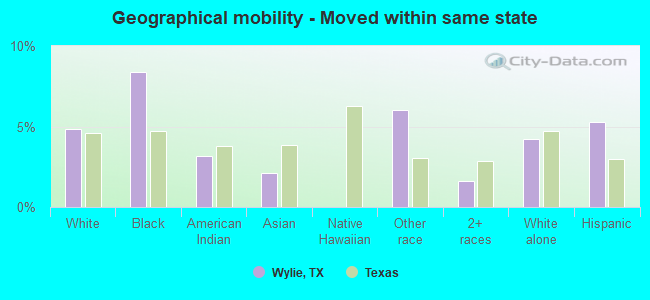
Geographical mobility - Moved from different county within same state (%)
Geographical mobility - Moved from different county within same state (%) - White
Geographical mobility - Moved from different county within same state (%) - Black or African American
Geographical mobility - Moved from different county within same state (%) - Asian
Geographical mobility - Moved from different county within same state (%) - Hispanic or Latino
Geographical mobility - Moved from different county within same state (%) - American Indian and Alaska Native
Geographical mobility - Moved from different county within same state (%) - Multirace
Geographical mobility - Moved from different county within same state (%) - Other Race
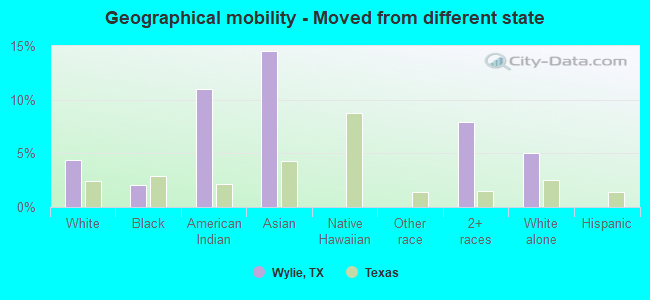
Geographical mobility - Moved from different state (%)
Geographical mobility - Moved from different state (%) - White
Geographical mobility - Moved from different state (%) - Black or African American
Geographical mobility - Moved from different state (%) - Asian
Geographical mobility - Moved from different state (%) - Hispanic or Latino
Geographical mobility - Moved from different state (%) - American Indian and Alaska Native
Geographical mobility - Moved from different state (%) - Multirace
Geographical mobility - Moved from different state (%) - Other Race
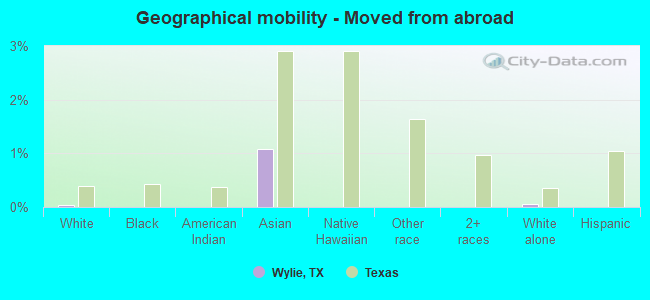
Geographical mobility - Moved from abroad (%)
Geographical mobility - Moved from abroad (%) - White
Geographical mobility - Moved from abroad (%) - Black or African American
Geographical mobility - Moved from abroad (%) - Asian
Geographical mobility - Moved from abroad (%) - Hispanic or Latino
Geographical mobility - Moved from abroad (%) - American Indian and Alaska Native
Geographical mobility - Moved from abroad (%) - Multirace
Geographical mobility - Moved from abroad (%) - Other Race
Place of birth for the foreign-born population - Ireland (%)
Place of birth for the foreign-born population - Denmark (%)
Place of birth for the foreign-born population - Norway (%)
Place of birth for the foreign-born population - Sweden (%)
Place of birth for the foreign-born population - United Kingdom (%)
Place of birth for the foreign-born population - England (%)
Place of birth for the foreign-born population - Scotland (%)
Place of birth for the foreign-born population - Other Northern Europe (%)
Place of birth for the foreign-born population - Austria (%)
Place of birth for the foreign-born population - Belgium (%)
Place of birth for the foreign-born population - France (%)
Place of birth for the foreign-born population - Germany (%)
Place of birth for the foreign-born population - Netherlands (%)
Place of birth for the foreign-born population - Switzerland (%)
Place of birth for the foreign-born population - Other Western Europe (%)
Place of birth for the foreign-born population - Greece (%)
Place of birth for the foreign-born population - Italy (%)
Place of birth for the foreign-born population - Portugal (%)
Place of birth for the foreign-born population - Spain (%)
Place of birth for the foreign-born population - Other Southern Europe (%)
Place of birth for the foreign-born population - Albania (%)
Place of birth for the foreign-born population - Belarus (%)
Place of birth for the foreign-born population - Bosnia and Herzegovina (%)
Place of birth for the foreign-born population - Bulgaria (%)
Place of birth for the foreign-born population - Croatia (%)
Place of birth for the foreign-born population - Czechoslovakia (%)
Place of birth for the foreign-born population - Hungary (%)
Place of birth for the foreign-born population - Latvia (%)
Place of birth for the foreign-born population - Lithuania (%)
Place of birth for the foreign-born population - North Macedonia (Macedonia) (%)
Place of birth for the foreign-born population - Moldova (%)
Place of birth for the foreign-born population - Poland (%)
Place of birth for the foreign-born population - Romania (%)
Place of birth for the foreign-born population - Russia (%)
Place of birth for the foreign-born population - Serbia (%)
Place of birth for the foreign-born population - Ukraine (%)
Place of birth for the foreign-born population - Other Eastern Europe (%)
Place of birth for the foreign-born population - China (%)
Place of birth for the foreign-born population - Hong Kong (%)
Place of birth for the foreign-born population - Taiwan (%)
Place of birth for the foreign-born population - Japan (%)
Place of birth for the foreign-born population - Korea (%)
Place of birth for the foreign-born population - Other Eastern Asia (%)
Place of birth for the foreign-born population - Afghanistan (%)
Place of birth for the foreign-born population - Bangladesh (%)
Place of birth for the foreign-born population - India (%)
Place of birth for the foreign-born population - Iran (%)
Place of birth for the foreign-born population - Kazakhstan (%)
Place of birth for the foreign-born population - Nepal (%)
Place of birth for the foreign-born population - Pakistan (%)
Place of birth for the foreign-born population - Sri Lanka (%)
Place of birth for the foreign-born population - Uzbekistan (%)
Place of birth for the foreign-born population - Other South Central Asia (%)
Place of birth for the foreign-born population - Burma (%)
Place of birth for the foreign-born population - Cambodia (%)
Place of birth for the foreign-born population - Indonesia (%)
Place of birth for the foreign-born population - Laos (%)
Place of birth for the foreign-born population - Malaysia (%)
Place of birth for the foreign-born population - Philippines (%)
Place of birth for the foreign-born population - Singapore (%)
Place of birth for the foreign-born population - Thailand (%)
Place of birth for the foreign-born population - Vietnam (%)
Place of birth for the foreign-born population - Other South Eastern Asia (%)
Place of birth for the foreign-born population - Armenia (%)
Place of birth for the foreign-born population - Iraq (%)
Place of birth for the foreign-born population - Israel (%)
Place of birth for the foreign-born population - Jordan (%)
Place of birth for the foreign-born population - Kuwait (%)
Place of birth for the foreign-born population - Lebanon (%)
Place of birth for the foreign-born population - Saudi Arabia (%)
Place of birth for the foreign-born population - Syria (%)
Place of birth for the foreign-born population - Turkey (%)
Place of birth for the foreign-born population - Yemen (%)
Place of birth for the foreign-born population - Other Western Asia (%)
Place of birth for the foreign-born population - Eritrea (%)
Place of birth for the foreign-born population - Ethiopia (%)
Place of birth for the foreign-born population - Kenya (%)
Place of birth for the foreign-born population - Somalia (%)
Place of birth for the foreign-born population - Uganda (%)
Place of birth for the foreign-born population - Zimbabwe (%)
Place of birth for the foreign-born population - Other Eastern Africa (%)
Place of birth for the foreign-born population - Cameroon (%)
Place of birth for the foreign-born population - Congo (%)
Place of birth for the foreign-born population - Democratic Republic of Congo (Zaire) (%)
Place of birth for the foreign-born population - Other Middle Africa (%)
Place of birth for the foreign-born population - Egypt (%)
Place of birth for the foreign-born population - Morocco (%)
Place of birth for the foreign-born population - Sudan (%)
Place of birth for the foreign-born population - Other Northern Africa (%)
Place of birth for the foreign-born population - South Africa (%)
Place of birth for the foreign-born population - Other Southern Africa (%)
Place of birth for the foreign-born population - Cabo Verde (%)
Place of birth for the foreign-born population - Ghana (%)
Place of birth for the foreign-born population - Liberia (%)
Place of birth for the foreign-born population - Nigeria (%)
Place of birth for the foreign-born population - Senegal (%)
Place of birth for the foreign-born population - Sierra Leone (%)
Place of birth for the foreign-born population - Other Western Africa (%)
Place of birth for the foreign-born population - Australia (%)
Place of birth for the foreign-born population - New Zealand (%)
Place of birth for the foreign-born population - Fiji (%)
Place of birth for the foreign-born population - Micronesia (%)
Place of birth for the foreign-born population - Bahamas (%)
Place of birth for the foreign-born population - Barbados (%)
Place of birth for the foreign-born population - Cuba (%)
Place of birth for the foreign-born population - Dominica (%)
Place of birth for the foreign-born population - Dominican Republic (%)
Place of birth for the foreign-born population - Grenada (%)
Place of birth for the foreign-born population - Haiti (%)
Place of birth for the foreign-born population - Jamaica (%)
Place of birth for the foreign-born population - St. Vincent and the Grenadines (%)
Place of birth for the foreign-born population - Trinidad and Tobago (%)
Place of birth for the foreign-born population - West Indies (%)
Place of birth for the foreign-born population - Other Caribbean (%)
Place of birth for the foreign-born population - Belize (%)
Place of birth for the foreign-born population - Costa Rica (%)
Place of birth for the foreign-born population - El Salvador (%)
Place of birth for the foreign-born population - Guatemala (%)
Place of birth for the foreign-born population - Honduras (%)
Place of birth for the foreign-born population - Mexico (%)
Place of birth for the foreign-born population - Nicaragua (%)
Place of birth for the foreign-born population - Panama (%)
Place of birth for the foreign-born population - Other Central America (%)
Place of birth for the foreign-born population - Argentina (%)
Place of birth for the foreign-born population - Bolivia (%)
Place of birth for the foreign-born population - Brazil (%)
Place of birth for the foreign-born population - Chile (%)
Place of birth for the foreign-born population - Colombia (%)
Place of birth for the foreign-born population - Ecuador (%)
Place of birth for the foreign-born population - Guyana (%)
Place of birth for the foreign-born population - Peru (%)
Place of birth for the foreign-born population - Uruguay (%)
Place of birth for the foreign-born population - Venezuela (%)
Place of birth for the foreign-born population - Other South America (%)
Place of birth for the foreign-born population - Canada (%)
Place of birth for the foreign-born population - Other Northern America (%)
Place of birth for the foreign-born population - Other (%)
Latest news about races in Wylie, TX collected exclusively by city-data.com from local newspapers, TV, and radio stations
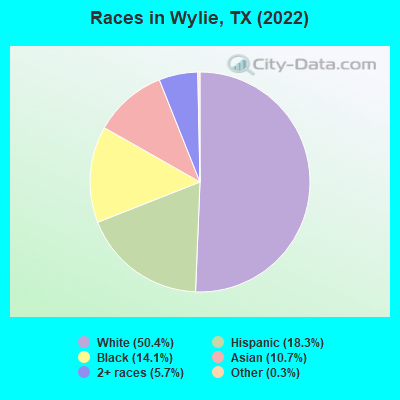
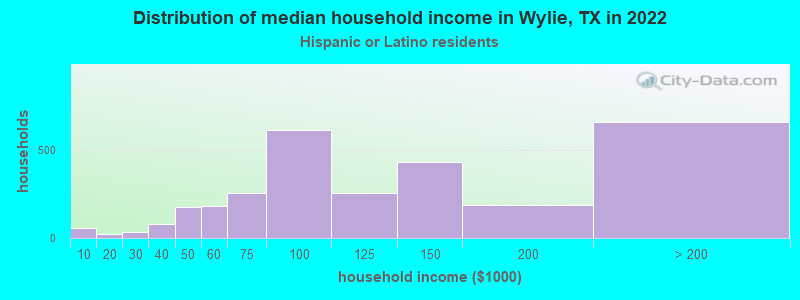
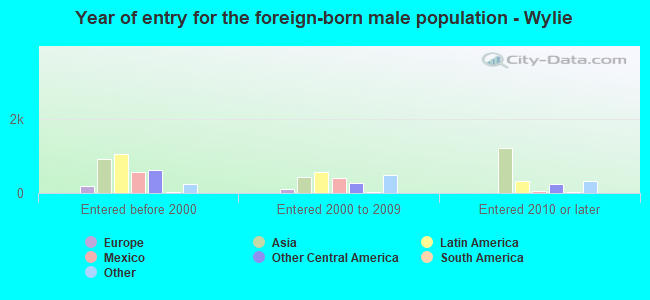
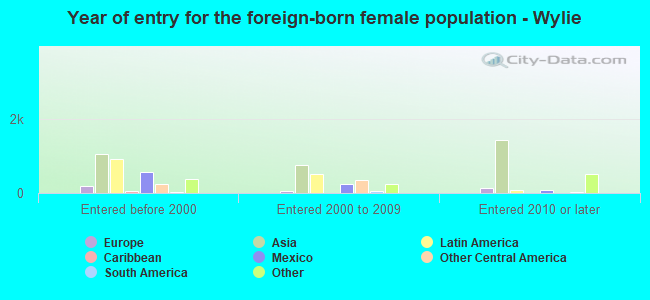
According to 2022 data, the most numerous races in Wylie, TX are Hispanic (11,195 residents), White alone (30,855 residents), and Black alone (8,662 residents). 71.9% of Wylie residents speak English at home. 19.7% of Wylie, TX residents are foreign-born (9.0% born in Asia, 6.7% born in Latin America, 3.1% born in Africa), which is 13.5% greater than the foreign-born rate of 17.0% across the entire state of Texas.
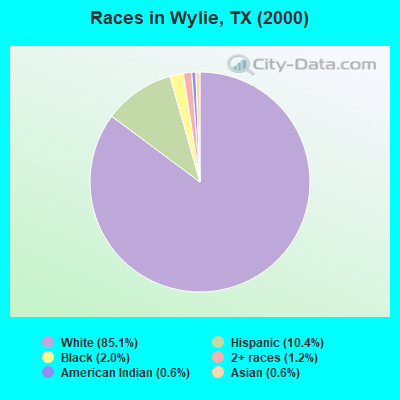
Race distribution in Wylie
2000 2022
10,933,313 52.4% White alone 6,669,666 32.0% Hispanic 2,364,255 11.3% Black alone 554,445 2.7% Asian alone 230,567 1.1% Two or more races 68,859 0.3% American Indian alone 19,958 0.10% Other race alone 10,757 0.05% Native Hawaiian and Other
12,070,642 40.2% Hispanic 11,683,430 38.9% White alone 3,508,706 11.7% Black alone 1,608,173 5.4% Asian alone 956,560 3.2% Two or more races 125,763 0.4% Other race alone 47,023 0.2% American Indian alone 29,275 0.10% Native Hawaiian and Other
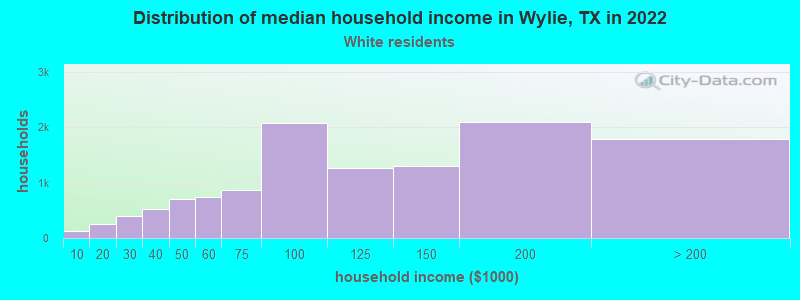
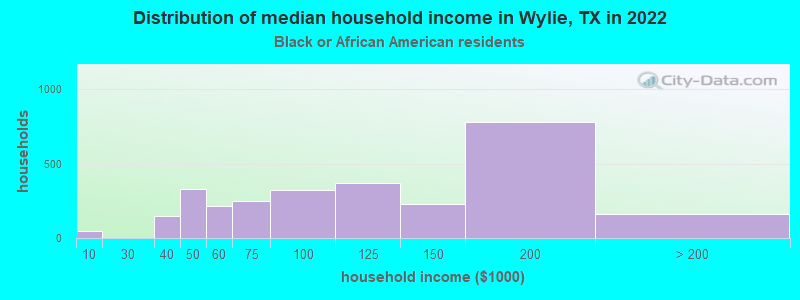
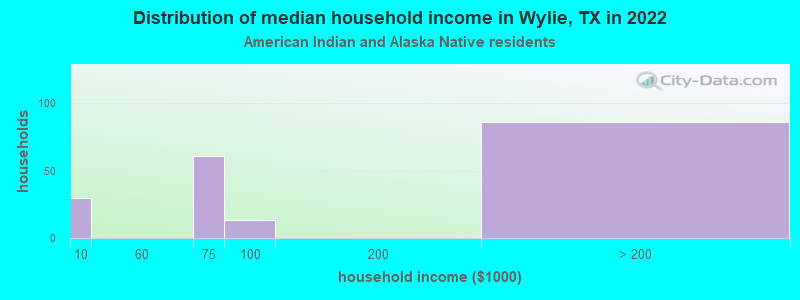
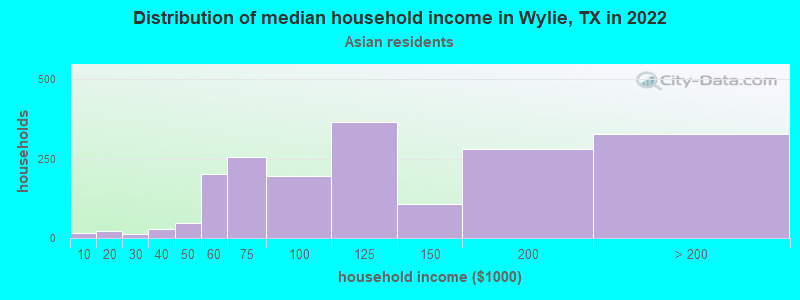
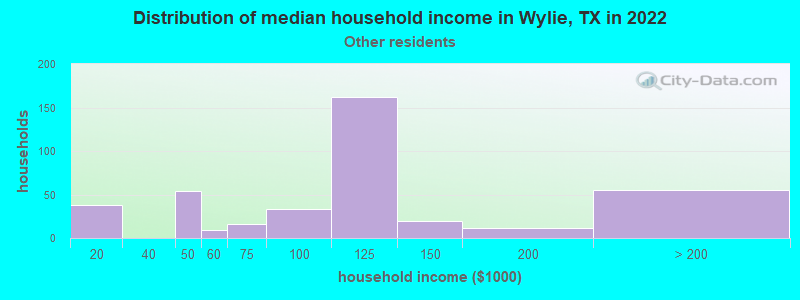
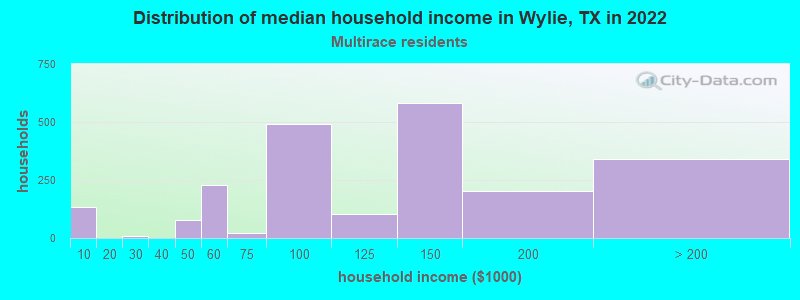
Income and house value in Wylie Median household income in 2022 $115,138 White non-Hispanic householders$103,617 Black householders$114,295 Asian householders$126,237 Some other race householders$103,637 Two or more races householders$101,887 Hispanic or Latino race householdersMedian 2022 house value $414,100 White Non-Hispanic householders$419,126 Black or African American householders $434,979 Asian householders$363,062 Some other race householders$394,767 Two or more races householders$362,289 Hispanic or Latino householders
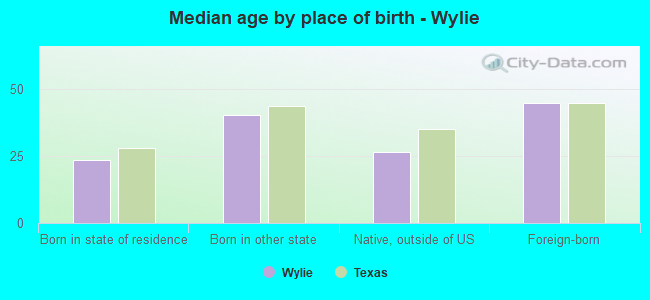
Median age by race in Wylie
37.3 Median age for White residents36.9 37.5 34.8 Median age for Black or African American residents30.0 37.4 65.7 Median age for American Indian / Alaska Native residents24.5 59.0 36.0 Median age for Asian residents39.8 34.6 -819,226,749.4 Median age for Native Hawaiian / Pacific Islander residents-770,894,787.8 -577,777,777.2 33.9 Median age for Other race residents33.3 34.3 23.1 Median age for Two or more races residents23.3 22.6 38.0 Median age for White alone residents37.5 38.4 27.7 Median age for Hispanic or Latino residents27.9 25.4
Owner/renter occupied households by race in Wylie
House owners and renters - White residents 9,487 77.4% Owner occupied2,772 22.6% Renter occupiedHouse owners and renters - Black or African American residents 2,229 76.1% Owner occupied698 23.9% Renter occupiedHouse owners and renters - American Indian / Alaska Native residents 67 100.0% Owner occupiedHouse owners and renters - Asian residents 1,715 92.7% Owner occupied136 7.3% Renter occupiedHouse owners and renters - Other race residents 307 84.3% Owner occupied57 15.7% Renter occupiedHouse owners and renters - Two or more races residents 1,252 56.3% Owner occupied970 43.7% Renter occupiedHouse owners and renters - White alone residents 8,862 78.9% Owner occupied2,373 21.1% Renter occupiedHouse owners and renters - Hispanic or Latino residents 1,847 65.2% Owner occupied986 34.8% Renter occupied
Language usage in Wylie
English speakers - Total 71.9% of residents of Wylie speak English at home.
12.5% of residents speak Spanish at home 4,391 61.8% Speak English very well2,710 38.2% Speak English less than very well15.2% of residents speak other language at home 5,517 63.9% Speak English very well3,119 36.1% Speak English less than very well
English speakers - Born in the United States 91.8% of residents of Wylie speak English at home.
4.3% of residents speak Spanish at home 585 81.0% Speak English very well137 19.0% Speak English less than very well3.7% of residents speak other language at home 626 100.0% Speak English very well
English speakers - Native, born elsewhere 64.5% of residents of Wylie speak English at home.
43.4% of residents speak Spanish at home 263 100.0% Speak English very well1.2% of residents speak other language at home 7 100.0% Speak English very well
English speakers - Foreign-born 14.6% of residents of Wylie speak English at home.
29.2% of residents speak Spanish at home 1,415 38.2% Speak English very well2,291 61.8% Speak English less than very well54.6% of residents speak other language at home 3,927 56.7% Speak English very well2,997 43.3% Speak English less than very well
White (Caucasian) - Speak only English Native:
93.2% (27,357)Foreign-born:
18.8% (573)
White (Caucasian) - Speak another language Native:
6.8% (1,982)Foreign-born:
80.7% (2,452)
Black or African American - Speak only English Native:
97.0% (6,541)Foreign-born:
25.3% (411)
Black or African American - Speak another language Native:
2.9% (196)Foreign-born:
75.1% (1,222)
American Indian / Alaska Native - Speak another language Native:
58.6% (84)Foreign-born:
85.5% (92)
Asian - Speak only English Native:
41.4% (534)Foreign-born:
14.3% (672)
Asian - Speak another language Native:
58.9% (759)Foreign-born:
86.0% (4,050)
Other race - Speak only English Native:
55.0% (513)Foreign-born:
1.9% (19)
Other race - Speak another language Native:
43.5% (405)Foreign-born:
100.0% (986)
Two or more races - Speak only English Native:
72.4% (4,280)Foreign-born:
6.1% (120)
Two or more races - Speak another language Native:
27.4% (1,622)Foreign-born:
94.1% (1,859)
White alone - Speak only English Native:
96.3% (26,027)Foreign-born:
24.8% (505)
White alone - Speak another language Native:
3.7% (995)Foreign-born:
75.4% (1,535)
Hispanic or Latino - Speak only English Native:
51.1% (3,222)Foreign-born:
2.9% (114)
Hispanic or Latino - Speak another language Native:
48.5% (3,058)Foreign-born:
96.6% (3,806)
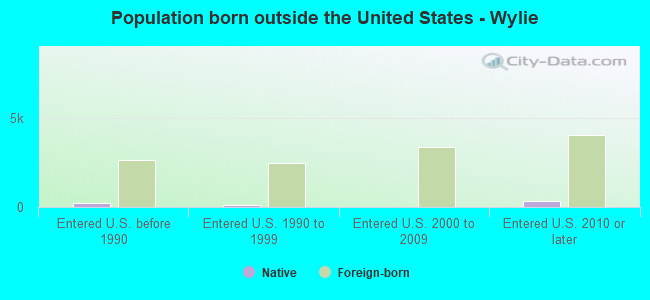
Foreign-born residents in Wylie 12,040 residents are foreign born (9.0% Asia , 6.7% Latin America , 3.1% Africa ).
This city:
19.7%Texas:
17.1%
Marital status for residents in Wylie Marital status - White (Caucasian) population 15 years and over
Males 28.0% Never married61.3% Now married0.6% Separated2.0% Widowed8.1% DivorcedFemales 26.6% Never married53.8% Now married1.3% Separated5.6% Widowed12.7% DivorcedWomen who gave birth in the past 12 months Now married:
90.4% (362)Unmarried:
9.6% (38)
Women who did not give birth in the past 12 months Now married:
53.1% (4,712)Unmarried:
46.9% (4,168)
Marital status - Black or African American population 15 years and over
Males 37.6% Never married49.6% Now married0.0% Separated0.4% Widowed12.3% DivorcedFemales 41.0% Never married37.4% Now married3.2% Separated5.3% Widowed13.1% DivorcedWomen who gave birth in the past 12 months Now married:
100.0% (18)Unmarried:
0.0% (0)
Women who did not give birth in the past 12 months Now married:
30.1% (762)Unmarried:
69.9% (1,774)
Marital status - American Indian / Alaska Native population 15 years and over
Males 62.1% Never married37.9% Now married0.0% Separated0.0% Widowed0.0% DivorcedFemales 12.3% Never married32.6% Now married24.6% Separated4.2% Widowed26.3% DivorcedWomen who gave birth in the past 12 months Now married:
0.0% (0)Unmarried:
100.0% (4)
Women who did not give birth in the past 12 months Now married:
88.5% (110)Unmarried:
11.5% (14)
Marital status - Asian population 15 years and over
Males 18.6% Never married76.7% Now married0.0% Separated0.0% Widowed4.8% DivorcedFemales 25.3% Never married56.0% Now married0.0% Separated9.7% Widowed9.1% DivorcedWomen who gave birth in the past 12 months Now married:
100.0% (143)Unmarried:
0.0% (0)
Women who did not give birth in the past 12 months Now married:
55.8% (1,133)Unmarried:
44.2% (897)
Marital status - Other race population 15 years and over
Males 30.0% Never married42.2% Now married10.6% Separated0.0% Widowed17.2% DivorcedFemales 37.4% Never married54.9% Now married2.6% Separated2.0% Widowed3.1% DivorcedWomen who gave birth in the past 12 months Now married:
100.0% (51)Unmarried:
0.0% (0)
Women who did not give birth in the past 12 months Now married:
44.3% (208)Unmarried:
55.7% (261)
Marital status - Two or more races population 15 years and over
Males 46.5% Never married49.3% Now married0.7% Separated2.2% Widowed1.3% DivorcedFemales 53.5% Never married32.4% Now married5.0% Separated1.8% Widowed7.3% DivorcedWomen who gave birth in the past 12 months Now married:
100.0% (48)Unmarried:
0.0% (0)
Women who did not give birth in the past 12 months Now married:
37.1% (941)Unmarried:
62.9% (1,598)
Marital status - White alone, not Hispanic / Latino population 15 years and over
Males 26.3% Never married62.3% Now married0.7% Separated2.4% Widowed8.3% DivorcedFemales 25.1% Never married54.1% Now married1.2% Separated5.9% Widowed13.8% DivorcedWomen who gave birth in the past 12 months Now married:
89.4% (337)Unmarried:
10.6% (40)
Women who did not give birth in the past 12 months Now married:
53.6% (4,326)Unmarried:
46.4% (3,745)
Marital status - Hispanic or Latino population 15 years and over
Males 35.6% Never married54.0% Now married2.4% Separated1.1% Widowed6.9% DivorcedFemales 38.5% Never married48.2% Now married5.1% Separated2.8% Widowed5.4% DivorcedWomen who gave birth in the past 12 months Now married:
100.0% (120)Unmarried:
0.0% (0)
Women who did not give birth in the past 12 months Now married:
47.6% (1,300)Unmarried:
52.4% (1,429)
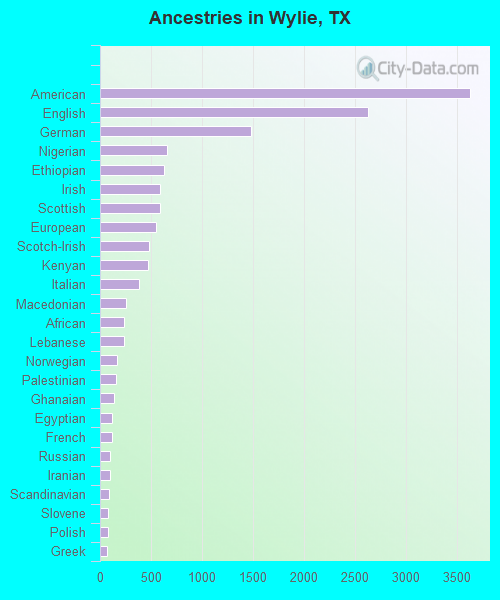
Ancestries in Wylie
3,636 11.6% American2,629 8.4% English1,478 4.7% German662 2.1% Nigerian624 2.0% Ethiopian592 1.9% Irish592 1.9% Scottish548 1.7% European485 1.5% Scotch-Irish472 1.5% Kenyan385 1.2% Italian254 0.8% Macedonian236 0.8% African234 0.7% Lebanese163 0.5% Norwegian158 0.5% Palestinian142 0.5% Ghanaian121 0.4% Egyptian113 0.4% French98 0.3% Russian95 0.3% Iranian91 0.3% Scandinavian79 0.3% Slovene75 0.2% Polish69 0.2% Greek64 0.2% French Canadian58 0.2% Turkish52 0.2% Zimbabwean51 0.2% Czechoslovakian40 0.1% Ukrainian40 0.1% Welsh35 0.1% Czech28 0.09% Armenian26 0.08% Canadian25 0.08% Dutch24 0.08% Moroccan24 0.08% Arab24 0.08% Brazilian23 0.07% Albanian23 0.07% Swiss20 0.06% British15 0.05% Croatian13 0.04% Trinidadian and Tobagonian10 0.03% Guyanese10 0.03% Finnish
Geographical mobility in Wylie Same house 1 year ago 29,726 87.2% White (Caucasian)8,032 91.6% Black or African American356 88.4% American Indian / Alaska Native4,501 69.5% Asian21 98.2% Native Hawaiian / Pacific Islander1,894 92.7% Other race7,709 87.5% Two or more races26,467 86.8% White alone, not Hispanic / Latino10,075 92.1% Hispanic or LatinoMoved within same county 1,213 3.6% White / Caucasian102 1.2% Black or African American979 15.1% Asian55 2.7% Other race337 3.8% Two or more races1,104 3.6% White alone, not Hispanic / Latino219 2.0% Hispanic or LatinoMoved within same state 1,650 4.8% White / Caucasian733 8.4% Black or African American13 3.2% American Indian / Alaska Native138 2.1% Asian123 6.0% Other race144 1.6% Two or more races1,289 4.2% White alone, not Hispanic / Latino575 5.3% Hispanic or LatinoMoved from different state 1,486 4.4% White / Caucasian178 2.0% Black or African American44 11.0% American Indian / Alaska Native942 14.5% Asian696 7.9% Two or more races1,523 5.0% White alone, not Hispanic / LatinoMoved from abroad 12 0.0% White70 1.1% Asian15 0.0% White alone, not Hispanic / Latino
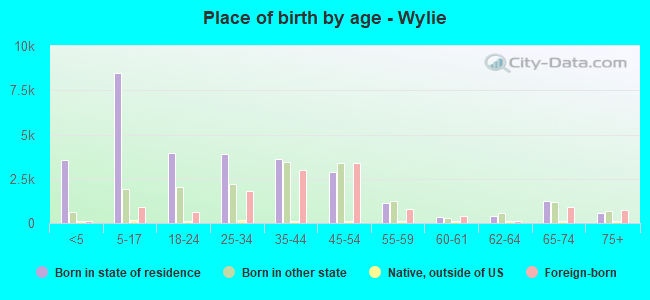
Children Nativity (place of birth) in Wylie
Children under 6 years - Living with two parents Both parents native 2,753 100.0% NativeBoth parents foreign-born 1,096 90.5% Native115 9.5% Foreign-bornOne native, one foreign-born parent 358 100.0% NativeChildren under 6 years - Living with one parent Native parent 822 100.0% NativeForeign-born parent 108 100.0% NativeChildren 6 to 17 years - Living with two parents Both parents native 5,289 100.0% NativeBoth parents foreign-born 1,213 59.7% Native820 40.3% Foreign-bornOne native, one foreign-born parent 828 94.7% Native47 5.3% Foreign-bornChildren 6 to 17 years - Living with one parent Native parent 1,812 100.0% NativeForeign-born parent 372 47.2% Native417 52.8% Foreign-born
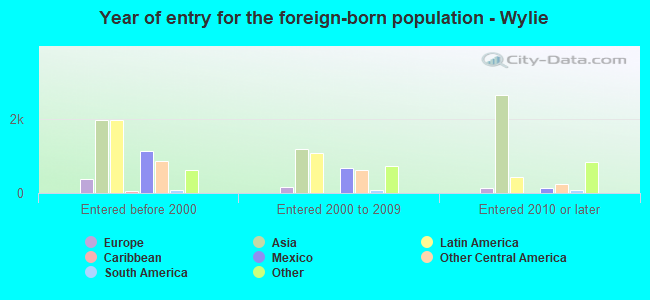
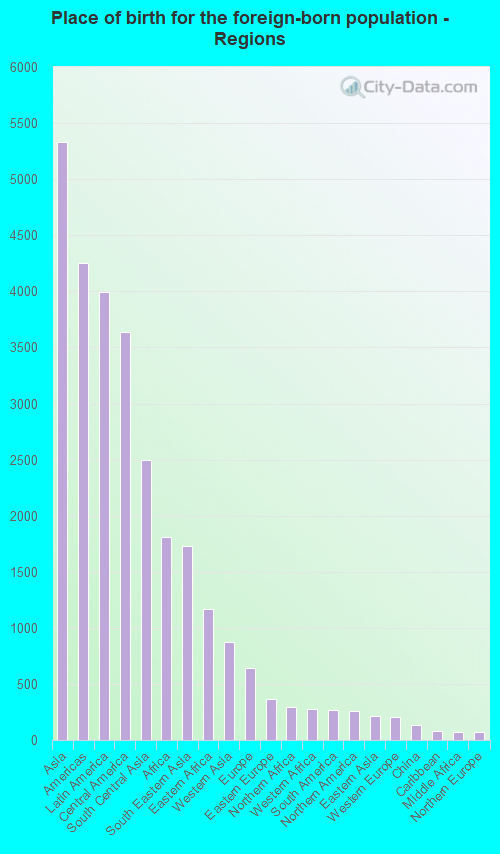
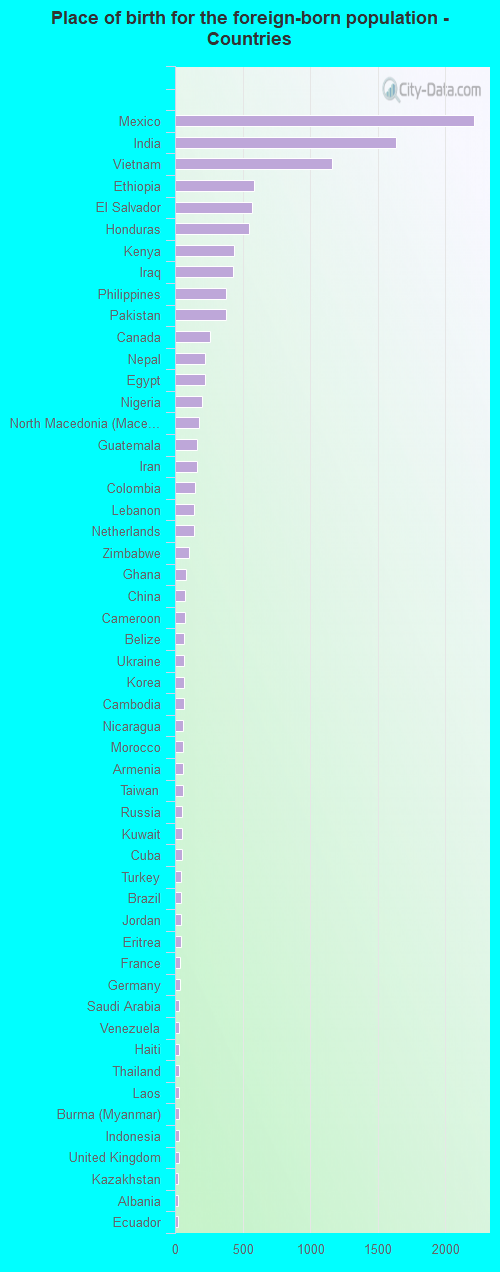
Place of birth for residents in Wylie 5,328 Asia4,254 Americas3,991 Latin America3,639 Central America2,493 South Central Asia1,810 Africa1,727 South Eastern Asia1,164 Eastern Africa877 Western Asia646 Europe369 Eastern Europe295 Northern Africa278 Western Africa268 South America262 Northern America217 Eastern Asia208 Western Europe135 China83 Caribbean71 Middle Africa68 Northern Europe2,213 Mexico1,638 India1,162 Vietnam583 Ethiopia567 El Salvador548 Honduras435 Kenya431 Iraq380 Philippines377 Pakistan262 Canada225 Nepal219 Egypt198 Nigeria174 North Macedonia (Macedonia)163 Guatemala161 Iran149 Colombia144 Lebanon137 Netherlands103 Zimbabwe79 Ghana77 China71 Cameroon70 Belize70 Ukraine69 Korea66 Cambodia61 Nicaragua60 Morocco58 Armenia58 Taiwan55 Russia55 Kuwait53 Cuba48 Turkey47 Brazil45 Jordan42 Eritrea36 France34 Germany33 Saudi Arabia32 Venezuela30 Haiti30 Thailand30 Laos30 Burma (Myanmar)27 Indonesia26 United Kingdom23 Kazakhstan23 Albania23 Ecuador17 Bangladesh15 Sudan15 Scotland15 Guyana14 Costa Rica13 England13 United Arab Emirates12 Norway12 Japan
Grandparents responsible for own grandchildren in Wylie
Grandparents (30 to 59 years) White / Caucasian 53 12.3% Responsible for grandchildren375 87.7% Not responsible for grandchildrenBlack or African American 131 100.0% Not responsible for grandchildrenAmerican Indian / Alaska Native 71 100.0% Responsible for grandchildrenAsian 20 100.0% Not responsible for grandchildrenOther race 19 14.8% Responsible for grandchildren109 85.2% Not responsible for grandchildrenTwo or more races 58 100.0% Responsible for grandchildrenWhite alone, not Hispanic / Latino 51 12.3% Responsible for grandchildren367 87.7% Not responsible for grandchildrenHispanic or Latino 88 58.2% Responsible for grandchildren63 41.8% Not responsible for grandchildrenGrandparents (60 years and over) White / Caucasian 69 22.9% Responsible for grandchildren232 77.1% Not responsible for grandchildrenBlack or African American 75 100.0% Not responsible for grandchildrenAmerican Indian / Alaska Native 16 100.0% Not responsible for grandchildrenAsian 22 4.6% Responsible for grandchildren464 95.4% Not responsible for grandchildrenTwo or more races 56 65.2% Responsible for grandchildren30 34.8% Not responsible for grandchildrenWhite alone, not Hispanic / Latino 66 21.6% Responsible for grandchildren242 78.4% Not responsible for grandchildrenHispanic or Latino 51 72.6% Responsible for grandchildren19 27.4% Not responsible for grandchildren