Races in Wyndham, Virginia (VA) Detailed Stats
Ancestries, Foreign-born residents, place of birth
Settings
X


Recent posts about races in Wyndham, Virginia on our local forum with over 2,400,000 registered users:

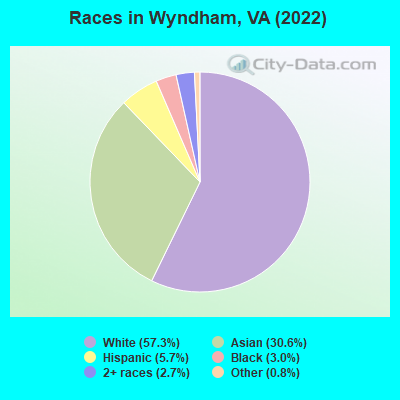
According to 2022 data, the most numerous races in Wyndham, VA are White alone (6,956 residents), Black alone (367 residents), and Hispanic (697 residents). 72.3% of Wyndham residents speak English at home. 23.7% of Wyndham, VA residents are foreign-born (20.0% born in Asia), which is 49.4% greater than the foreign-born rate of 12.0% across the entire state of Virginia.
Race distribution in Wyndham
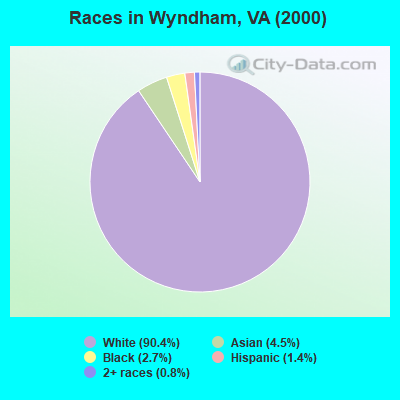
2000
2022

- 5,58590.4%White alone
- 2804.5%Asian alone
- 1642.7%Black alone
- 871.4%Hispanic
- 500.8%Two or more races
- 50.08%Other race alone
- 50.08%American Indian alone
-
- 6,95657.3%White alone
- 3,71230.6%Asian alone
- 6975.7%Hispanic
- 3673.0%Black alone
- 3272.7%Two or more races
- 930.8%Other race alone
- 20.02%American Indian alone
2000
2022
-
- 4,965,63770.2%White alone
- 1,376,37819.4%Black alone
- 329,5404.7%Hispanic
- 259,2773.7%Asian alone
- 114,0221.6%Two or more races
- 18,5960.3%American Indian alone
- 11,6850.2%Other race alone
- 3,3800.05%Native Hawaiian and Other
Pacific Islander alone

-
- 5,095,13058.7%White alone
- 1,594,78518.4%Black alone
- 905,75010.4%Hispanic
- 602,8816.9%Asian alone
- 406,0474.7%Two or more races
- 60,4190.7%Other race alone
- 11,7380.1%American Indian alone
- 6,8690.08%Native Hawaiian and Other
Pacific Islander alone

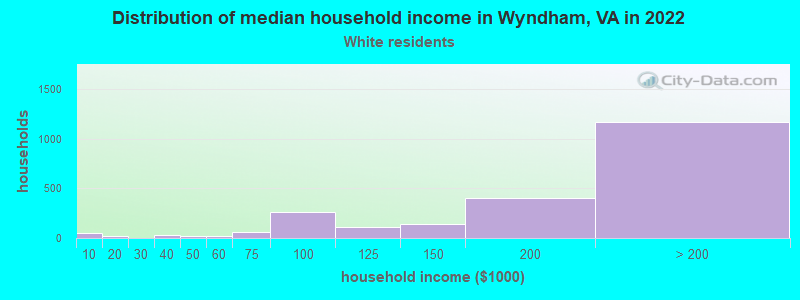
Income and house value in Wyndham
- Median household income in 2022
- over $200,000White non-Hispanic householders
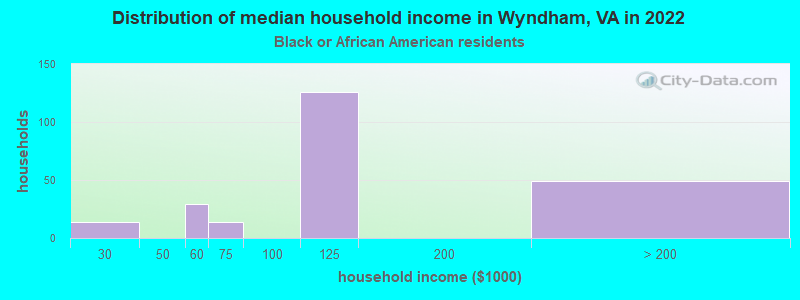
- $118,766Black householders
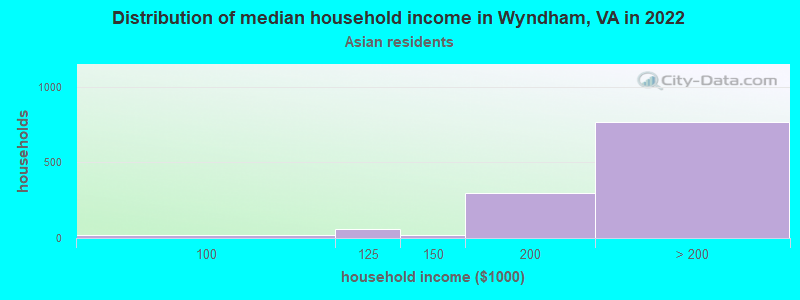
- over $200,000Asian householders
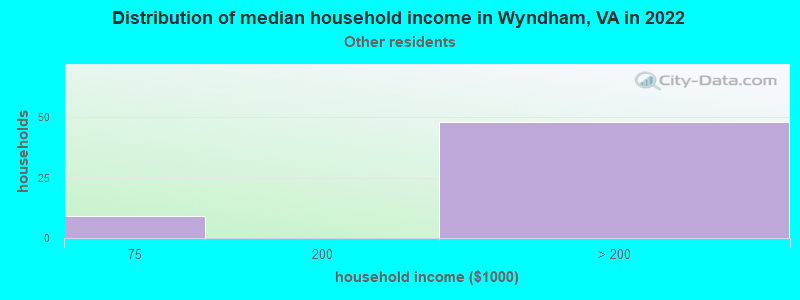
- over $200,000Some other race householders
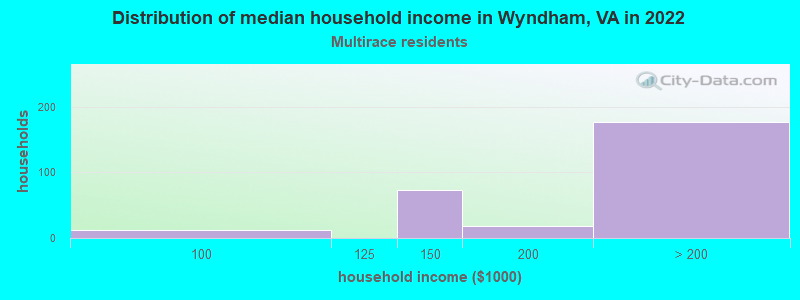
- $172,874Two or more races householders
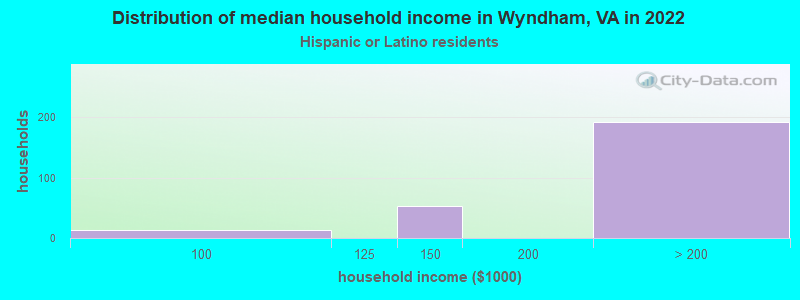
- over $200,000Hispanic or Latino race householders
- Median 2022 house value
- $755,029White Non-Hispanic householders
- $644,098Black or African American householders
- $531,018Asian householders
- $864,617Two or more races householders
- $822,716Hispanic or Latino householders
Household income for White non-Hispanic householders
Household income for Black householders
Household income for Asian householders
Household income for Some other race householders
Household income for Two or more races householders
Household income for Hispanic or Latino race householders
Median age by race in Wyndham
- 41.4Median age for White residents
- 40.9Males
- 42.1Females
- 38.1Median age for Black or African American residents
- 45.8Males
- 36.9Females
- -1,068,627,449.9Median age for American Indian / Alaska Native residents
- -402,222,221.8Males
- -687,861,271.0Females
- 40.7Median age for Asian residents
- 44.4Males
- 39.0Females
- -348,441,926.0Median age for Native Hawaiian / Pacific Islander residents
- -541,531,822.5Males
- -714,150,046.8Females
- 41.0Median age for Other race residents
- 38.7Males
- 13.7Females
- 23.0Median age for Two or more races residents
- 17.6Males
- 39.8Females
- 41.3Median age for White alone residents
- 40.5Males
- 42.4Females
- 37.1Median age for Hispanic or Latino residents
- 19.8Males
- 38.8Females
Owner/renter occupied households by race in Wyndham
- House owners and renters - White residents
- 2,20492.6%Owner occupied
- 1767.4%Renter occupied
- House owners and renters - Black or African American residents
- 7331.0%Owner occupied
- 16269.0%Renter occupied
- House owners and renters - American Indian / Alaska Native residents
- 6100.0%Owner occupied
- House owners and renters - Asian residents
- 1,05697.3%Owner occupied
- 302.7%Renter occupied
- House owners and renters - Other race residents
- 66100.0%Owner occupied
- House owners and renters - Two or more races residents
- 34097.3%Owner occupied
- 92.7%Renter occupied
- House owners and renters - White alone residents
- 2,20892.5%Owner occupied
- 1787.5%Renter occupied
- House owners and renters - Hispanic or Latino residents
- 280100.0%Owner occupied
Language usage in Wyndham
- English speakers - Total
- 72.3% of residents of Wyndham speak English at home.
- 3.4% of residents speak Spanish at home
- 37997.7%Speak English very well
- 92.3%Speak English less than very well
- 24.5% of residents speak other language at home
- 2,08274.1%Speak English very well
- 72825.9%Speak English less than very well
- English speakers - Born in the United States
- 93.6% of residents of Wyndham speak English at home.
- 5.5% of residents speak other language at home
- 21793.5%Speak English very well
- 156.5%Speak English less than very well
- English speakers - Native, born elsewhere
- 33.2% of residents of Wyndham speak English at home.
- 38.1% of residents speak Spanish at home
- 77100.0%Speak English very well
- English speakers - Foreign-born
- 15.4% of residents of Wyndham speak English at home.
- 8.8% of residents speak Spanish at home
- 24098.4%Speak English very well
- 41.6%Speak English less than very well
- 77.7% of residents speak other language at home
- 1,56772.3%Speak English very well
- 59927.7%Speak English less than very well
White (Caucasian) - Speak only English
| Native: | 98.4% (6,201) |
| Foreign-born: | 60.8% (136) |
White (Caucasian) - Speak another language
| Native: | 1.7% (107) |
| Foreign-born: | 41.8% (93) |
Asian - Speak only English
| Native: | 66.5% (1,016) |
| Foreign-born: | 15.6% (340) |
Asian - Speak another language
| Native: | 35.8% (548) |
| Foreign-born: | 82.5% (1,801) |
Two or more races - Speak only English
| Native: | 74.0% (509) |
| Foreign-born: | 10.8% (36) |
Two or more races - Speak another language
| Native: | 25.2% (173) |
| Foreign-born: | 88.9% (295) |
White alone - Speak only English
| Native: | 98.2% (6,221) |
| Foreign-born: | 57.6% (148) |
White alone - Speak another language
| Native: | 1.7% (109) |
| Foreign-born: | 42.8% (110) |
Hispanic or Latino - Speak another language
| Native: | 27.2% (137) |
| Foreign-born: | 100.0% (184) |
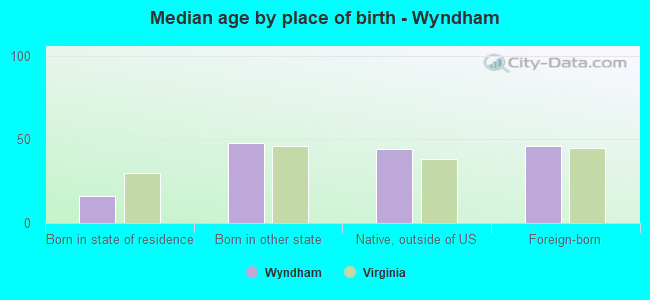
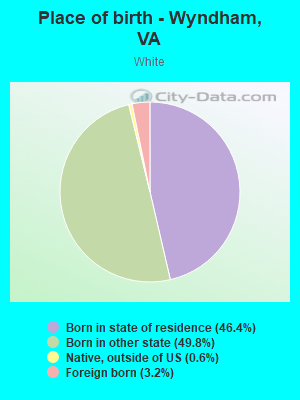
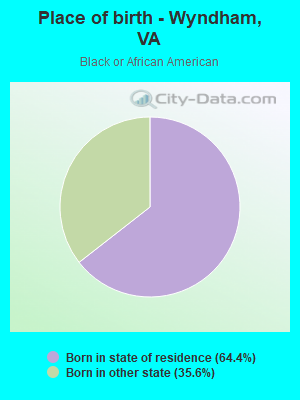
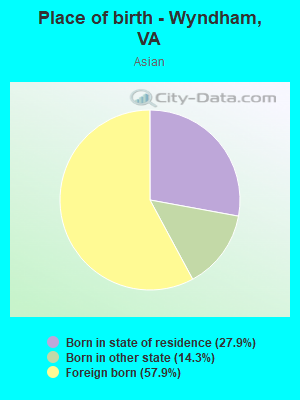
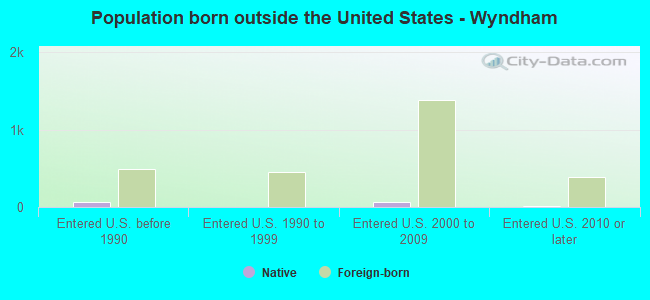
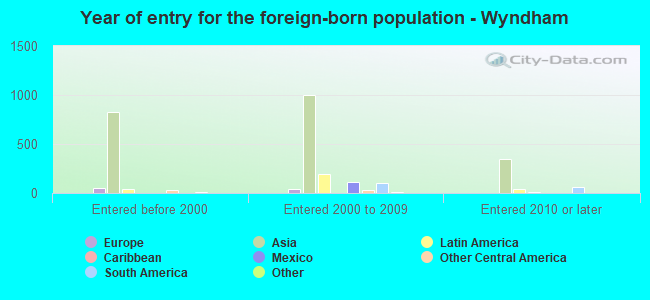
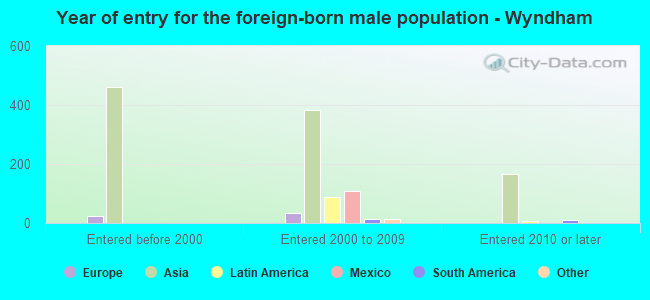
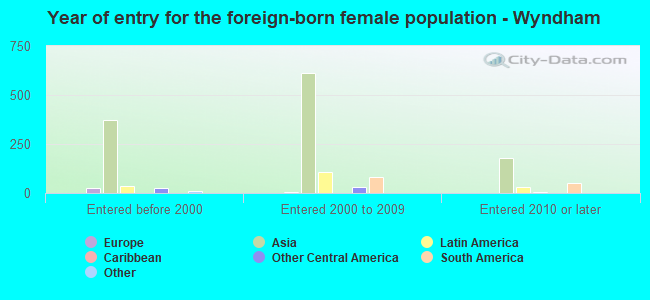
Foreign-born residents in Wyndham
2,879 residents are foreign born (20.0% Asia).
| This city: | 23.7% |
| Virginia: | 12.6% |
Marital status for residents in Wyndham
Marital status - White (Caucasian) population 15 years and over
- Males
- 20.9%Never married
- 71.3%Now married
- 0.0%Separated
- 0.9%Widowed
- 7.0%Divorced
- Females
- 17.7%Never married
- 65.7%Now married
- 0.8%Separated
- 7.5%Widowed
- 8.4%Divorced
Women who gave birth in the past 12 months
| Now married: | 100.0% (46) |
| Unmarried: | 0.0% (0) |
Women who did not give birth in the past 12 months
| Now married: | 66.0% (854) |
| Unmarried: | 34.0% (440) |
Marital status - Black or African American population 15 years and over
- Males
- 57.8%Never married
- 42.2%Now married
- 0.0%Separated
- 0.0%Widowed
- 0.0%Divorced
- Females
- 65.9%Never married
- 22.0%Now married
- 0.0%Separated
- 5.1%Widowed
- 7.0%Divorced
Women who did not give birth in the past 12 months
| Now married: | 0.0% (0) |
| Unmarried: | 100.0% (153) |
Marital status - Asian population 15 years and over
- Males
- 13.6%Never married
- 86.4%Now married
- 0.0%Separated
- 0.0%Widowed
- 0.0%Divorced
- Females
- 25.2%Never married
- 74.8%Now married
- 0.0%Separated
- 0.0%Widowed
- 0.0%Divorced
Women who gave birth in the past 12 months
| Now married: | 100.0% (15) |
| Unmarried: | 0.0% (0) |
Women who did not give birth in the past 12 months
| Now married: | 69.7% (894) |
| Unmarried: | 30.3% (389) |
Marital status - Other race population 15 years and over
- Males
- 0.0%Never married
- 100.0%Now married
- 0.0%Separated
- 0.0%Widowed
- 0.0%Divorced
- Females
- 0.0%Never married
- 56.2%Now married
- 0.0%Separated
- 43.8%Widowed
- 0.0%Divorced
Women who did not give birth in the past 12 months
| Now married: | 100.0% (11) |
| Unmarried: | 0.0% (0) |
Marital status - Two or more races population 15 years and over
- Males
- 50.0%Never married
- 50.0%Now married
- 0.0%Separated
- 0.0%Widowed
- 0.0%Divorced
- Females
- 12.0%Never married
- 84.4%Now married
- 0.0%Separated
- 0.0%Widowed
- 3.6%Divorced
Women who did not give birth in the past 12 months
| Now married: | 82.2% (204) |
| Unmarried: | 17.8% (44) |
Marital status - White alone, not Hispanic / Latino population 15 years and over
- Males
- 20.9%Never married
- 71.3%Now married
- 0.0%Separated
- 0.9%Widowed
- 7.0%Divorced
- Females
- 17.8%Never married
- 65.5%Now married
- 0.8%Separated
- 7.5%Widowed
- 8.4%Divorced
Women who gave birth in the past 12 months
| Now married: | 100.0% (47) |
| Unmarried: | 0.0% (0) |
Women who did not give birth in the past 12 months
| Now married: | 65.7% (859) |
| Unmarried: | 34.3% (448) |
Marital status - Hispanic or Latino population 15 years and over
- Males
- 59.2%Never married
- 40.8%Now married
- 0.0%Separated
- 0.0%Widowed
- 0.0%Divorced
- Females
- 5.2%Never married
- 90.8%Now married
- 0.0%Separated
- 0.0%Widowed
- 4.0%Divorced
Women who did not give birth in the past 12 months
| Now married: | 91.8% (147) |
| Unmarried: | 8.2% (13) |
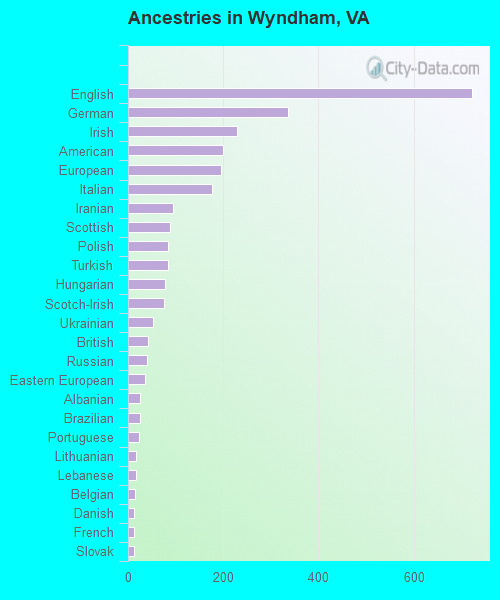
Ancestries in Wyndham

- 72212.3%English
- 3375.7%German
- 2293.9%Irish
- 2003.4%American
- 1953.3%European
- 1763.0%Italian
- 951.6%Iranian
- 881.5%Scottish
- 831.4%Polish
- 831.4%Turkish
- 771.3%Hungarian
- 761.3%Scotch-Irish
- 520.9%Ukrainian
- 420.7%British
- 390.7%Russian
- 350.6%Eastern European
- 250.4%Albanian
- 250.4%Brazilian
- 230.4%Portuguese
- 170.3%Lithuanian
- 160.3%Lebanese
- 140.2%Belgian
- 130.2%Danish
- 120.2%French
- 120.2%Slovak
- 110.2%Northern European
- 100.2%Austrian
- 90.2%Greek
- 80.1%Welsh
- 60.1%Latvian
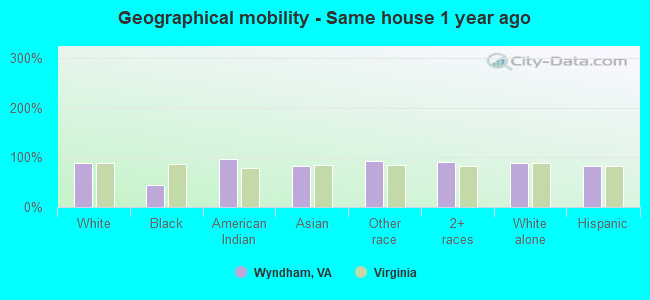
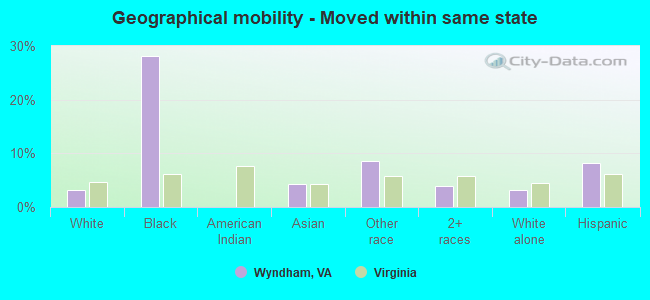
Geographical mobility in Wyndham

- Same house 1 year ago
- 6,00387.6%White (Caucasian)
- 16344.0%Black or African American
- 596.1%American Indian / Alaska Native
- 3,07882.4%Asian
- 9693.4%Other race
- 1,07790.6%Two or more races
- 6,11388.1%White alone, not Hispanic / Latino
- 58183.0%Hispanic or Latino
-
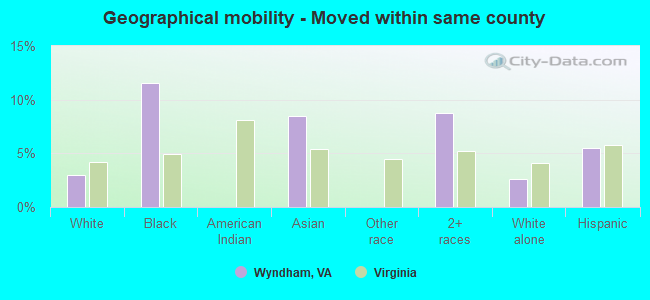
- Moved within same county
- 2053.0%White / Caucasian
- 4311.6%Black or African American
- 3188.5%Asian
- 1048.7%Two or more races
- 1812.6%White alone, not Hispanic / Latino
- 395.5%Hispanic or Latino
-
- Moved within same state
- 2203.2%White / Caucasian
- 10428.2%Black or African American
- 1634.4%Asian
- 98.7%Other race
- 474.0%Two or more races
- 2193.2%White alone, not Hispanic / Latino
- 588.2%Hispanic or Latino
-
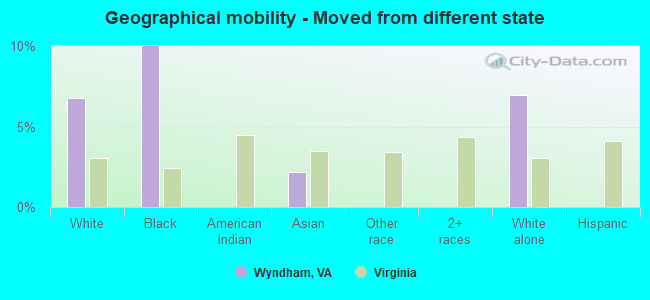
- Moved from different state
- 4636.8%White / Caucasian
- 3710.0%Black or African American
- 812.2%Asian
- 4847.0%White alone, not Hispanic / Latino
-
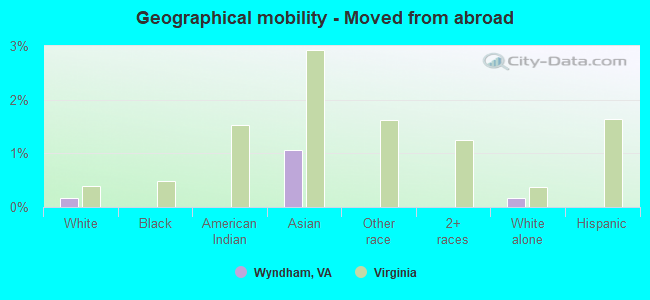
- Moved from abroad
- 120.2%White
- 401.1%Asian
- 120.2%White alone, not Hispanic / Latino
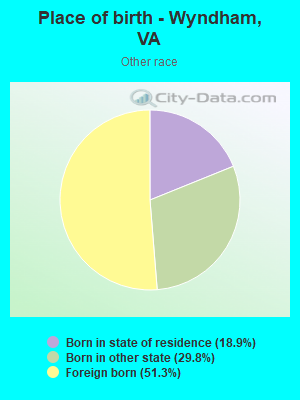
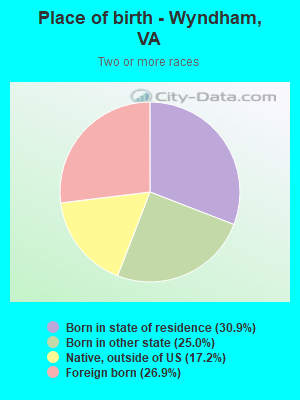
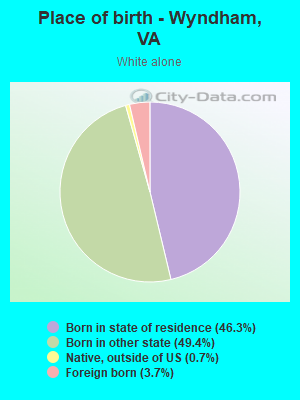
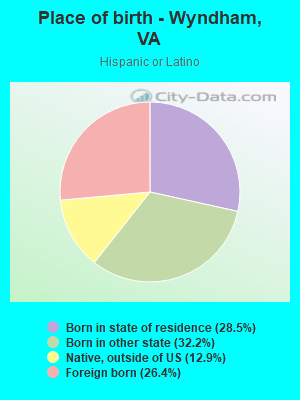
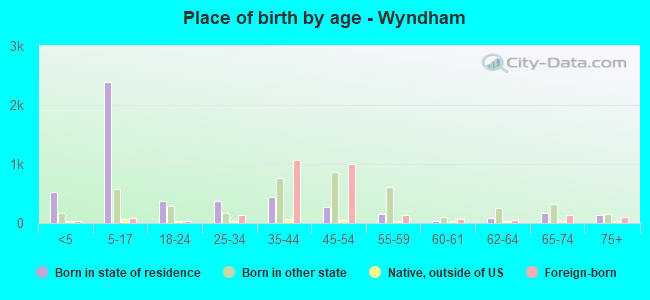
Children Nativity (place of birth) in Wyndham
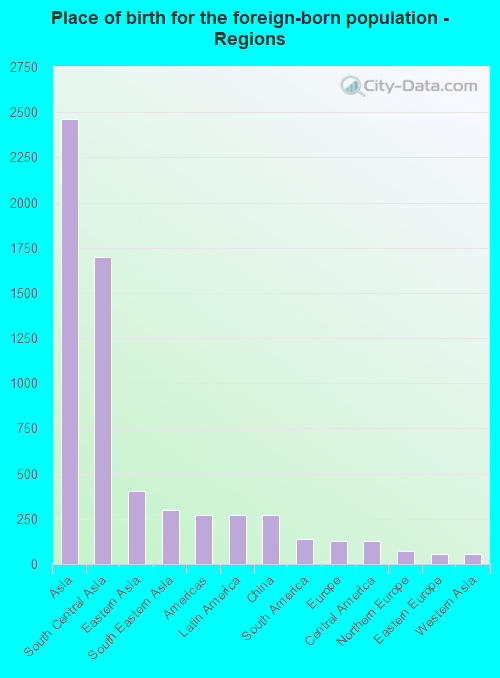
Place of birth for residents in Wyndham
![Place of birth for the foreign-born population - Regions]()
- 2,462Asia
- 1,701South Central Asia
- 405Eastern Asia
- 298South Eastern Asia
- 273Americas
- 273Latin America
- 270China
- 139South America
- 128Europe
- 126Central America
- 72Northern Europe
- 56Eastern Europe
- 56Western Asia
- 7Africa
- 7Eastern Africa
- 7Oceania
- 7Caribbean
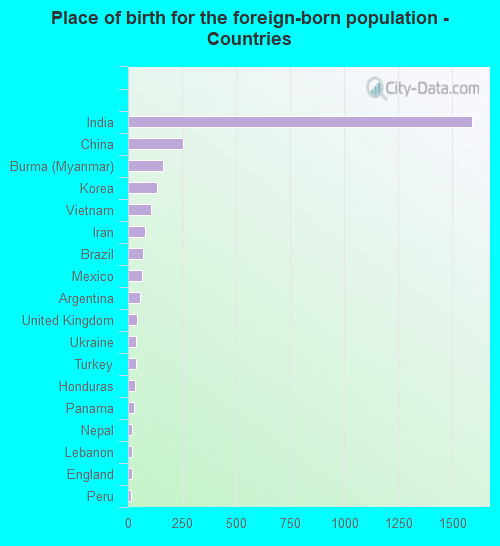
![Place of birth for the foreign-born population - Countries]()
- 1,591India
- 256China
- 163Burma (Myanmar)
- 134Korea
- 108Vietnam
- 79Iran
- 68Brazil
- 64Mexico
- 55Argentina
- 40United Kingdom
- 38Ukraine
- 36Turkey
- 32Honduras
- 29Panama
- 20Nepal
- 20Lebanon
- 18England
- 15Peru
- 14Taiwan
- 14Philippines
- 13Scotland
- 12Malaysia
- 11Bangladesh
- 10Latvia
- 8Poland
- 7Kenya
- 7Fiji
- 7Trinidad and Tobago
Zip codes: 23059.