Races in Wyomissing Hills, Pennsylvania (PA) Detailed Stats
Ancestries, Foreign-born residents, place of birth

Recent posts about races in Wyomissing Hills, Pennsylvania on our local forum with over 2,400,000 registered users:
 | Relocating to PA - Reading area - help! (6 replies) |
9.7% of Wyomissing Hills, PA residents are foreign-born (4.3% born in Europe, 3.0% born in Asia), which is 27.8% greater than the foreign-born rate of 7.0% across the entire state of Pennsylvania.
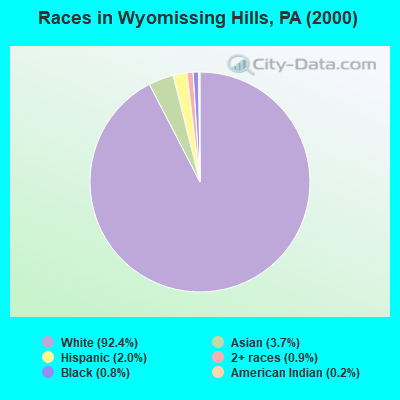
Race distribution in Wyomissing Hills

- 2,37292.4%White alone
- 943.7%Asian alone
- 522.0%Hispanic
- 240.9%Two or more races
- 210.8%Black alone
- 40.2%American Indian alone
- 10.04%Other race alone
2000
2022
-
- 10,322,45584.1%White alone
- 1,202,4379.8%Black alone
- 394,0883.2%Hispanic
- 218,2961.8%Asian alone
- 113,0970.9%Two or more races
- 13,0860.1%Other race alone
- 14,9040.1%American Indian alone
- 2,6910.02%Native Hawaiian and Other
Pacific Islander alone

-
- 9,487,22873.1%White alone
- 1,311,58110.1%Black alone
- 1,115,9978.6%Hispanic
- 493,9423.8%Two or more races
- 487,1243.8%Asian alone
- 63,5820.5%Other race alone
- 10,1300.08%American Indian alone
- 2,4240.02%Native Hawaiian and Other
Pacific Islander alone

Income and house value in Wyomissing Hills
- Median household income in 2022
- $104,253White non-Hispanic householders
- over $200,000Asian householders
- $122,304Two or more races householders
- $117,476Hispanic or Latino race householders
- Median 2022 house value
- $313,340White Non-Hispanic householders
- $408,674Asian householders
- $378,956Two or more races householders
- $184,248Hispanic or Latino householders
Household income for White non-Hispanic householders

Household income for Asian householders

Household income for Two or more races householders

Household income for Hispanic or Latino race householders

Foreign-born residents in Wyomissing Hills
249 residents are foreign born (4.3% Europe, 3.0% Asia).
| This city: | 9.7% |
| Pennsylvania: | 4.1% |
Ancestries in Wyomissing Hills

- 89528.0%German
- 50215.7%Italian
- 36911.6%Irish
- 33910.6%Other
- 2548.0%Polish
- 1996.2%English
- 772.4%United States
- 692.2%Scottish
- 611.9%French
- 601.9%Welsh
- 591.8%Dutch
- 421.3%Scotch-Irish
- 371.2%Slovak
- 280.9%French Canadian
- 280.9%Swiss
- 270.8%Russian
- 250.8%Ukrainian
- 240.8%Greek
- 230.7%Czech
- 210.7%Hungarian
- 200.6%Swedish
- 130.4%Norwegian
- 90.3%Portuguese
- 60.2%Arab
- 60.2%West Indian

Zip codes: 19610.