Races in Yeadon, Pennsylvania (PA) Detailed Stats
Data:
Races - White alone (%)
Races - White alone (% change since 2000)
Races - Black alone (%)
Races - Black alone (% change since 2000)
Races - American Indian alone (%)
Races - American Indian alone (% change since 2000)
Races - Asian alone (%)
Races - Asian alone (% change since 2000)
Races - Hispanic (%)
Races - Hispanic (% change since 2000)
Races - Native Hawaiian and Other Pacific Islander alone (%)
Races - Native Hawaiian and Other Pacific Islander alone (% change since 2000)
Races - Two or more races(%)
Races - Two or more races(% change since 2000)
Races - Other race alone (%)
Races - Other race alone (% change since 2000)
Racial diversity
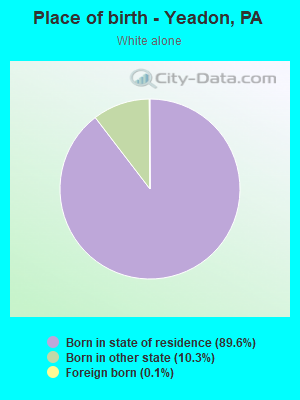
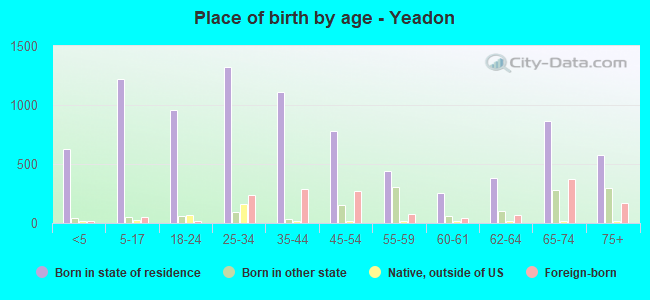
Place of birth - Born in state of residence (%)
Place of birth - Born in state of residence (%) - White
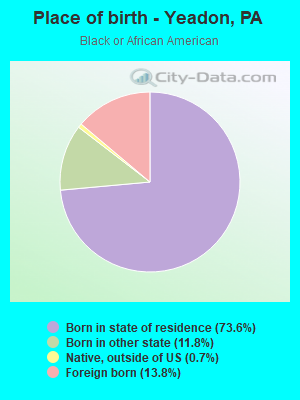
Place of birth - Born in state of residence (%) - Black or African American
Place of birth - Born in state of residence (%) - Asian
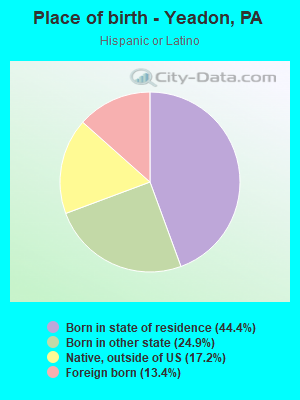
Place of birth - Born in state of residence (%) - Hispanic or Latino
Place of birth - Born in state of residence (%) - American Indian and Alaska Native
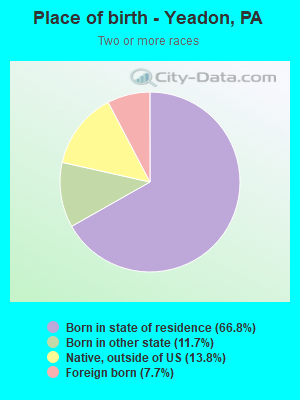
Place of birth - Born in state of residence (%) - Multirace
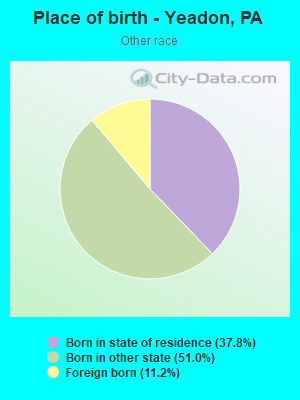
Place of birth - Born in state of residence (%) - Other Race
Place of birth - Born in other state (%)
Place of birth - Born in other state (%) - White
Place of birth - Born in other state (%) - Black or African American
Place of birth - Born in other state (%) - Asian
Place of birth - Born in other state (%) - Hispanic or Latino
Place of birth - Born in other state (%) - American Indian and Alaska Native
Place of birth - Born in other state (%) - Multirace
Place of birth - Born in other state (%) - Other Race
Place of birth - Native, outside of US (%)
Place of birth - Native, outside of US (%) - White
Place of birth - Native, outside of US (%) - Black or African American
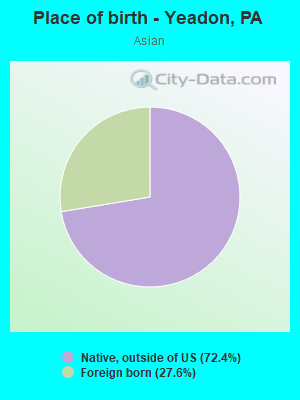
Place of birth - Native, outside of US (%) - Asian
Place of birth - Native, outside of US (%) - Hispanic or Latino
Place of birth - Native, outside of US (%) - American Indian and Alaska Native
Place of birth - Native, outside of US (%) - Multirace
Place of birth - Native, outside of US (%) - Other Race
Place of birth - Foreign born (%)
Place of birth - Foreign born (%) - White
Place of birth - Foreign born (%) - Black or African American
Place of birth - Foreign born (%) - Asian
Place of birth - Foreign born (%) - Hispanic or Latino
Place of birth - Foreign born (%) - American Indian and Alaska Native
Place of birth - Foreign born (%) - Multirace
Place of birth - Foreign born (%) - Other Race
Residents speaking English at home (%)
Residents speaking English at home - Born in the United States (%)
Residents speaking English at home - Native, born elsewhere (%)
Residents speaking English at home - Foreign born (%)
Residents speaking Spanish at home (%)
Residents speaking Spanish at home - Born in the United States (%)
Residents speaking Spanish at home - Native, born elsewhere (%)
Residents speaking Spanish at home - Foreign born (%)
Residents speaking other language at home (%)
Residents speaking other language at home - Born in the United States (%)
Residents speaking other language at home - Native, born elsewhere (%)
Residents speaking other language at home - Foreign born (%)
Marital status - Never married (%)
Marital status - Now married (%)
Marital status - Separated (%)
Marital status - Widowed (%)
Marital status - Divorced (%)
Ancestries Reported - Arab (%)
Ancestries Reported - Czech (%)
Ancestries Reported - Danish (%)
Ancestries Reported - Dutch (%)
Ancestries Reported - English (%)
Ancestries Reported - French (%)
Ancestries Reported - French Canadian (%)
Ancestries Reported - German (%)
Ancestries Reported - Greek (%)
Ancestries Reported - Hungarian (%)
Ancestries Reported - Irish (%)
Ancestries Reported - Italian (%)
Ancestries Reported - Lithuanian (%)
Ancestries Reported - Norwegian (%)
Ancestries Reported - Polish (%)
Ancestries Reported - Portuguese (%)
Ancestries Reported - Russian (%)
Ancestries Reported - Scotch-Irish (%)
Ancestries Reported - Scottish (%)
Ancestries Reported - Slovak (%)
Ancestries Reported - Subsaharan African (%)
Ancestries Reported - Swedish (%)
Ancestries Reported - Swiss (%)
Ancestries Reported - Ukrainian (%)
Ancestries Reported - United States (%)
Ancestries Reported - Welsh (%)
Ancestries Reported - West Indian (%)
Ancestries Reported - Other (%)
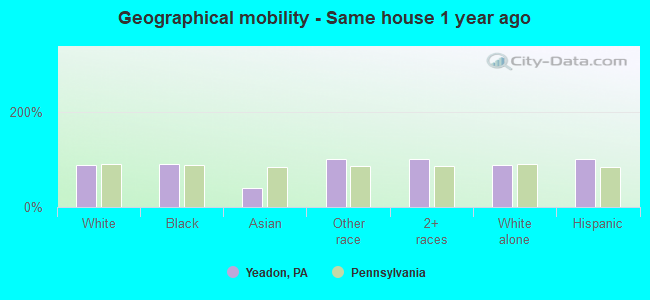
Geographical mobility - Same house 1 year ago (%)
Geographical mobility - Same house 1 year ago (%) - White
Geographical mobility - Same house 1 year ago (%) - Black or African American
Geographical mobility - Same house 1 year ago (%) - Asian
Geographical mobility - Same house 1 year ago (%) - Hispanic or Latino
Geographical mobility - Same house 1 year ago (%) - American Indian and Alaska Native
Geographical mobility - Same house 1 year ago (%) - Multirace
Geographical mobility - Same house 1 year ago (%) - Other Race
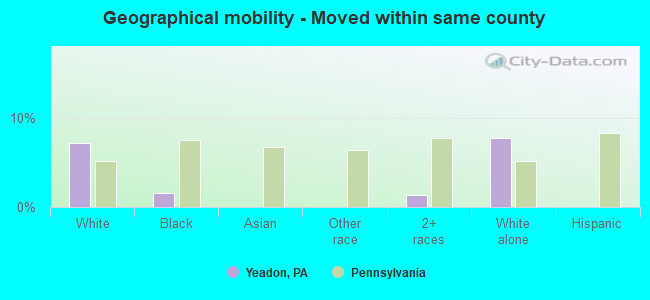
Geographical mobility - Moved within same county (%)
Geographical mobility - Moved within same county (%) - White
Geographical mobility - Moved within same county (%) - Black or African American
Geographical mobility - Moved within same county (%) - Asian
Geographical mobility - Moved within same county (%) - Hispanic or Latino
Geographical mobility - Moved within same county (%) - American Indian and Alaska Native
Geographical mobility - Moved within same county (%) - Multirace
Geographical mobility - Moved within same county (%) - Other Race
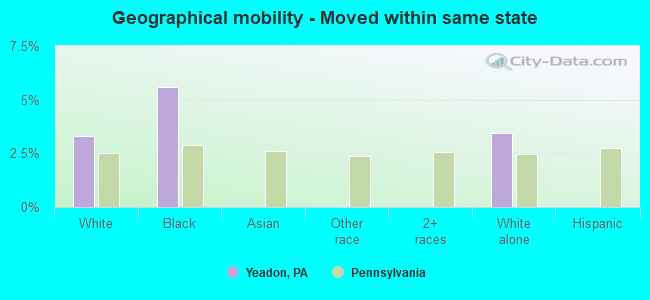
Geographical mobility - Moved from different county within same state (%)
Geographical mobility - Moved from different county within same state (%) - White
Geographical mobility - Moved from different county within same state (%) - Black or African American
Geographical mobility - Moved from different county within same state (%) - Asian
Geographical mobility - Moved from different county within same state (%) - Hispanic or Latino
Geographical mobility - Moved from different county within same state (%) - American Indian and Alaska Native
Geographical mobility - Moved from different county within same state (%) - Multirace
Geographical mobility - Moved from different county within same state (%) - Other Race
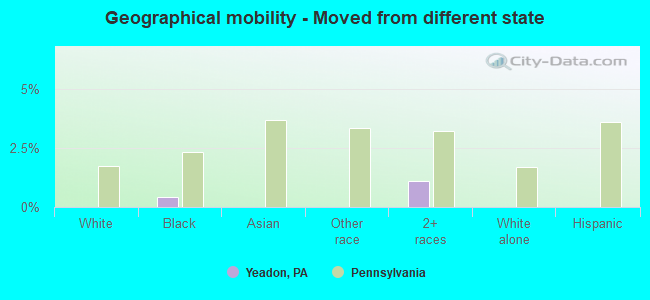
Geographical mobility - Moved from different state (%)
Geographical mobility - Moved from different state (%) - White
Geographical mobility - Moved from different state (%) - Black or African American
Geographical mobility - Moved from different state (%) - Asian
Geographical mobility - Moved from different state (%) - Hispanic or Latino
Geographical mobility - Moved from different state (%) - American Indian and Alaska Native
Geographical mobility - Moved from different state (%) - Multirace
Geographical mobility - Moved from different state (%) - Other Race
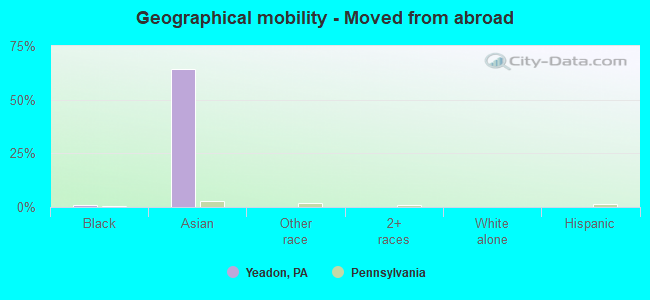
Geographical mobility - Moved from abroad (%)
Geographical mobility - Moved from abroad (%) - White
Geographical mobility - Moved from abroad (%) - Black or African American
Geographical mobility - Moved from abroad (%) - Asian
Geographical mobility - Moved from abroad (%) - Hispanic or Latino
Geographical mobility - Moved from abroad (%) - American Indian and Alaska Native
Geographical mobility - Moved from abroad (%) - Multirace
Geographical mobility - Moved from abroad (%) - Other Race
Place of birth for the foreign-born population - Ireland (%)
Place of birth for the foreign-born population - Denmark (%)
Place of birth for the foreign-born population - Norway (%)
Place of birth for the foreign-born population - Sweden (%)
Place of birth for the foreign-born population - United Kingdom (%)
Place of birth for the foreign-born population - England (%)
Place of birth for the foreign-born population - Scotland (%)
Place of birth for the foreign-born population - Other Northern Europe (%)
Place of birth for the foreign-born population - Austria (%)
Place of birth for the foreign-born population - Belgium (%)
Place of birth for the foreign-born population - France (%)
Place of birth for the foreign-born population - Germany (%)
Place of birth for the foreign-born population - Netherlands (%)
Place of birth for the foreign-born population - Switzerland (%)
Place of birth for the foreign-born population - Other Western Europe (%)
Place of birth for the foreign-born population - Greece (%)
Place of birth for the foreign-born population - Italy (%)
Place of birth for the foreign-born population - Portugal (%)
Place of birth for the foreign-born population - Spain (%)
Place of birth for the foreign-born population - Other Southern Europe (%)
Place of birth for the foreign-born population - Albania (%)
Place of birth for the foreign-born population - Belarus (%)
Place of birth for the foreign-born population - Bosnia and Herzegovina (%)
Place of birth for the foreign-born population - Bulgaria (%)
Place of birth for the foreign-born population - Croatia (%)
Place of birth for the foreign-born population - Czechoslovakia (%)
Place of birth for the foreign-born population - Hungary (%)
Place of birth for the foreign-born population - Latvia (%)
Place of birth for the foreign-born population - Lithuania (%)
Place of birth for the foreign-born population - North Macedonia (Macedonia) (%)
Place of birth for the foreign-born population - Moldova (%)
Place of birth for the foreign-born population - Poland (%)
Place of birth for the foreign-born population - Romania (%)
Place of birth for the foreign-born population - Russia (%)
Place of birth for the foreign-born population - Serbia (%)
Place of birth for the foreign-born population - Ukraine (%)
Place of birth for the foreign-born population - Other Eastern Europe (%)
Place of birth for the foreign-born population - China (%)
Place of birth for the foreign-born population - Hong Kong (%)
Place of birth for the foreign-born population - Taiwan (%)
Place of birth for the foreign-born population - Japan (%)
Place of birth for the foreign-born population - Korea (%)
Place of birth for the foreign-born population - Other Eastern Asia (%)
Place of birth for the foreign-born population - Afghanistan (%)
Place of birth for the foreign-born population - Bangladesh (%)
Place of birth for the foreign-born population - India (%)
Place of birth for the foreign-born population - Iran (%)
Place of birth for the foreign-born population - Kazakhstan (%)
Place of birth for the foreign-born population - Nepal (%)
Place of birth for the foreign-born population - Pakistan (%)
Place of birth for the foreign-born population - Sri Lanka (%)
Place of birth for the foreign-born population - Uzbekistan (%)
Place of birth for the foreign-born population - Other South Central Asia (%)
Place of birth for the foreign-born population - Burma (%)
Place of birth for the foreign-born population - Cambodia (%)
Place of birth for the foreign-born population - Indonesia (%)
Place of birth for the foreign-born population - Laos (%)
Place of birth for the foreign-born population - Malaysia (%)
Place of birth for the foreign-born population - Philippines (%)
Place of birth for the foreign-born population - Singapore (%)
Place of birth for the foreign-born population - Thailand (%)
Place of birth for the foreign-born population - Vietnam (%)
Place of birth for the foreign-born population - Other South Eastern Asia (%)
Place of birth for the foreign-born population - Armenia (%)
Place of birth for the foreign-born population - Iraq (%)
Place of birth for the foreign-born population - Israel (%)
Place of birth for the foreign-born population - Jordan (%)
Place of birth for the foreign-born population - Kuwait (%)
Place of birth for the foreign-born population - Lebanon (%)
Place of birth for the foreign-born population - Saudi Arabia (%)
Place of birth for the foreign-born population - Syria (%)
Place of birth for the foreign-born population - Turkey (%)
Place of birth for the foreign-born population - Yemen (%)
Place of birth for the foreign-born population - Other Western Asia (%)
Place of birth for the foreign-born population - Eritrea (%)
Place of birth for the foreign-born population - Ethiopia (%)
Place of birth for the foreign-born population - Kenya (%)
Place of birth for the foreign-born population - Somalia (%)
Place of birth for the foreign-born population - Uganda (%)
Place of birth for the foreign-born population - Zimbabwe (%)
Place of birth for the foreign-born population - Other Eastern Africa (%)
Place of birth for the foreign-born population - Cameroon (%)
Place of birth for the foreign-born population - Congo (%)
Place of birth for the foreign-born population - Democratic Republic of Congo (Zaire) (%)
Place of birth for the foreign-born population - Other Middle Africa (%)
Place of birth for the foreign-born population - Egypt (%)
Place of birth for the foreign-born population - Morocco (%)
Place of birth for the foreign-born population - Sudan (%)
Place of birth for the foreign-born population - Other Northern Africa (%)
Place of birth for the foreign-born population - South Africa (%)
Place of birth for the foreign-born population - Other Southern Africa (%)
Place of birth for the foreign-born population - Cabo Verde (%)
Place of birth for the foreign-born population - Ghana (%)
Place of birth for the foreign-born population - Liberia (%)
Place of birth for the foreign-born population - Nigeria (%)
Place of birth for the foreign-born population - Senegal (%)
Place of birth for the foreign-born population - Sierra Leone (%)
Place of birth for the foreign-born population - Other Western Africa (%)
Place of birth for the foreign-born population - Australia (%)
Place of birth for the foreign-born population - New Zealand (%)
Place of birth for the foreign-born population - Fiji (%)
Place of birth for the foreign-born population - Micronesia (%)
Place of birth for the foreign-born population - Bahamas (%)
Place of birth for the foreign-born population - Barbados (%)
Place of birth for the foreign-born population - Cuba (%)
Place of birth for the foreign-born population - Dominica (%)
Place of birth for the foreign-born population - Dominican Republic (%)
Place of birth for the foreign-born population - Grenada (%)
Place of birth for the foreign-born population - Haiti (%)
Place of birth for the foreign-born population - Jamaica (%)
Place of birth for the foreign-born population - St. Vincent and the Grenadines (%)
Place of birth for the foreign-born population - Trinidad and Tobago (%)
Place of birth for the foreign-born population - West Indies (%)
Place of birth for the foreign-born population - Other Caribbean (%)
Place of birth for the foreign-born population - Belize (%)
Place of birth for the foreign-born population - Costa Rica (%)
Place of birth for the foreign-born population - El Salvador (%)
Place of birth for the foreign-born population - Guatemala (%)
Place of birth for the foreign-born population - Honduras (%)
Place of birth for the foreign-born population - Mexico (%)
Place of birth for the foreign-born population - Nicaragua (%)
Place of birth for the foreign-born population - Panama (%)
Place of birth for the foreign-born population - Other Central America (%)
Place of birth for the foreign-born population - Argentina (%)
Place of birth for the foreign-born population - Bolivia (%)
Place of birth for the foreign-born population - Brazil (%)
Place of birth for the foreign-born population - Chile (%)
Place of birth for the foreign-born population - Colombia (%)
Place of birth for the foreign-born population - Ecuador (%)
Place of birth for the foreign-born population - Guyana (%)
Place of birth for the foreign-born population - Peru (%)
Place of birth for the foreign-born population - Uruguay (%)
Place of birth for the foreign-born population - Venezuela (%)
Place of birth for the foreign-born population - Other South America (%)
Place of birth for the foreign-born population - Canada (%)
Place of birth for the foreign-born population - Other Northern America (%)
Place of birth for the foreign-born population - Other (%)
Latest news about races in Yeadon, PA collected exclusively by city-data.com from local newspapers, TV, and radio stations
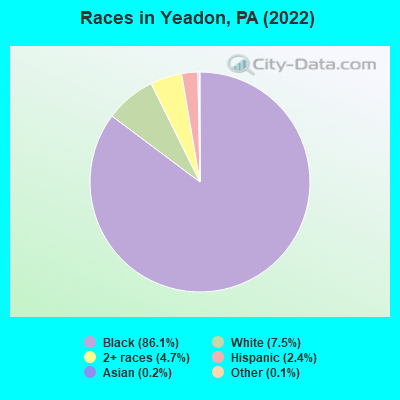
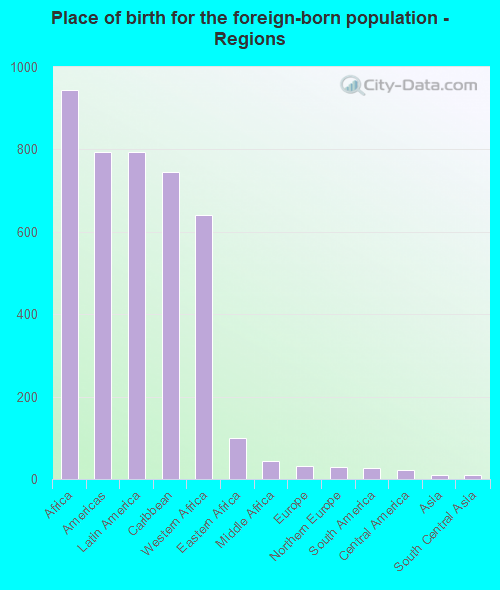
According to 2022 data, the most numerous races in Yeadon, PA are White alone (904 residents), Black alone (10,339 residents), and Hispanic (285 residents). 88.7% of Yeadon residents speak English at home. 14.8% of Yeadon, PA residents are foreign-born (7.6% born in Africa, 6.4% born in Latin America), which is 52.7% greater than the foreign-born rate of 7.0% across the entire state of Pennsylvania.
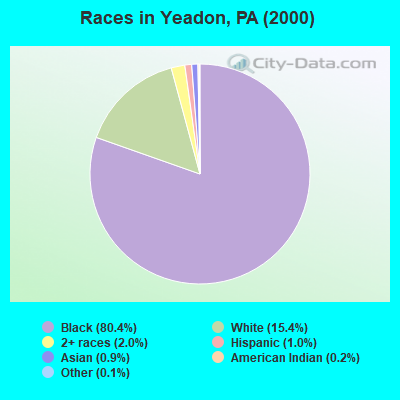
Race distribution in Yeadon
2000 2022
10,322,455 84.1% White alone 1,202,437 9.8% Black alone 394,088 3.2% Hispanic 218,296 1.8% Asian alone 113,097 0.9% Two or more races 13,086 0.1% Other race alone 14,904 0.1% American Indian alone 2,691 0.02% Native Hawaiian and Other
9,487,228 73.1% White alone 1,311,581 10.1% Black alone 1,115,997 8.6% Hispanic 493,942 3.8% Two or more races 487,124 3.8% Asian alone 63,582 0.5% Other race alone 10,130 0.08% American Indian alone 2,424 0.02% Native Hawaiian and Other
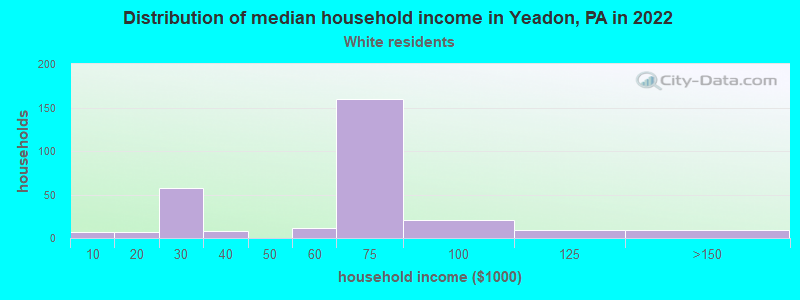
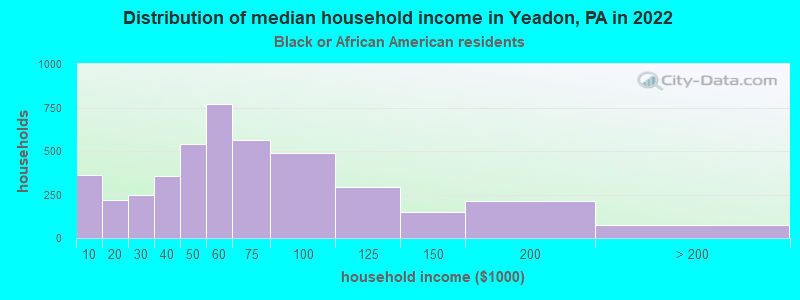
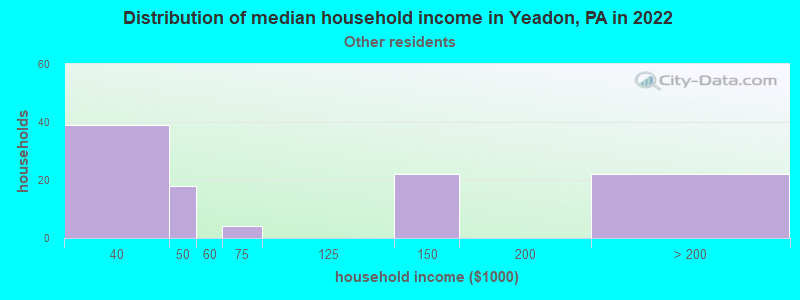
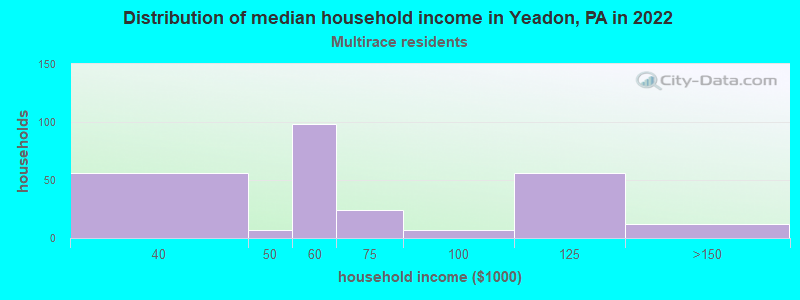
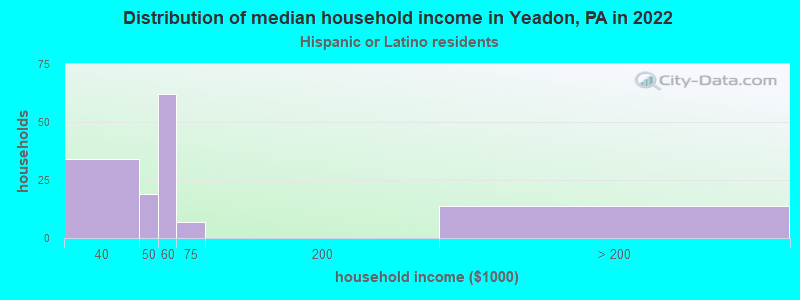
Income and house value in Yeadon Median household income in 2022 $63,756 White non-Hispanic householders$54,321 Black householders$60,630 Two or more races householders$42,895 Hispanic or Latino race householdersMedian 2022 house value $162,547 White Non-Hispanic householders$173,639 Black or African American householders $159,320 Asian householders$131,086 Some other race householders$157,908 Two or more races householders$191,587 Hispanic or Latino householders
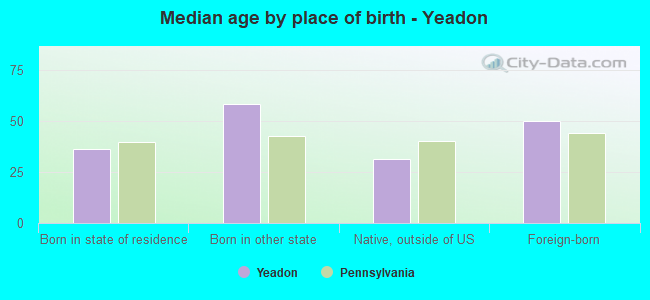
Median age by race in Yeadon
63.9 Median age for White residents64.1 58.9 42.3 Median age for Black or African American residents37.5 45.9 -1,210,144,926.3 Median age for American Indian / Alaska Native residents-1,478,964,399.8 -897,163,119.7 -693,620,843.9 Median age for Asian residents-691,689,007.4 -693,766,937.0 -680,432,644.4 Median age for Native Hawaiian / Pacific Islander residents-666,666,666.0 -747,474,746.7 46.0 Median age for Other race residents34.5 64.5 28.0 Median age for Two or more races residents10.0 36.6 64.0 Median age for White alone residents65.5 58.6 27.1 Median age for Hispanic or Latino residents30.5 26.7
Owner/renter occupied households by race in Yeadon
House owners and renters - White residents 194 68.8% Owner occupied88 31.2% Renter occupiedHouse owners and renters - Black or African American residents 2,377 53.5% Owner occupied2,066 46.5% Renter occupiedHouse owners and renters - Other race residents 64 63.2% Owner occupied37 36.8% Renter occupiedHouse owners and renters - Two or more races residents 92 29.6% Owner occupied219 70.4% Renter occupiedHouse owners and renters - White alone residents 189 67.7% Owner occupied90 32.3% Renter occupiedHouse owners and renters - Hispanic or Latino residents 45 35.2% Owner occupied83 64.8% Renter occupied
Language usage in Yeadon
English speakers - Total 88.7% of residents of Yeadon speak English at home.
1.4% of residents speak Spanish at home 35 21.6% Speak English very well127 78.4% Speak English less than very well10.0% of residents speak other language at home 712 62.7% Speak English very well424 37.3% Speak English less than very well
English speakers - Born in the United States 94.9% of residents of Yeadon speak English at home.
0.2% of residents speak Spanish at home 3 100.0% Speak English very well3.7% of residents speak other language at home 57 100.0% Speak English very well
English speakers - Native, born elsewhere 25.7% of residents of Yeadon speak English at home.
38.6% of residents speak Spanish at home 96 100.0% Speak English less than very well51.0% of residents speak other language at home 46 36.2% Speak English very well81 63.8% Speak English less than very well
English speakers - Foreign-born 58.7% of residents of Yeadon speak English at home.
2.2% of residents speak Spanish at home 21 61.8% Speak English very well13 38.2% Speak English less than very well42.6% of residents speak other language at home 303 45.2% Speak English very well367 54.8% Speak English less than very well
White (Caucasian) - Speak only English Native:
99.2% (906)Foreign-born:
4.5% (1)
White (Caucasian) - Speak another language Native:
1.2% (11)Foreign-born:
86.7% (20)
Black or African American - Speak only English Native:
94.5% (7,899)Foreign-born:
55.1% (782)
Black or African American - Speak another language Native:
5.5% (457)Foreign-born:
45.0% (639)
Asian - Speak another language Native:
100.0% (19)Foreign-born:
94.7% (8)
Other race - Speak only English Native:
69.6% (105)Foreign-born:
23.6% (4)
Other race - Speak another language Native:
15.0% (23)Foreign-born:
90.3% (16)
Two or more races - Speak only English Native:
88.5% (490)Foreign-born:
75.4% (37)
Two or more races - Speak another language Native:
11.0% (61)Foreign-born:
3.4% (2)
White alone - Speak only English Native:
99.5% (901)Foreign-born:
100.0% (1)
Hispanic or Latino - Speak another language Native:
32.3% (81)Foreign-born:
100.0% (33)
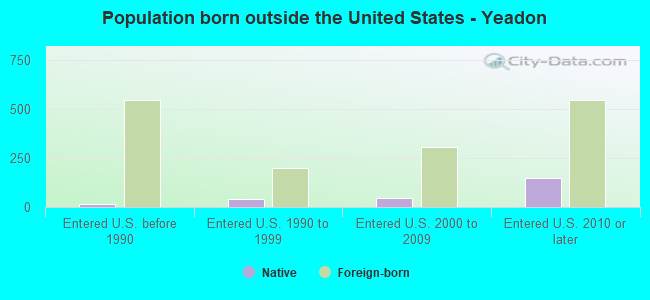
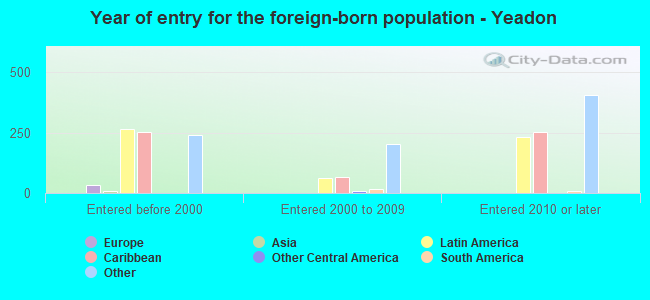
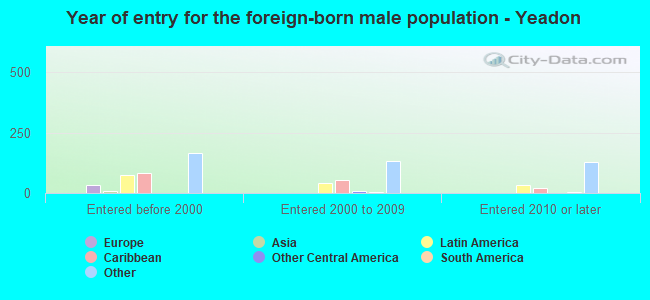
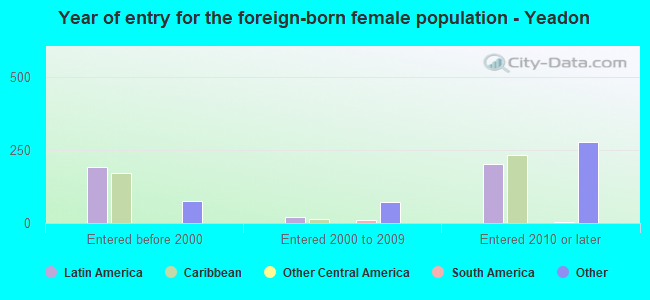
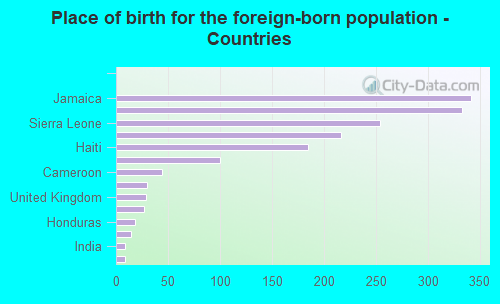
Foreign-born residents in Yeadon 1,779 residents are foreign born (7.6% Africa , 6.4% Latin America ).
This city:
14.8%Pennsylvania:
7.3%
Marital status for residents in Yeadon Marital status - White (Caucasian) population 15 years and over
Males 32.1% Never married28.7% Now married5.4% Separated29.0% Widowed4.9% DivorcedFemales 35.5% Never married11.4% Now married1.2% Separated21.6% Widowed30.2% DivorcedWomen who did not give birth in the past 12 months Now married:
9.3% (16)Unmarried:
90.7% (158)
Marital status - Black or African American population 15 years and over
Males 42.8% Never married37.4% Now married2.5% Separated5.9% Widowed11.3% DivorcedFemales 46.8% Never married29.1% Now married1.9% Separated7.5% Widowed14.7% DivorcedWomen who gave birth in the past 12 months Now married:
0.0% (0)Unmarried:
100.0% (33)
Women who did not give birth in the past 12 months Now married:
22.4% (533)Unmarried:
77.6% (1,849)
Marital status - Other race population 15 years and over
Males 83.5% Never married16.5% Now married0.0% Separated0.0% Widowed0.0% DivorcedFemales 45.2% Never married47.6% Now married0.0% Separated7.1% Widowed0.0% DivorcedMarital status - Two or more races population 15 years and over
Males 88.0% Never married12.0% Now married0.0% Separated0.0% Widowed0.0% DivorcedFemales 41.9% Never married17.7% Now married22.3% Separated6.2% Widowed11.9% DivorcedWomen who gave birth in the past 12 months Now married:
77.4% (29)Unmarried:
22.6% (8)
Women who did not give birth in the past 12 months Now married:
33.9% (78)Unmarried:
66.1% (152)
Marital status - White alone, not Hispanic / Latino population 15 years and over
Males 32.0% Never married27.8% Now married5.5% Separated29.7% Widowed5.0% DivorcedFemales 35.7% Never married10.2% Now married1.3% Separated21.5% Widowed31.3% DivorcedWomen who did not give birth in the past 12 months Now married:
4.8% (8)Unmarried:
95.2% (154)
Marital status - Hispanic or Latino population 15 years and over
Males 74.5% Never married25.5% Now married0.0% Separated0.0% Widowed0.0% DivorcedFemales 6.5% Never married31.5% Now married56.5% Separated5.4% Widowed0.0% DivorcedWomen who did not give birth in the past 12 months Now married:
91.0% (66)Unmarried:
9.0% (7)
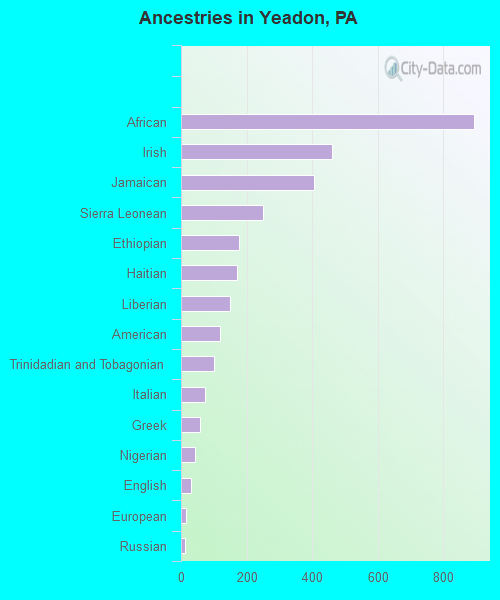
Ancestries in Yeadon
895 10.3% African460 5.3% Irish407 4.7% Jamaican251 2.9% Sierra Leonean176 2.0% Ethiopian171 2.0% Haitian148 1.7% Liberian118 1.4% American101 1.2% Trinidadian and Tobagonian74 0.9% Italian59 0.7% Greek42 0.5% Nigerian30 0.3% English14 0.2% European11 0.1% Russian7 0.08% Ghanaian6 0.07% Portuguese5 0.06% Northern European1 0.01% Belizean
Children Nativity (place of birth) in Yeadon
Children under 6 years - Living with two parents Both parents native 101 100.0% NativeBoth parents foreign-born 161 100.0% NativeOne native, one foreign-born parent 6 100.0% NativeChildren under 6 years - Living with one parent Native parent 371 100.0% NativeForeign-born parent 157 100.0% NativeChildren 6 to 17 years - Living with two parents Both parents native 259 100.0% NativeBoth parents foreign-born 143 86.8% Native22 13.2% Foreign-bornOne native, one foreign-born parent 6 100.0% NativeChildren 6 to 17 years - Living with one parent Native parent 433 99.0% Native4 1.0% Foreign-bornForeign-born parent 59 65.2% Native31 34.8% Foreign-born
Grandparents responsible for own grandchildren in Yeadon
Grandparents (30 to 59 years) Black or African American 31 100.0% Responsible for grandchildrenTwo or more races 13 100.0% Not responsible for grandchildrenGrandparents (60 years and over) Black or African American 53 51.8% Responsible for grandchildren50 48.2% Not responsible for grandchildrenTwo or more races 9 100.0% Not responsible for grandchildren