Races in Youngstown, Ohio (OH) Detailed Stats
Data:
Races - White alone (%)
Races - White alone (% change since 2000)
Races - Black alone (%)
Races - Black alone (% change since 2000)
Races - American Indian alone (%)
Races - American Indian alone (% change since 2000)
Races - Asian alone (%)
Races - Asian alone (% change since 2000)
Races - Hispanic (%)
Races - Hispanic (% change since 2000)
Races - Native Hawaiian and Other Pacific Islander alone (%)
Races - Native Hawaiian and Other Pacific Islander alone (% change since 2000)
Races - Two or more races(%)
Races - Two or more races(% change since 2000)
Races - Other race alone (%)
Races - Other race alone (% change since 2000)
Racial diversity
Place of birth - Born in state of residence (%)
Place of birth - Born in state of residence (%) - White
Place of birth - Born in state of residence (%) - Black or African American
Place of birth - Born in state of residence (%) - Asian
Place of birth - Born in state of residence (%) - Hispanic or Latino
Place of birth - Born in state of residence (%) - American Indian and Alaska Native
Place of birth - Born in state of residence (%) - Multirace
Place of birth - Born in state of residence (%) - Other Race
Place of birth - Born in other state (%)
Place of birth - Born in other state (%) - White
Place of birth - Born in other state (%) - Black or African American
Place of birth - Born in other state (%) - Asian
Place of birth - Born in other state (%) - Hispanic or Latino
Place of birth - Born in other state (%) - American Indian and Alaska Native
Place of birth - Born in other state (%) - Multirace
Place of birth - Born in other state (%) - Other Race
Place of birth - Native, outside of US (%)
Place of birth - Native, outside of US (%) - White
Place of birth - Native, outside of US (%) - Black or African American
Place of birth - Native, outside of US (%) - Asian
Place of birth - Native, outside of US (%) - Hispanic or Latino
Place of birth - Native, outside of US (%) - American Indian and Alaska Native
Place of birth - Native, outside of US (%) - Multirace
Place of birth - Native, outside of US (%) - Other Race
Place of birth - Foreign born (%)
Place of birth - Foreign born (%) - White
Place of birth - Foreign born (%) - Black or African American
Place of birth - Foreign born (%) - Asian
Place of birth - Foreign born (%) - Hispanic or Latino
Place of birth - Foreign born (%) - American Indian and Alaska Native
Place of birth - Foreign born (%) - Multirace
Place of birth - Foreign born (%) - Other Race
Residents speaking English at home (%)
Residents speaking English at home - Born in the United States (%)
Residents speaking English at home - Native, born elsewhere (%)
Residents speaking English at home - Foreign born (%)
Residents speaking Spanish at home (%)
Residents speaking Spanish at home - Born in the United States (%)
Residents speaking Spanish at home - Native, born elsewhere (%)
Residents speaking Spanish at home - Foreign born (%)
Residents speaking other language at home (%)
Residents speaking other language at home - Born in the United States (%)
Residents speaking other language at home - Native, born elsewhere (%)
Residents speaking other language at home - Foreign born (%)
Marital status - Never married (%)
Marital status - Now married (%)
Marital status - Separated (%)
Marital status - Widowed (%)
Marital status - Divorced (%)
Ancestries Reported - Arab (%)
Ancestries Reported - Czech (%)
Ancestries Reported - Danish (%)
Ancestries Reported - Dutch (%)
Ancestries Reported - English (%)
Ancestries Reported - French (%)
Ancestries Reported - French Canadian (%)
Ancestries Reported - German (%)
Ancestries Reported - Greek (%)
Ancestries Reported - Hungarian (%)
Ancestries Reported - Irish (%)
Ancestries Reported - Italian (%)
Ancestries Reported - Lithuanian (%)
Ancestries Reported - Norwegian (%)
Ancestries Reported - Polish (%)
Ancestries Reported - Portuguese (%)
Ancestries Reported - Russian (%)
Ancestries Reported - Scotch-Irish (%)
Ancestries Reported - Scottish (%)
Ancestries Reported - Slovak (%)
Ancestries Reported - Subsaharan African (%)
Ancestries Reported - Swedish (%)
Ancestries Reported - Swiss (%)
Ancestries Reported - Ukrainian (%)
Ancestries Reported - United States (%)
Ancestries Reported - Welsh (%)
Ancestries Reported - West Indian (%)
Ancestries Reported - Other (%)
Geographical mobility - Same house 1 year ago (%)
Geographical mobility - Same house 1 year ago (%) - White
Geographical mobility - Same house 1 year ago (%) - Black or African American
Geographical mobility - Same house 1 year ago (%) - Asian
Geographical mobility - Same house 1 year ago (%) - Hispanic or Latino
Geographical mobility - Same house 1 year ago (%) - American Indian and Alaska Native
Geographical mobility - Same house 1 year ago (%) - Multirace
Geographical mobility - Same house 1 year ago (%) - Other Race
Geographical mobility - Moved within same county (%)
Geographical mobility - Moved within same county (%) - White
Geographical mobility - Moved within same county (%) - Black or African American
Geographical mobility - Moved within same county (%) - Asian
Geographical mobility - Moved within same county (%) - Hispanic or Latino
Geographical mobility - Moved within same county (%) - American Indian and Alaska Native
Geographical mobility - Moved within same county (%) - Multirace
Geographical mobility - Moved within same county (%) - Other Race
Geographical mobility - Moved from different county within same state (%)
Geographical mobility - Moved from different county within same state (%) - White
Geographical mobility - Moved from different county within same state (%) - Black or African American
Geographical mobility - Moved from different county within same state (%) - Asian
Geographical mobility - Moved from different county within same state (%) - Hispanic or Latino
Geographical mobility - Moved from different county within same state (%) - American Indian and Alaska Native
Geographical mobility - Moved from different county within same state (%) - Multirace
Geographical mobility - Moved from different county within same state (%) - Other Race
Geographical mobility - Moved from different state (%)
Geographical mobility - Moved from different state (%) - White
Geographical mobility - Moved from different state (%) - Black or African American
Geographical mobility - Moved from different state (%) - Asian
Geographical mobility - Moved from different state (%) - Hispanic or Latino
Geographical mobility - Moved from different state (%) - American Indian and Alaska Native
Geographical mobility - Moved from different state (%) - Multirace
Geographical mobility - Moved from different state (%) - Other Race
Geographical mobility - Moved from abroad (%)
Geographical mobility - Moved from abroad (%) - White
Geographical mobility - Moved from abroad (%) - Black or African American
Geographical mobility - Moved from abroad (%) - Asian
Geographical mobility - Moved from abroad (%) - Hispanic or Latino
Geographical mobility - Moved from abroad (%) - American Indian and Alaska Native
Geographical mobility - Moved from abroad (%) - Multirace
Geographical mobility - Moved from abroad (%) - Other Race
Place of birth for the foreign-born population - Ireland (%)
Place of birth for the foreign-born population - Denmark (%)
Place of birth for the foreign-born population - Norway (%)
Place of birth for the foreign-born population - Sweden (%)
Place of birth for the foreign-born population - United Kingdom (%)
Place of birth for the foreign-born population - England (%)
Place of birth for the foreign-born population - Scotland (%)
Place of birth for the foreign-born population - Other Northern Europe (%)
Place of birth for the foreign-born population - Austria (%)
Place of birth for the foreign-born population - Belgium (%)
Place of birth for the foreign-born population - France (%)
Place of birth for the foreign-born population - Germany (%)
Place of birth for the foreign-born population - Netherlands (%)
Place of birth for the foreign-born population - Switzerland (%)
Place of birth for the foreign-born population - Other Western Europe (%)
Place of birth for the foreign-born population - Greece (%)
Place of birth for the foreign-born population - Italy (%)
Place of birth for the foreign-born population - Portugal (%)
Place of birth for the foreign-born population - Spain (%)
Place of birth for the foreign-born population - Other Southern Europe (%)
Place of birth for the foreign-born population - Albania (%)
Place of birth for the foreign-born population - Belarus (%)
Place of birth for the foreign-born population - Bosnia and Herzegovina (%)
Place of birth for the foreign-born population - Bulgaria (%)
Place of birth for the foreign-born population - Croatia (%)
Place of birth for the foreign-born population - Czechoslovakia (%)
Place of birth for the foreign-born population - Hungary (%)
Place of birth for the foreign-born population - Latvia (%)
Place of birth for the foreign-born population - Lithuania (%)
Place of birth for the foreign-born population - North Macedonia (Macedonia) (%)
Place of birth for the foreign-born population - Moldova (%)
Place of birth for the foreign-born population - Poland (%)
Place of birth for the foreign-born population - Romania (%)
Place of birth for the foreign-born population - Russia (%)
Place of birth for the foreign-born population - Serbia (%)
Place of birth for the foreign-born population - Ukraine (%)
Place of birth for the foreign-born population - Other Eastern Europe (%)
Place of birth for the foreign-born population - China (%)
Place of birth for the foreign-born population - Hong Kong (%)
Place of birth for the foreign-born population - Taiwan (%)
Place of birth for the foreign-born population - Japan (%)
Place of birth for the foreign-born population - Korea (%)
Place of birth for the foreign-born population - Other Eastern Asia (%)
Place of birth for the foreign-born population - Afghanistan (%)
Place of birth for the foreign-born population - Bangladesh (%)
Place of birth for the foreign-born population - India (%)
Place of birth for the foreign-born population - Iran (%)
Place of birth for the foreign-born population - Kazakhstan (%)
Place of birth for the foreign-born population - Nepal (%)
Place of birth for the foreign-born population - Pakistan (%)
Place of birth for the foreign-born population - Sri Lanka (%)
Place of birth for the foreign-born population - Uzbekistan (%)
Place of birth for the foreign-born population - Other South Central Asia (%)
Place of birth for the foreign-born population - Burma (%)
Place of birth for the foreign-born population - Cambodia (%)
Place of birth for the foreign-born population - Indonesia (%)
Place of birth for the foreign-born population - Laos (%)
Place of birth for the foreign-born population - Malaysia (%)
Place of birth for the foreign-born population - Philippines (%)
Place of birth for the foreign-born population - Singapore (%)
Place of birth for the foreign-born population - Thailand (%)
Place of birth for the foreign-born population - Vietnam (%)
Place of birth for the foreign-born population - Other South Eastern Asia (%)
Place of birth for the foreign-born population - Armenia (%)
Place of birth for the foreign-born population - Iraq (%)
Place of birth for the foreign-born population - Israel (%)
Place of birth for the foreign-born population - Jordan (%)
Place of birth for the foreign-born population - Kuwait (%)
Place of birth for the foreign-born population - Lebanon (%)
Place of birth for the foreign-born population - Saudi Arabia (%)
Place of birth for the foreign-born population - Syria (%)
Place of birth for the foreign-born population - Turkey (%)
Place of birth for the foreign-born population - Yemen (%)
Place of birth for the foreign-born population - Other Western Asia (%)
Place of birth for the foreign-born population - Eritrea (%)
Place of birth for the foreign-born population - Ethiopia (%)
Place of birth for the foreign-born population - Kenya (%)
Place of birth for the foreign-born population - Somalia (%)
Place of birth for the foreign-born population - Uganda (%)
Place of birth for the foreign-born population - Zimbabwe (%)
Place of birth for the foreign-born population - Other Eastern Africa (%)
Place of birth for the foreign-born population - Cameroon (%)
Place of birth for the foreign-born population - Congo (%)
Place of birth for the foreign-born population - Democratic Republic of Congo (Zaire) (%)
Place of birth for the foreign-born population - Other Middle Africa (%)
Place of birth for the foreign-born population - Egypt (%)
Place of birth for the foreign-born population - Morocco (%)
Place of birth for the foreign-born population - Sudan (%)
Place of birth for the foreign-born population - Other Northern Africa (%)
Place of birth for the foreign-born population - South Africa (%)
Place of birth for the foreign-born population - Other Southern Africa (%)
Place of birth for the foreign-born population - Cabo Verde (%)
Place of birth for the foreign-born population - Ghana (%)
Place of birth for the foreign-born population - Liberia (%)
Place of birth for the foreign-born population - Nigeria (%)
Place of birth for the foreign-born population - Senegal (%)
Place of birth for the foreign-born population - Sierra Leone (%)
Place of birth for the foreign-born population - Other Western Africa (%)
Place of birth for the foreign-born population - Australia (%)
Place of birth for the foreign-born population - New Zealand (%)
Place of birth for the foreign-born population - Fiji (%)
Place of birth for the foreign-born population - Micronesia (%)
Place of birth for the foreign-born population - Bahamas (%)
Place of birth for the foreign-born population - Barbados (%)
Place of birth for the foreign-born population - Cuba (%)
Place of birth for the foreign-born population - Dominica (%)
Place of birth for the foreign-born population - Dominican Republic (%)
Place of birth for the foreign-born population - Grenada (%)
Place of birth for the foreign-born population - Haiti (%)
Place of birth for the foreign-born population - Jamaica (%)
Place of birth for the foreign-born population - St. Vincent and the Grenadines (%)
Place of birth for the foreign-born population - Trinidad and Tobago (%)
Place of birth for the foreign-born population - West Indies (%)
Place of birth for the foreign-born population - Other Caribbean (%)
Place of birth for the foreign-born population - Belize (%)
Place of birth for the foreign-born population - Costa Rica (%)
Place of birth for the foreign-born population - El Salvador (%)
Place of birth for the foreign-born population - Guatemala (%)
Place of birth for the foreign-born population - Honduras (%)
Place of birth for the foreign-born population - Mexico (%)
Place of birth for the foreign-born population - Nicaragua (%)
Place of birth for the foreign-born population - Panama (%)
Place of birth for the foreign-born population - Other Central America (%)
Place of birth for the foreign-born population - Argentina (%)
Place of birth for the foreign-born population - Bolivia (%)
Place of birth for the foreign-born population - Brazil (%)
Place of birth for the foreign-born population - Chile (%)
Place of birth for the foreign-born population - Colombia (%)
Place of birth for the foreign-born population - Ecuador (%)
Place of birth for the foreign-born population - Guyana (%)
Place of birth for the foreign-born population - Peru (%)
Place of birth for the foreign-born population - Uruguay (%)
Place of birth for the foreign-born population - Venezuela (%)
Place of birth for the foreign-born population - Other South America (%)
Place of birth for the foreign-born population - Canada (%)
Place of birth for the foreign-born population - Other Northern America (%)
Place of birth for the foreign-born population - Other (%)
Latest news about races in Youngstown, OH collected exclusively by city-data.com from local newspapers, TV, and radio stations
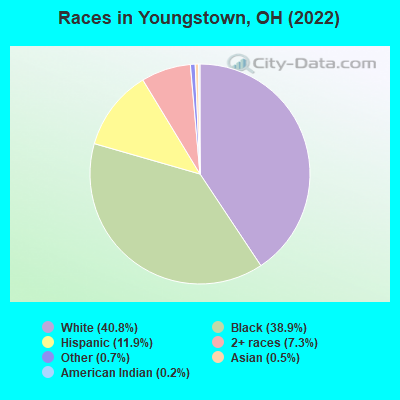
According to 2022 data, the most numerous races in Youngstown, OH are White alone (24,254 residents), Black alone (23,142 residents), and Two or more races (4,314 residents). 90.7% of Youngstown residents speak English at home. 2.9% of Youngstown, OH residents are foreign-born (1.4% born in Latin America, 0.7% born in Asia, 0.4% born in Europe), which is 40.3% less than the foreign-born rate of 4.0% across the entire state of Ohio.
Race distribution in Youngstown
2000 2022
9,538,111 84.0% White alone 1,290,662 11.4% Black alone 217,123 1.9% Hispanic 137,770 1.2% Two or more races 131,670 1.2% Asian alone 21,985 0.2% American Indian alone 13,483 0.1% Other race alone 2,336 0.02% Native Hawaiian and Other
8,948,793 76.1% White alone 1,401,403 11.9% Black alone 529,291 4.5% Two or more races 517,232 4.4% Hispanic 293,387 2.5% Asian alone 52,805 0.4% Other race alone 9,785 0.08% American Indian alone 3,362 0.03% Native Hawaiian and Other
Income and house value in Youngstown Median household income in 2022 $41,297 White non-Hispanic householders$27,696 Black householders$24,384 American Indian and Alaska Native householders$23,601 Two or more races householders$25,374 Hispanic or Latino race householdersMedian 2022 house value $69,257 White Non-Hispanic householders$44,796 Black or African American householders$72,646 American Indian or Alaska Native householders $127,758 Asian householders$41,407 Some other race householders$57,616 Two or more races householders$44,649 Hispanic or Latino householders
Median age by race in Youngstown
47.2 Median age for White residents47.4 47.2 36.4 Median age for Black or African American residents33.9 43.2 43.7 Median age for American Indian / Alaska Native residents45.6 37.9 35.5 Median age for Asian residents53.5 32.8 -800,387,596.1 Median age for Native Hawaiian / Pacific Islander residents-666,666,666.0 -805,394,989.6 38.8 Median age for Other race residents37.4 24.1 21.1 Median age for Two or more races residents22.4 20.8 48.3 Median age for White alone residents48.2 48.7 27.4 Median age for Hispanic or Latino residents29.9 23.5
Owner/renter occupied households by race in Youngstown
House owners and renters - White residents 8,467 69.3% Owner occupied3,749 30.7% Renter occupiedHouse owners and renters - Black or African American residents 5,246 49.0% Owner occupied5,465 51.0% Renter occupiedHouse owners and renters - American Indian / Alaska Native residents 59 27.1% Owner occupied158 72.9% Renter occupiedHouse owners and renters - Asian residents 41 30.3% Owner occupied94 69.7% Renter occupiedHouse owners and renters - Native Hawaiian / Pacific Islander residents 4 100.0% Owner occupiedHouse owners and renters - Other race residents 376 63.1% Owner occupied220 36.9% Renter occupiedHouse owners and renters - Two or more races residents 622 28.2% Owner occupied1,587 71.8% Renter occupiedHouse owners and renters - White alone residents 8,062 69.1% Owner occupied3,608 30.9% Renter occupiedHouse owners and renters - Hispanic or Latino residents 1,189 54.0% Owner occupied1,012 46.0% Renter occupied
Language usage in Youngstown
English speakers - Total 90.7% of residents of Youngstown speak English at home.
7.3% of residents speak Spanish at home 2,628 64.4% Speak English very well1,455 35.6% Speak English less than very well2.2% of residents speak other language at home 881 72.4% Speak English very well336 27.6% Speak English less than very well
English speakers - Born in the United States 91.5% of residents of Youngstown speak English at home.
6.1% of residents speak Spanish at home 607 81.9% Speak English very well134 18.1% Speak English less than very well2.9% of residents speak other language at home 292 83.4% Speak English very well58 16.6% Speak English less than very well
English speakers - Native, born elsewhere 18.3% of residents of Youngstown speak English at home.
74.5% of residents speak Spanish at home 1,193 71.1% Speak English very well486 28.9% Speak English less than very well6.8% of residents speak other language at home 153 100.0% Speak English very well
English speakers - Foreign-born 33.6% of residents of Youngstown speak English at home.
50.2% of residents speak Spanish at home 133 14.1% Speak English very well813 85.9% Speak English less than very well26.3% of residents speak other language at home 382 77.2% Speak English very well113 22.8% Speak English less than very well
White (Caucasian) - Speak only English Native:
95.5% (23,300)Foreign-born:
45.0% (193)
White (Caucasian) - Speak another language Native:
4.0% (980)Foreign-born:
38.3% (164)
Black or African American - Speak only English Native:
97.1% (21,648)Foreign-born:
61.9% (245)
Black or African American - Speak another language Native:
2.9% (645)Foreign-born:
41.5% (164)
American Indian / Alaska Native - Speak another language Native:
73.2% (230)Foreign-born:
96.6% (76)
Asian - Speak only English Native:
86.1% (61)Foreign-born:
10.5% (29)
Asian - Speak another language Native:
15.8% (11)Foreign-born:
89.9% (246)
Other race - Speak only English Native:
26.9% (554)Foreign-born:
32.3% (128)
Other race - Speak another language Native:
75.4% (1,555)Foreign-born:
60.6% (240)
Two or more races - Speak only English Native:
75.0% (4,548)Foreign-born:
1.3% (4)
Two or more races - Speak another language Native:
25.7% (1,560)Foreign-born:
100.0% (275)
White alone - Speak only English Native:
98.1% (22,656)Foreign-born:
50.7% (212)
White alone - Speak another language Native:
1.9% (442)Foreign-born:
37.6% (157)
Hispanic or Latino - Speak only English Native:
41.1% (2,223)Foreign-born:
7.0% (63)
Hispanic or Latino - Speak another language Native:
53.2% (2,876)Foreign-born:
99.4% (895)
Foreign-born residents in Youngstown 1,694 residents are foreign born (1.4% Latin America , 0.7% Asia , 0.4% Europe ).
Marital status for residents in Youngstown Marital status - White (Caucasian) population 15 years and over
Males 44.5% Never married30.4% Now married2.2% Separated4.6% Widowed18.4% DivorcedFemales 39.1% Never married30.7% Now married1.8% Separated13.5% Widowed14.8% DivorcedWomen who gave birth in the past 12 months Now married:
46.0% (78)Unmarried:
54.0% (91)
Women who did not give birth in the past 12 months Now married:
25.0% (1,358)Unmarried:
75.0% (4,072)
Marital status - Black or African American population 15 years and over
Males 59.2% Never married22.4% Now married2.8% Separated3.7% Widowed11.9% DivorcedFemales 54.4% Never married18.4% Now married2.0% Separated10.9% Widowed14.2% DivorcedWomen who gave birth in the past 12 months Now married:
22.1% (42)Unmarried:
77.9% (147)
Women who did not give birth in the past 12 months Now married:
17.8% (926)Unmarried:
82.2% (4,289)
Marital status - American Indian / Alaska Native population 15 years and over
Males 39.7% Never married39.1% Now married0.0% Separated0.0% Widowed21.2% DivorcedFemales 11.8% Never married67.7% Now married20.4% Separated0.0% Widowed0.0% DivorcedWomen who did not give birth in the past 12 months Now married:
80.7% (56)Unmarried:
19.3% (13)
Marital status - Asian population 15 years and over
Males 65.5% Never married18.6% Now married9.0% Separated4.1% Widowed2.8% DivorcedFemales 50.0% Never married44.6% Now married0.0% Separated3.2% Widowed2.2% DivorcedWomen who did not give birth in the past 12 months Now married:
44.0% (70)Unmarried:
56.0% (89)
Marital status - Other race population 15 years and over
Males 47.9% Never married47.7% Now married1.4% Separated0.7% Widowed2.3% DivorcedFemales 43.2% Never married36.9% Now married0.9% Separated14.1% Widowed5.0% DivorcedWomen who gave birth in the past 12 months Now married:
0.0% (0)Unmarried:
100.0% (67)
Women who did not give birth in the past 12 months Now married:
36.1% (225)Unmarried:
63.9% (398)
Marital status - Two or more races population 15 years and over
Males 65.5% Never married20.4% Now married3.3% Separated4.6% Widowed6.2% DivorcedFemales 69.5% Never married15.8% Now married1.4% Separated1.6% Widowed11.8% DivorcedWomen who gave birth in the past 12 months Now married:
6.1% (10)Unmarried:
93.9% (153)
Women who did not give birth in the past 12 months Now married:
11.9% (188)Unmarried:
88.1% (1,399)
Marital status - White alone, not Hispanic / Latino population 15 years and over
Males 44.7% Never married29.8% Now married2.3% Separated4.7% Widowed18.4% DivorcedFemales 38.4% Never married31.3% Now married1.9% Separated13.4% Widowed15.1% DivorcedWomen who gave birth in the past 12 months Now married:
55.1% (78)Unmarried:
44.9% (64)
Women who did not give birth in the past 12 months Now married:
25.2% (1,274)Unmarried:
74.8% (3,782)
Marital status - Hispanic or Latino population 15 years and over
Males 46.0% Never married39.3% Now married1.9% Separated3.6% Widowed9.2% DivorcedFemales 47.1% Never married31.9% Now married2.3% Separated10.3% Widowed8.3% DivorcedWomen who gave birth in the past 12 months Now married:
0.0% (0)Unmarried:
100.0% (138)
Women who did not give birth in the past 12 months Now married:
33.0% (448)Unmarried:
67.0% (910)
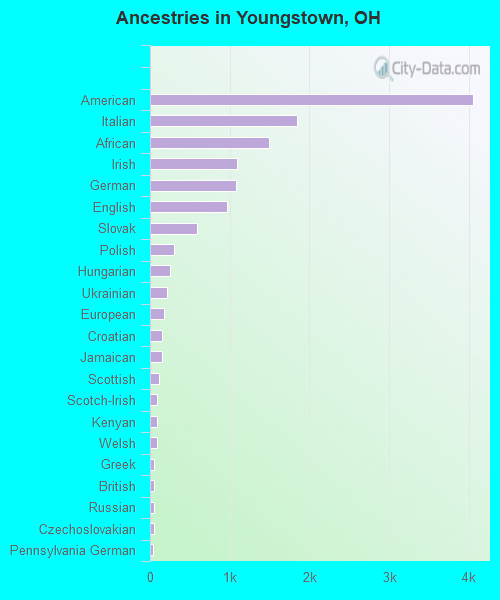
Ancestries in Youngstown
4,051 11.8% American1,844 5.3% Italian1,496 4.3% African1,087 3.2% Irish1,080 3.1% German967 2.8% English588 1.7% Slovak297 0.9% Polish245 0.7% Hungarian210 0.6% Ukrainian170 0.5% European146 0.4% Croatian145 0.4% Jamaican112 0.3% Scottish93 0.3% Scotch-Irish89 0.3% Kenyan85 0.2% Welsh54 0.2% Greek53 0.2% British53 0.2% Russian45 0.1% Czechoslovakian38 0.1% Pennsylvania German36 0.1% Romanian33 0.10% Austrian30 0.09% Palestinian29 0.08% Jordanian29 0.08% Haitian26 0.08% New Zealander25 0.07% Dutch23 0.07% Serbian23 0.07% Ghanaian21 0.06% Swedish19 0.06% Lebanese18 0.05% Brazilian18 0.05% Bahamian16 0.05% Portuguese16 0.05% Eastern European11 0.03% Slavic11 0.03% Nigerian11 0.03% Czech10 0.03% Yugoslavian9 0.03% French7 0.02% West Indian5 0.01% Finnish5 0.01% Barbadian3 0.01% Celtic3 0.01% Israeli
Geographical mobility in Youngstown Same house 1 year ago 22,444 88.3% White (Caucasian)19,128 80.8% Black or African American337 77.6% American Indian / Alaska Native240 69.7% Asian4 100.0% Native Hawaiian / Pacific Islander2,248 85.2% Other race6,511 86.5% Two or more races21,224 88.0% White alone, not Hispanic / Latino5,860 84.4% Hispanic or LatinoMoved within same county 1,209 4.8% White / Caucasian2,034 8.6% Black or African American18 4.1% American Indian / Alaska Native35 10.2% Asian177 6.7% Other race633 8.4% Two or more races1,133 4.7% White alone, not Hispanic / Latino534 7.7% Hispanic or LatinoMoved within same state 963 3.8% White / Caucasian2,016 8.5% Black or African American8 1.8% American Indian / Alaska Native7 2.0% Asian62 2.4% Other race398 5.3% Two or more races945 3.9% White alone, not Hispanic / Latino299 4.3% Hispanic or LatinoMoved from different state 255 1.0% White / Caucasian217 0.9% Black or African American90 20.7% American Indian / Alaska Native9 2.5% Asian75 2.9% Other race59 0.8% Two or more races243 1.0% White alone, not Hispanic / Latino95 1.4% Hispanic or LatinoMoved from abroad 237 0.9% White137 0.6% Black or African American52 15.1% Asian68 2.6% Other race25 0.3% Two or more races291 1.2% White alone, not Hispanic / Latino122 1.8% Hispanic or Latino
Children Nativity (place of birth) in Youngstown
Children under 6 years - Living with two parents Both parents native 487 100.0% NativeOne native, one foreign-born parent 102 100.0% NativeChildren under 6 years - Living with one parent Native parent 3,192 100.0% NativeChildren 6 to 17 years - Living with two parents Both parents native 2,050 100.0% NativeBoth parents foreign-born 370 90.3% Native40 9.7% Foreign-bornOne native, one foreign-born parent 137 100.0% NativeChildren 6 to 17 years - Living with one parent Native parent 5,576 100.0% Native
Grandparents responsible for own grandchildren in Youngstown
Grandparents (30 to 59 years) White / Caucasian 51 32.3% Responsible for grandchildren106 67.7% Not responsible for grandchildrenBlack or African American 128 62.1% Responsible for grandchildren78 37.9% Not responsible for grandchildrenAmerican Indian / Alaska Native 7 100.0% Responsible for grandchildrenOther race 8 100.0% Not responsible for grandchildrenTwo or more races 20 100.0% Not responsible for grandchildrenWhite alone, not Hispanic / Latino 51 38.5% Responsible for grandchildren81 61.5% Not responsible for grandchildrenHispanic or Latino 61 100.0% Not responsible for grandchildrenGrandparents (60 years and over) White / Caucasian 113 55.7% Responsible for grandchildren90 44.3% Not responsible for grandchildrenBlack or African American 226 65.0% Responsible for grandchildren121 35.0% Not responsible for grandchildrenOther race 13 100.0% Responsible for grandchildrenTwo or more races 18 100.0% Not responsible for grandchildrenWhite alone, not Hispanic / Latino 112 57.8% Responsible for grandchildren82 42.2% Not responsible for grandchildrenHispanic or Latino 9 17.4% Responsible for grandchildren43 82.6% Not responsible for grandchildren