Races in Youngsville, Louisiana (LA) Detailed Stats
Data:
Races - White alone (%)
Races - White alone (% change since 2000)
Races - Black alone (%)
Races - Black alone (% change since 2000)
Races - American Indian alone (%)
Races - American Indian alone (% change since 2000)
Races - Asian alone (%)
Races - Asian alone (% change since 2000)
Races - Hispanic (%)
Races - Hispanic (% change since 2000)
Races - Native Hawaiian and Other Pacific Islander alone (%)
Races - Native Hawaiian and Other Pacific Islander alone (% change since 2000)
Races - Two or more races(%)
Races - Two or more races(% change since 2000)
Races - Other race alone (%)
Races - Other race alone (% change since 2000)
Racial diversity
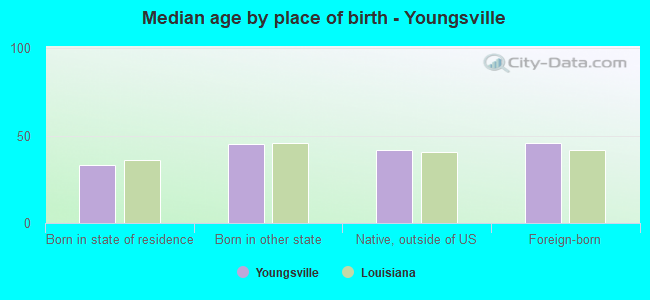
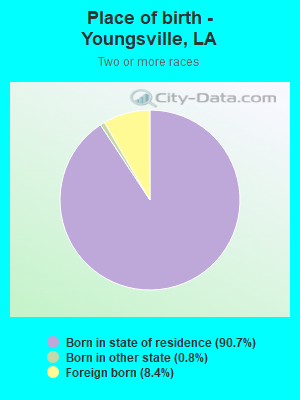
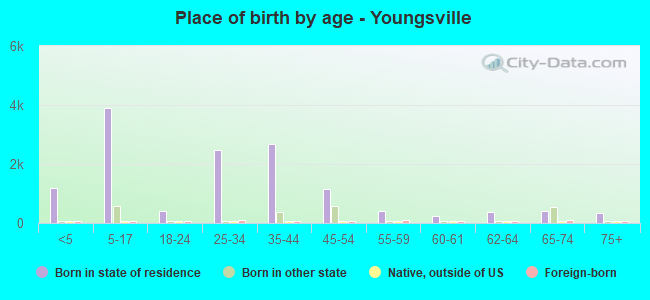
Place of birth - Born in state of residence (%)
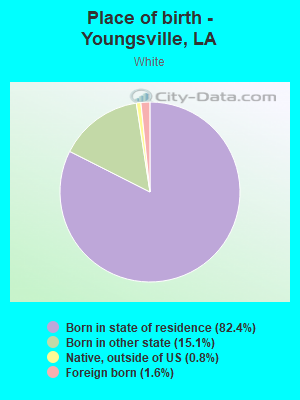
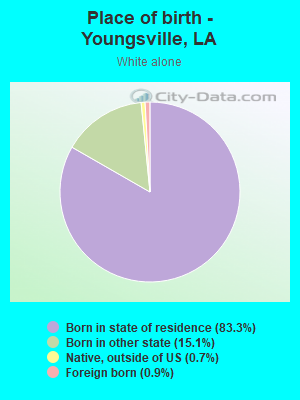
Place of birth - Born in state of residence (%) - White
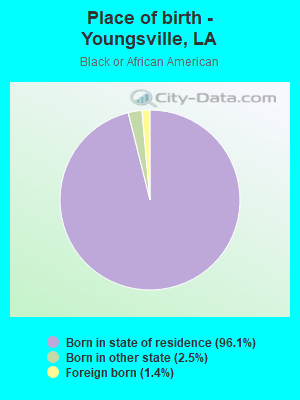
Place of birth - Born in state of residence (%) - Black or African American
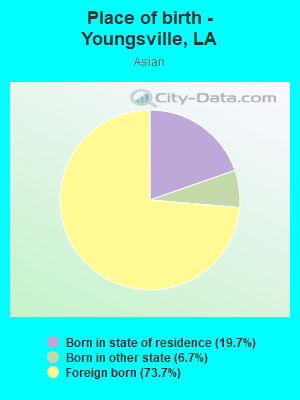
Place of birth - Born in state of residence (%) - Asian
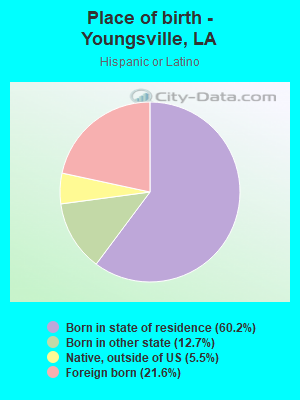
Place of birth - Born in state of residence (%) - Hispanic or Latino
Place of birth - Born in state of residence (%) - American Indian and Alaska Native
Place of birth - Born in state of residence (%) - Multirace
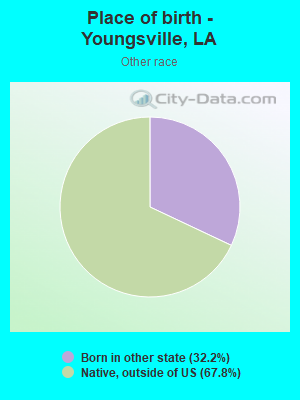
Place of birth - Born in state of residence (%) - Other Race
Place of birth - Born in other state (%)
Place of birth - Born in other state (%) - White
Place of birth - Born in other state (%) - Black or African American
Place of birth - Born in other state (%) - Asian
Place of birth - Born in other state (%) - Hispanic or Latino
Place of birth - Born in other state (%) - American Indian and Alaska Native
Place of birth - Born in other state (%) - Multirace
Place of birth - Born in other state (%) - Other Race
Place of birth - Native, outside of US (%)
Place of birth - Native, outside of US (%) - White
Place of birth - Native, outside of US (%) - Black or African American
Place of birth - Native, outside of US (%) - Asian
Place of birth - Native, outside of US (%) - Hispanic or Latino
Place of birth - Native, outside of US (%) - American Indian and Alaska Native
Place of birth - Native, outside of US (%) - Multirace
Place of birth - Native, outside of US (%) - Other Race
Place of birth - Foreign born (%)
Place of birth - Foreign born (%) - White
Place of birth - Foreign born (%) - Black or African American
Place of birth - Foreign born (%) - Asian
Place of birth - Foreign born (%) - Hispanic or Latino
Place of birth - Foreign born (%) - American Indian and Alaska Native
Place of birth - Foreign born (%) - Multirace
Place of birth - Foreign born (%) - Other Race
Residents speaking English at home (%)
Residents speaking English at home - Born in the United States (%)
Residents speaking English at home - Native, born elsewhere (%)
Residents speaking English at home - Foreign born (%)
Residents speaking Spanish at home (%)
Residents speaking Spanish at home - Born in the United States (%)
Residents speaking Spanish at home - Native, born elsewhere (%)
Residents speaking Spanish at home - Foreign born (%)
Residents speaking other language at home (%)
Residents speaking other language at home - Born in the United States (%)
Residents speaking other language at home - Native, born elsewhere (%)
Residents speaking other language at home - Foreign born (%)
Marital status - Never married (%)
Marital status - Now married (%)
Marital status - Separated (%)
Marital status - Widowed (%)
Marital status - Divorced (%)
Ancestries Reported - Arab (%)
Ancestries Reported - Czech (%)
Ancestries Reported - Danish (%)
Ancestries Reported - Dutch (%)
Ancestries Reported - English (%)
Ancestries Reported - French (%)
Ancestries Reported - French Canadian (%)
Ancestries Reported - German (%)
Ancestries Reported - Greek (%)
Ancestries Reported - Hungarian (%)
Ancestries Reported - Irish (%)
Ancestries Reported - Italian (%)
Ancestries Reported - Lithuanian (%)
Ancestries Reported - Norwegian (%)
Ancestries Reported - Polish (%)
Ancestries Reported - Portuguese (%)
Ancestries Reported - Russian (%)
Ancestries Reported - Scotch-Irish (%)
Ancestries Reported - Scottish (%)
Ancestries Reported - Slovak (%)
Ancestries Reported - Subsaharan African (%)
Ancestries Reported - Swedish (%)
Ancestries Reported - Swiss (%)
Ancestries Reported - Ukrainian (%)
Ancestries Reported - United States (%)
Ancestries Reported - Welsh (%)
Ancestries Reported - West Indian (%)
Ancestries Reported - Other (%)
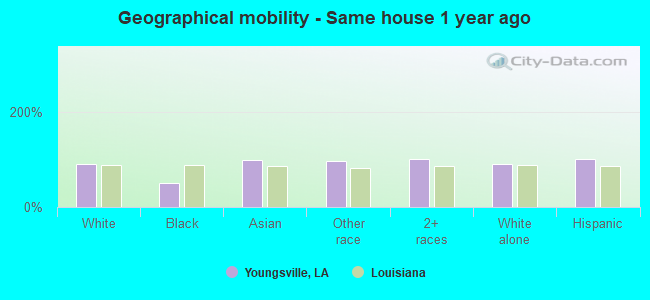
Geographical mobility - Same house 1 year ago (%)
Geographical mobility - Same house 1 year ago (%) - White
Geographical mobility - Same house 1 year ago (%) - Black or African American
Geographical mobility - Same house 1 year ago (%) - Asian
Geographical mobility - Same house 1 year ago (%) - Hispanic or Latino
Geographical mobility - Same house 1 year ago (%) - American Indian and Alaska Native
Geographical mobility - Same house 1 year ago (%) - Multirace
Geographical mobility - Same house 1 year ago (%) - Other Race
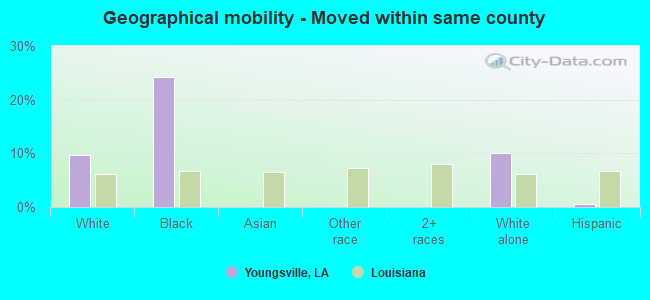
Geographical mobility - Moved within same county (%)
Geographical mobility - Moved within same county (%) - White
Geographical mobility - Moved within same county (%) - Black or African American
Geographical mobility - Moved within same county (%) - Asian
Geographical mobility - Moved within same county (%) - Hispanic or Latino
Geographical mobility - Moved within same county (%) - American Indian and Alaska Native
Geographical mobility - Moved within same county (%) - Multirace
Geographical mobility - Moved within same county (%) - Other Race
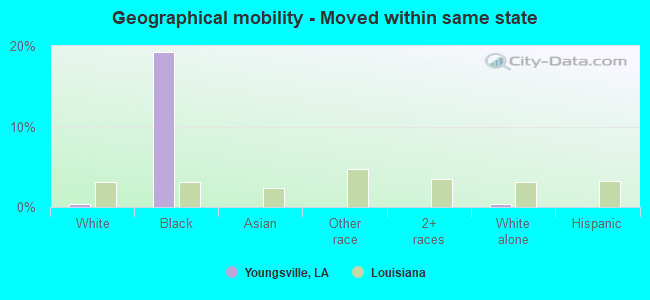
Geographical mobility - Moved from different county within same state (%)
Geographical mobility - Moved from different county within same state (%) - White
Geographical mobility - Moved from different county within same state (%) - Black or African American
Geographical mobility - Moved from different county within same state (%) - Asian
Geographical mobility - Moved from different county within same state (%) - Hispanic or Latino
Geographical mobility - Moved from different county within same state (%) - American Indian and Alaska Native
Geographical mobility - Moved from different county within same state (%) - Multirace
Geographical mobility - Moved from different county within same state (%) - Other Race
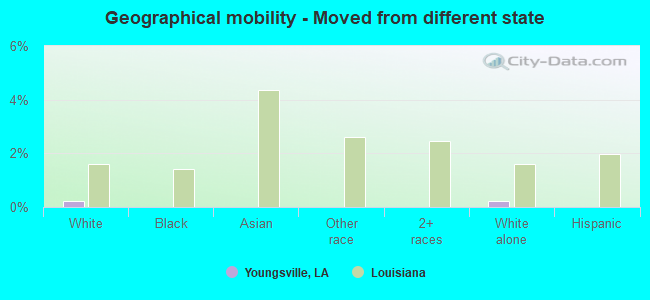
Geographical mobility - Moved from different state (%)
Geographical mobility - Moved from different state (%) - White
Geographical mobility - Moved from different state (%) - Black or African American
Geographical mobility - Moved from different state (%) - Asian
Geographical mobility - Moved from different state (%) - Hispanic or Latino
Geographical mobility - Moved from different state (%) - American Indian and Alaska Native
Geographical mobility - Moved from different state (%) - Multirace
Geographical mobility - Moved from different state (%) - Other Race
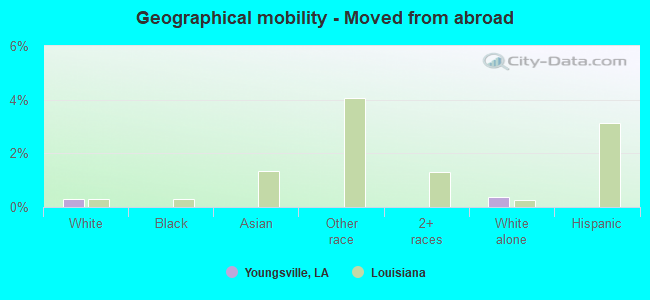
Geographical mobility - Moved from abroad (%)
Geographical mobility - Moved from abroad (%) - White
Geographical mobility - Moved from abroad (%) - Black or African American
Geographical mobility - Moved from abroad (%) - Asian
Geographical mobility - Moved from abroad (%) - Hispanic or Latino
Geographical mobility - Moved from abroad (%) - American Indian and Alaska Native
Geographical mobility - Moved from abroad (%) - Multirace
Geographical mobility - Moved from abroad (%) - Other Race
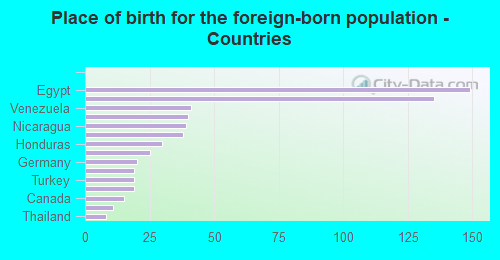
Place of birth for the foreign-born population - Ireland (%)
Place of birth for the foreign-born population - Denmark (%)
Place of birth for the foreign-born population - Norway (%)
Place of birth for the foreign-born population - Sweden (%)
Place of birth for the foreign-born population - United Kingdom (%)
Place of birth for the foreign-born population - England (%)
Place of birth for the foreign-born population - Scotland (%)
Place of birth for the foreign-born population - Other Northern Europe (%)
Place of birth for the foreign-born population - Austria (%)
Place of birth for the foreign-born population - Belgium (%)
Place of birth for the foreign-born population - France (%)
Place of birth for the foreign-born population - Germany (%)
Place of birth for the foreign-born population - Netherlands (%)
Place of birth for the foreign-born population - Switzerland (%)
Place of birth for the foreign-born population - Other Western Europe (%)
Place of birth for the foreign-born population - Greece (%)
Place of birth for the foreign-born population - Italy (%)
Place of birth for the foreign-born population - Portugal (%)
Place of birth for the foreign-born population - Spain (%)
Place of birth for the foreign-born population - Other Southern Europe (%)
Place of birth for the foreign-born population - Albania (%)
Place of birth for the foreign-born population - Belarus (%)
Place of birth for the foreign-born population - Bosnia and Herzegovina (%)
Place of birth for the foreign-born population - Bulgaria (%)
Place of birth for the foreign-born population - Croatia (%)
Place of birth for the foreign-born population - Czechoslovakia (%)
Place of birth for the foreign-born population - Hungary (%)
Place of birth for the foreign-born population - Latvia (%)
Place of birth for the foreign-born population - Lithuania (%)
Place of birth for the foreign-born population - North Macedonia (Macedonia) (%)
Place of birth for the foreign-born population - Moldova (%)
Place of birth for the foreign-born population - Poland (%)
Place of birth for the foreign-born population - Romania (%)
Place of birth for the foreign-born population - Russia (%)
Place of birth for the foreign-born population - Serbia (%)
Place of birth for the foreign-born population - Ukraine (%)
Place of birth for the foreign-born population - Other Eastern Europe (%)
Place of birth for the foreign-born population - China (%)
Place of birth for the foreign-born population - Hong Kong (%)
Place of birth for the foreign-born population - Taiwan (%)
Place of birth for the foreign-born population - Japan (%)
Place of birth for the foreign-born population - Korea (%)
Place of birth for the foreign-born population - Other Eastern Asia (%)
Place of birth for the foreign-born population - Afghanistan (%)
Place of birth for the foreign-born population - Bangladesh (%)
Place of birth for the foreign-born population - India (%)
Place of birth for the foreign-born population - Iran (%)
Place of birth for the foreign-born population - Kazakhstan (%)
Place of birth for the foreign-born population - Nepal (%)
Place of birth for the foreign-born population - Pakistan (%)
Place of birth for the foreign-born population - Sri Lanka (%)
Place of birth for the foreign-born population - Uzbekistan (%)
Place of birth for the foreign-born population - Other South Central Asia (%)
Place of birth for the foreign-born population - Burma (%)
Place of birth for the foreign-born population - Cambodia (%)
Place of birth for the foreign-born population - Indonesia (%)
Place of birth for the foreign-born population - Laos (%)
Place of birth for the foreign-born population - Malaysia (%)
Place of birth for the foreign-born population - Philippines (%)
Place of birth for the foreign-born population - Singapore (%)
Place of birth for the foreign-born population - Thailand (%)
Place of birth for the foreign-born population - Vietnam (%)
Place of birth for the foreign-born population - Other South Eastern Asia (%)
Place of birth for the foreign-born population - Armenia (%)
Place of birth for the foreign-born population - Iraq (%)
Place of birth for the foreign-born population - Israel (%)
Place of birth for the foreign-born population - Jordan (%)
Place of birth for the foreign-born population - Kuwait (%)
Place of birth for the foreign-born population - Lebanon (%)
Place of birth for the foreign-born population - Saudi Arabia (%)
Place of birth for the foreign-born population - Syria (%)
Place of birth for the foreign-born population - Turkey (%)
Place of birth for the foreign-born population - Yemen (%)
Place of birth for the foreign-born population - Other Western Asia (%)
Place of birth for the foreign-born population - Eritrea (%)
Place of birth for the foreign-born population - Ethiopia (%)
Place of birth for the foreign-born population - Kenya (%)
Place of birth for the foreign-born population - Somalia (%)
Place of birth for the foreign-born population - Uganda (%)
Place of birth for the foreign-born population - Zimbabwe (%)
Place of birth for the foreign-born population - Other Eastern Africa (%)
Place of birth for the foreign-born population - Cameroon (%)
Place of birth for the foreign-born population - Congo (%)
Place of birth for the foreign-born population - Democratic Republic of Congo (Zaire) (%)
Place of birth for the foreign-born population - Other Middle Africa (%)
Place of birth for the foreign-born population - Egypt (%)
Place of birth for the foreign-born population - Morocco (%)
Place of birth for the foreign-born population - Sudan (%)
Place of birth for the foreign-born population - Other Northern Africa (%)
Place of birth for the foreign-born population - South Africa (%)
Place of birth for the foreign-born population - Other Southern Africa (%)
Place of birth for the foreign-born population - Cabo Verde (%)
Place of birth for the foreign-born population - Ghana (%)
Place of birth for the foreign-born population - Liberia (%)
Place of birth for the foreign-born population - Nigeria (%)
Place of birth for the foreign-born population - Senegal (%)
Place of birth for the foreign-born population - Sierra Leone (%)
Place of birth for the foreign-born population - Other Western Africa (%)
Place of birth for the foreign-born population - Australia (%)
Place of birth for the foreign-born population - New Zealand (%)
Place of birth for the foreign-born population - Fiji (%)
Place of birth for the foreign-born population - Micronesia (%)
Place of birth for the foreign-born population - Bahamas (%)
Place of birth for the foreign-born population - Barbados (%)
Place of birth for the foreign-born population - Cuba (%)
Place of birth for the foreign-born population - Dominica (%)
Place of birth for the foreign-born population - Dominican Republic (%)
Place of birth for the foreign-born population - Grenada (%)
Place of birth for the foreign-born population - Haiti (%)
Place of birth for the foreign-born population - Jamaica (%)
Place of birth for the foreign-born population - St. Vincent and the Grenadines (%)
Place of birth for the foreign-born population - Trinidad and Tobago (%)
Place of birth for the foreign-born population - West Indies (%)
Place of birth for the foreign-born population - Other Caribbean (%)
Place of birth for the foreign-born population - Belize (%)
Place of birth for the foreign-born population - Costa Rica (%)
Place of birth for the foreign-born population - El Salvador (%)
Place of birth for the foreign-born population - Guatemala (%)
Place of birth for the foreign-born population - Honduras (%)
Place of birth for the foreign-born population - Mexico (%)
Place of birth for the foreign-born population - Nicaragua (%)
Place of birth for the foreign-born population - Panama (%)
Place of birth for the foreign-born population - Other Central America (%)
Place of birth for the foreign-born population - Argentina (%)
Place of birth for the foreign-born population - Bolivia (%)
Place of birth for the foreign-born population - Brazil (%)
Place of birth for the foreign-born population - Chile (%)
Place of birth for the foreign-born population - Colombia (%)
Place of birth for the foreign-born population - Ecuador (%)
Place of birth for the foreign-born population - Guyana (%)
Place of birth for the foreign-born population - Peru (%)
Place of birth for the foreign-born population - Uruguay (%)
Place of birth for the foreign-born population - Venezuela (%)
Place of birth for the foreign-born population - Other South America (%)
Place of birth for the foreign-born population - Canada (%)
Place of birth for the foreign-born population - Other Northern America (%)
Place of birth for the foreign-born population - Other (%)
Latest news about races in Youngsville, LA collected exclusively by city-data.com from local newspapers, TV, and radio stations
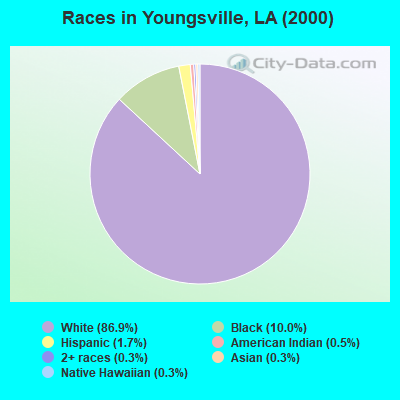
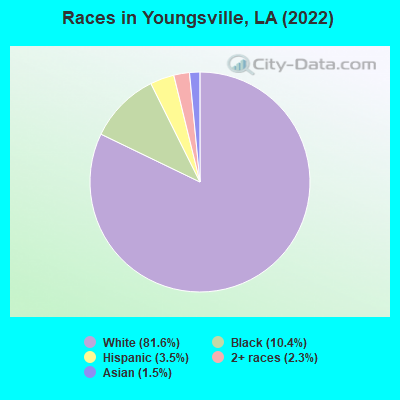
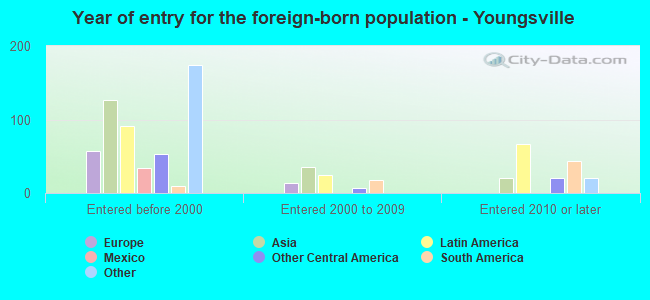
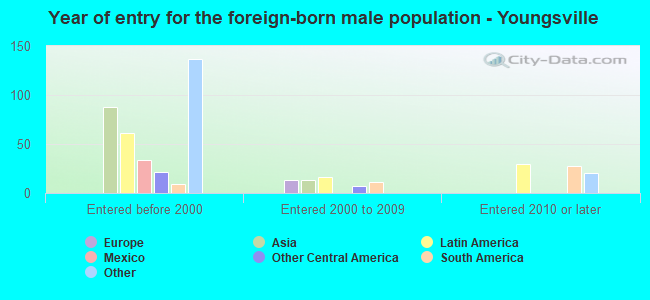
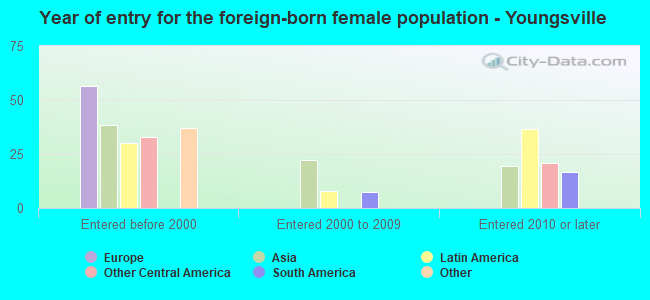
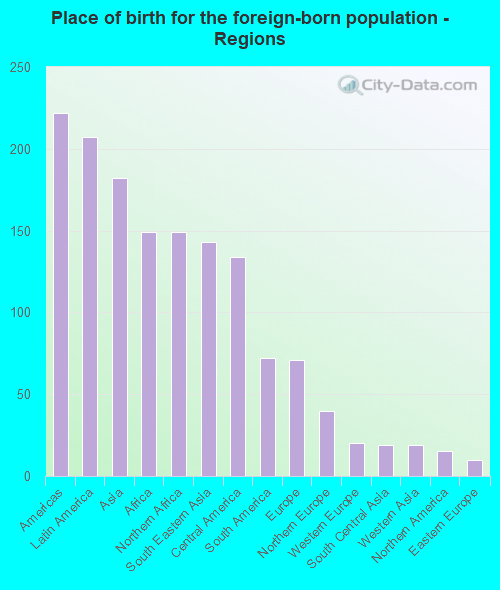
According to 2022 data, the most numerous races in Youngsville, LA are White alone (13,304 residents), Black alone (1,691 residents), and Hispanic (569 residents). 94.3% of Youngsville residents speak English at home. 3.8% of Youngsville, LA residents are foreign-born (1.3% born in Latin America, 1.1% born in Asia, 0.9% born in Africa, 0.4% born in Europe), which is 4.1% less than the foreign-born rate of 4.0% across the entire state of Louisiana.
Race distribution in Youngsville
2000 2022
2,794,391 62.5% White alone 1,443,390 32.3% Black alone 107,738 2.4% Hispanic 54,256 1.2% Asian alone 39,260 0.9% Two or more races 24,129 0.5% American Indian alone 4,736 0.1% Other race alone 1,076 0.02% Native Hawaiian and Other
2,603,221 56.7% White alone 1,420,055 30.9% Black alone 262,213 5.7% Hispanic 183,270 4.0% Two or more races 81,169 1.8% Asian alone 19,991 0.4% American Indian alone 18,043 0.4% Other race alone 2,279 0.05% Native Hawaiian and Other
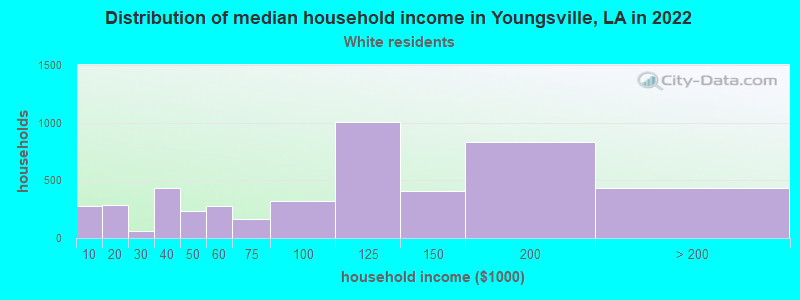
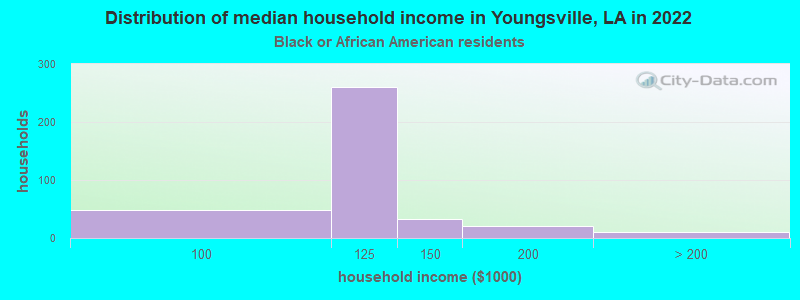
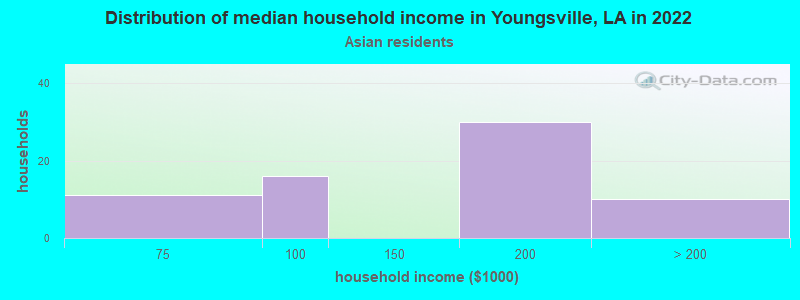
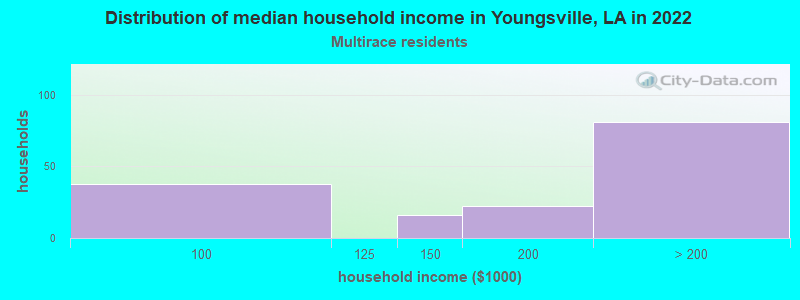
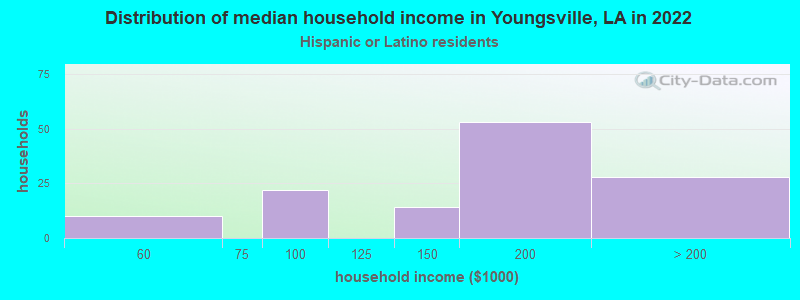
Income and house value in Youngsville Median household income in 2022 $94,157 White non-Hispanic householders$110,111 Black householders$157,371 Asian householdersover $200,000 Two or more races householders$168,195 Hispanic or Latino race householdersMedian 2022 house value $279,095 White Non-Hispanic householders$123,493 Black or African American householders$92,620 American Indian or Alaska Native householders
Median age by race in Youngsville
34.8 Median age for White residents34.5 35.7 30.9 Median age for Black or African American residents40.2 29.3 -764,444,443.7 Median age for American Indian / Alaska Native residents-721,428,570.7 -781,341,107.1 45.8 Median age for Asian residents80.8 36.3 -821,138,210.6 Median age for Native Hawaiian / Pacific Islander residents-666,666,666.0 -666,666,666.0 -371,111,110.7 Median age for Other race residents-633,663,365.7 -448,356,807.1 25.5 Median age for Two or more races residents26.3 18.5 34.6 Median age for White alone residents34.4 35.4 28.7 Median age for Hispanic or Latino residents23.6 35.3
Owner/renter occupied households by race in Youngsville
House owners and renters - White residents 4,088 88.1% Owner occupied552 11.9% Renter occupiedHouse owners and renters - Black or African American residents 297 61.7% Owner occupied184 38.3% Renter occupiedHouse owners and renters - Asian residents 120 100.0% Owner occupiedHouse owners and renters - Two or more races residents 202 100.0% Owner occupiedHouse owners and renters - White alone residents 4,120 88.8% Owner occupied518 11.2% Renter occupiedHouse owners and renters - Hispanic or Latino residents 83 72.8% Owner occupied31 27.2% Renter occupied
Language usage in Youngsville
English speakers - Total 94.3% of residents of Youngsville speak English at home.
2.1% of residents speak Spanish at home 285 90.2% Speak English very well31 9.8% Speak English less than very well4.5% of residents speak other language at home 291 42.7% Speak English very well391 57.3% Speak English less than very well
English speakers - Born in the United States 97.0% of residents of Youngsville speak English at home.
3.7% of residents speak Spanish at home 73 89.0% Speak English very well9 11.0% Speak English less than very well
English speakers - Native, born elsewhere 73.4% of residents of Youngsville speak English at home.
28.4% of residents speak Spanish at home 31 100.0% Speak English very well
English speakers - Foreign-born 21.0% of residents of Youngsville speak English at home.
22.2% of residents speak Spanish at home 83 76.9% Speak English very well25 23.1% Speak English less than very well67.7% of residents speak other language at home 56 17.0% Speak English very well273 83.0% Speak English less than very well
White (Caucasian) - Speak only English Native:
96.6% (11,849)Foreign-born:
20.3% (45)
White (Caucasian) - Speak another language Native:
3.1% (380)Foreign-born:
68.8% (151)
Black or African American - Speak another language Native:
1.1% (19)Foreign-born:
100.0% (11)
Asian - Speak only English Native:
55.1% (47)Foreign-born:
9.5% (16)
Asian - Speak another language Native:
42.8% (37)Foreign-born:
90.5% (154)
Two or more races - Speak only English Native:
98.6% (612)Foreign-born:
20.4% (12)
Two or more races - Speak another language Native:
3.6% (22)Foreign-born:
69.6% (42)
White alone - Speak only English Native:
97.0% (11,820)Foreign-born:
23.3% (27)
White alone - Speak another language Native:
2.6% (321)Foreign-born:
100.0% (114)
Hispanic or Latino - Speak only English Native:
64.2% (266)Foreign-born:
49.0% (63)
Hispanic or Latino - Speak another language Native:
34.1% (141)Foreign-born:
69.0% (89)
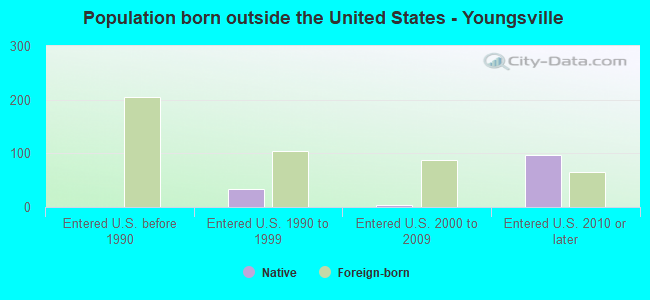
Foreign-born residents in Youngsville 626 residents are foreign born (1.3% Latin America , 1.1% Asia , 0.9% Africa , 0.4% Europe ).
This city:
3.8%Louisiana:
4.2%
Marital status for residents in Youngsville Marital status - White (Caucasian) population 15 years and over
Males 20.8% Never married70.3% Now married0.0% Separated0.0% Widowed8.9% DivorcedFemales 15.3% Never married72.0% Now married0.0% Separated5.6% Widowed7.0% DivorcedWomen who gave birth in the past 12 months Now married:
100.0% (110)Unmarried:
0.0% (0)
Women who did not give birth in the past 12 months Now married:
72.8% (2,492)Unmarried:
27.2% (933)
Marital status - Black or African American population 15 years and over
Males 9.9% Never married90.1% Now married0.0% Separated0.0% Widowed0.0% DivorcedFemales 38.7% Never married61.3% Now married0.0% Separated0.0% Widowed0.0% DivorcedWomen who did not give birth in the past 12 months Now married:
56.9% (382)Unmarried:
43.1% (289)
Marital status - Asian population 15 years and over
Males 0.0% Never married100.0% Now married0.0% Separated0.0% Widowed0.0% DivorcedFemales 26.2% Never married73.8% Now married0.0% Separated0.0% Widowed0.0% DivorcedWomen who did not give birth in the past 12 months Now married:
58.8% (44)Unmarried:
41.2% (31)
Marital status - Other race population 15 years and over
Males 100.0% Never married0.0% Now married0.0% Separated0.0% Widowed0.0% DivorcedFemales 0.0% Never married100.0% Now married0.0% Separated0.0% Widowed0.0% DivorcedMarital status - Two or more races population 15 years and over
Males 59.5% Never married40.5% Now married0.0% Separated0.0% Widowed0.0% DivorcedFemales 28.7% Never married53.2% Now married0.0% Separated0.0% Widowed18.1% DivorcedWomen who did not give birth in the past 12 months Now married:
32.3% (36)Unmarried:
67.7% (76)
Marital status - White alone, not Hispanic / Latino population 15 years and over
Males 20.9% Never married70.1% Now married0.0% Separated0.0% Widowed9.0% DivorcedFemales 15.5% Never married72.4% Now married0.0% Separated5.7% Widowed6.4% DivorcedWomen who gave birth in the past 12 months Now married:
100.0% (112)Unmarried:
0.0% (0)
Women who did not give birth in the past 12 months Now married:
72.7% (2,498)Unmarried:
27.3% (939)
Marital status - Hispanic or Latino population 15 years and over
Males 39.9% Never married60.1% Now married0.0% Separated0.0% Widowed0.0% DivorcedFemales 6.4% Never married64.7% Now married0.0% Separated0.0% Widowed28.9% DivorcedWomen who did not give birth in the past 12 months Now married:
59.5% (52)Unmarried:
40.5% (35)
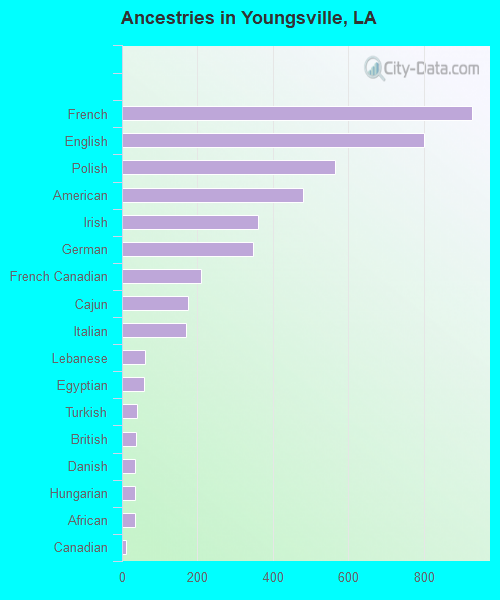
Ancestries in Youngsville
927 10.4% French801 8.9% English565 6.3% Polish481 5.4% American361 4.0% Irish348 3.9% German210 2.3% French Canadian176 2.0% Cajun169 1.9% Italian61 0.7% Lebanese59 0.7% Egyptian40 0.4% Turkish36 0.4% British35 0.4% Danish35 0.4% Hungarian34 0.4% African11 0.1% Canadian3 0.03% European
Children Nativity (place of birth) in Youngsville
Children under 6 years - Living with two parents Both parents native 1,143 100.0% NativeBoth parents foreign-born 18 100.0% NativeOne native, one foreign-born parent 172 100.0% NativeChildren under 6 years - Living with one parent Native parent 154 100.0% NativeChildren 6 to 17 years - Living with two parents Both parents native 3,394 100.0% Native2 0.0% Foreign-bornBoth parents foreign-born 41 90.0% Native5 10.0% Foreign-bornOne native, one foreign-born parent 140 100.0% NativeChildren 6 to 17 years - Living with one parent Native parent 507 100.0% Native
Grandparents responsible for own grandchildren in Youngsville
Grandparents (30 to 59 years) White / Caucasian 46 100.0% Not responsible for grandchildrenBlack or African American 8 100.0% Not responsible for grandchildrenWhite alone, not Hispanic / Latino 46 100.0% Not responsible for grandchildren
Grandparents (60 years and over)