Races in Ypsilanti, Michigan (MI) Detailed Stats
Data:
Races - White alone (%)
Races - White alone (% change since 2000)
Races - Black alone (%)
Races - Black alone (% change since 2000)
Races - American Indian alone (%)
Races - American Indian alone (% change since 2000)
Races - Asian alone (%)
Races - Asian alone (% change since 2000)
Races - Hispanic (%)
Races - Hispanic (% change since 2000)
Races - Native Hawaiian and Other Pacific Islander alone (%)
Races - Native Hawaiian and Other Pacific Islander alone (% change since 2000)
Races - Two or more races(%)
Races - Two or more races(% change since 2000)
Races - Other race alone (%)
Races - Other race alone (% change since 2000)
Racial diversity
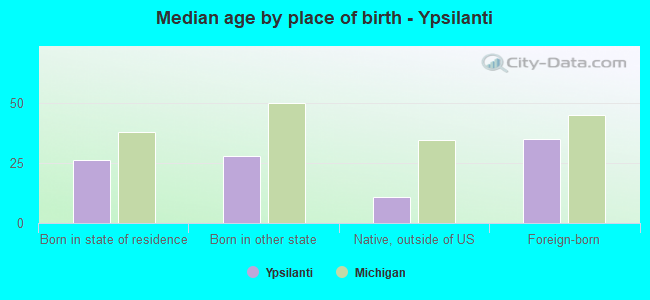
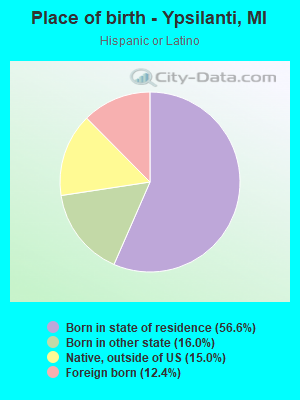
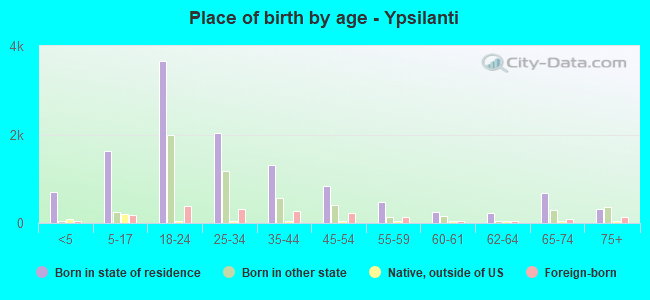
Place of birth - Born in state of residence (%)
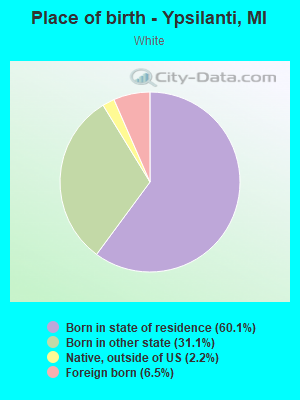
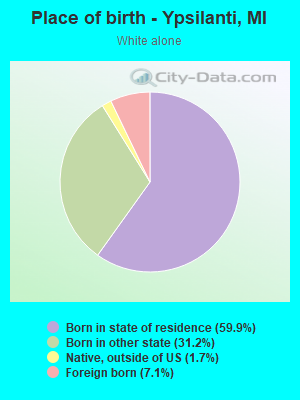
Place of birth - Born in state of residence (%) - White
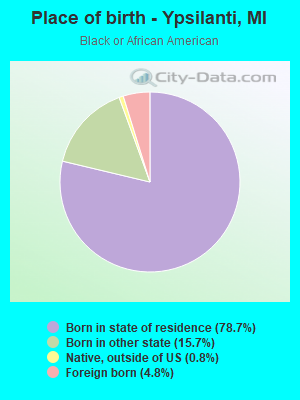
Place of birth - Born in state of residence (%) - Black or African American
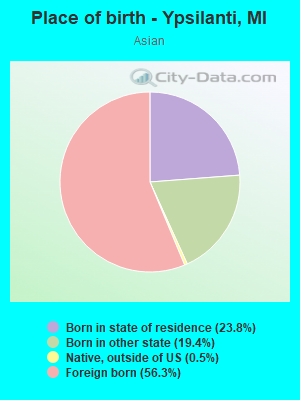
Place of birth - Born in state of residence (%) - Asian
Place of birth - Born in state of residence (%) - Hispanic or Latino
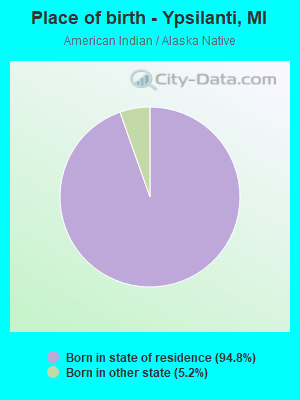
Place of birth - Born in state of residence (%) - American Indian and Alaska Native
Place of birth - Born in state of residence (%) - Multirace
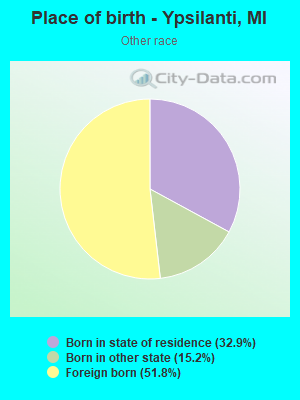
Place of birth - Born in state of residence (%) - Other Race
Place of birth - Born in other state (%)
Place of birth - Born in other state (%) - White
Place of birth - Born in other state (%) - Black or African American
Place of birth - Born in other state (%) - Asian
Place of birth - Born in other state (%) - Hispanic or Latino
Place of birth - Born in other state (%) - American Indian and Alaska Native
Place of birth - Born in other state (%) - Multirace
Place of birth - Born in other state (%) - Other Race
Place of birth - Native, outside of US (%)
Place of birth - Native, outside of US (%) - White
Place of birth - Native, outside of US (%) - Black or African American
Place of birth - Native, outside of US (%) - Asian
Place of birth - Native, outside of US (%) - Hispanic or Latino
Place of birth - Native, outside of US (%) - American Indian and Alaska Native
Place of birth - Native, outside of US (%) - Multirace
Place of birth - Native, outside of US (%) - Other Race
Place of birth - Foreign born (%)
Place of birth - Foreign born (%) - White
Place of birth - Foreign born (%) - Black or African American
Place of birth - Foreign born (%) - Asian
Place of birth - Foreign born (%) - Hispanic or Latino
Place of birth - Foreign born (%) - American Indian and Alaska Native
Place of birth - Foreign born (%) - Multirace
Place of birth - Foreign born (%) - Other Race
Residents speaking English at home (%)
Residents speaking English at home - Born in the United States (%)
Residents speaking English at home - Native, born elsewhere (%)
Residents speaking English at home - Foreign born (%)
Residents speaking Spanish at home (%)
Residents speaking Spanish at home - Born in the United States (%)
Residents speaking Spanish at home - Native, born elsewhere (%)
Residents speaking Spanish at home - Foreign born (%)
Residents speaking other language at home (%)
Residents speaking other language at home - Born in the United States (%)
Residents speaking other language at home - Native, born elsewhere (%)
Residents speaking other language at home - Foreign born (%)
Marital status - Never married (%)
Marital status - Now married (%)
Marital status - Separated (%)
Marital status - Widowed (%)
Marital status - Divorced (%)
Ancestries Reported - Arab (%)
Ancestries Reported - Czech (%)
Ancestries Reported - Danish (%)
Ancestries Reported - Dutch (%)
Ancestries Reported - English (%)
Ancestries Reported - French (%)
Ancestries Reported - French Canadian (%)
Ancestries Reported - German (%)
Ancestries Reported - Greek (%)
Ancestries Reported - Hungarian (%)
Ancestries Reported - Irish (%)
Ancestries Reported - Italian (%)
Ancestries Reported - Lithuanian (%)
Ancestries Reported - Norwegian (%)
Ancestries Reported - Polish (%)
Ancestries Reported - Portuguese (%)
Ancestries Reported - Russian (%)
Ancestries Reported - Scotch-Irish (%)
Ancestries Reported - Scottish (%)
Ancestries Reported - Slovak (%)
Ancestries Reported - Subsaharan African (%)
Ancestries Reported - Swedish (%)
Ancestries Reported - Swiss (%)
Ancestries Reported - Ukrainian (%)
Ancestries Reported - United States (%)
Ancestries Reported - Welsh (%)
Ancestries Reported - West Indian (%)
Ancestries Reported - Other (%)
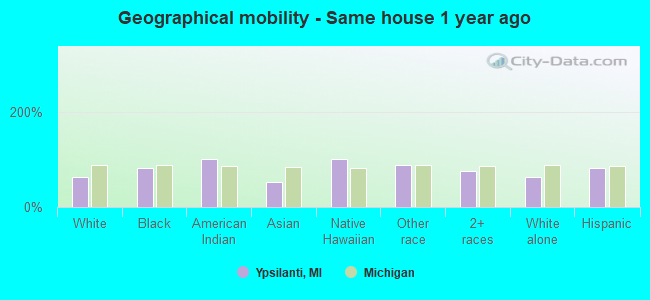
Geographical mobility - Same house 1 year ago (%)
Geographical mobility - Same house 1 year ago (%) - White
Geographical mobility - Same house 1 year ago (%) - Black or African American
Geographical mobility - Same house 1 year ago (%) - Asian
Geographical mobility - Same house 1 year ago (%) - Hispanic or Latino
Geographical mobility - Same house 1 year ago (%) - American Indian and Alaska Native
Geographical mobility - Same house 1 year ago (%) - Multirace
Geographical mobility - Same house 1 year ago (%) - Other Race
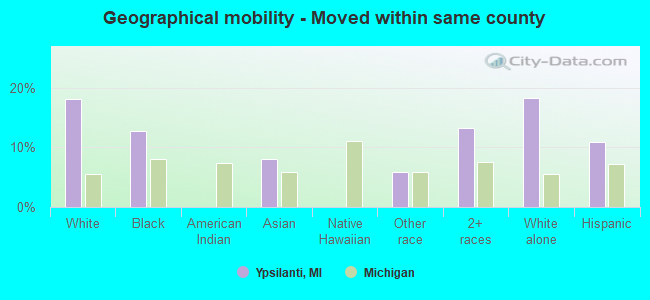
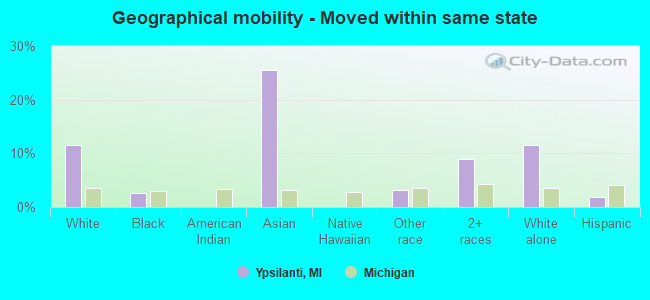
Geographical mobility - Moved within same county (%)
Geographical mobility - Moved within same county (%) - White
Geographical mobility - Moved within same county (%) - Black or African American
Geographical mobility - Moved within same county (%) - Asian
Geographical mobility - Moved within same county (%) - Hispanic or Latino
Geographical mobility - Moved within same county (%) - American Indian and Alaska Native
Geographical mobility - Moved within same county (%) - Multirace
Geographical mobility - Moved within same county (%) - Other Race
Geographical mobility - Moved from different county within same state (%)
Geographical mobility - Moved from different county within same state (%) - White
Geographical mobility - Moved from different county within same state (%) - Black or African American
Geographical mobility - Moved from different county within same state (%) - Asian
Geographical mobility - Moved from different county within same state (%) - Hispanic or Latino
Geographical mobility - Moved from different county within same state (%) - American Indian and Alaska Native
Geographical mobility - Moved from different county within same state (%) - Multirace
Geographical mobility - Moved from different county within same state (%) - Other Race
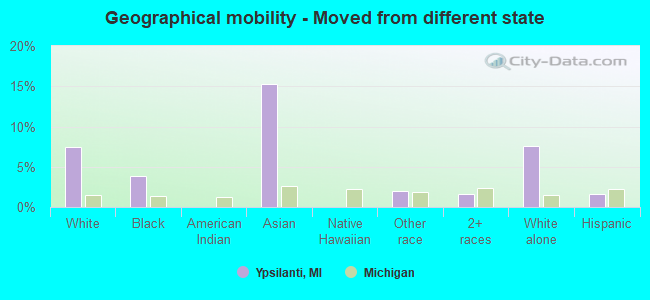
Geographical mobility - Moved from different state (%)
Geographical mobility - Moved from different state (%) - White
Geographical mobility - Moved from different state (%) - Black or African American
Geographical mobility - Moved from different state (%) - Asian
Geographical mobility - Moved from different state (%) - Hispanic or Latino
Geographical mobility - Moved from different state (%) - American Indian and Alaska Native
Geographical mobility - Moved from different state (%) - Multirace
Geographical mobility - Moved from different state (%) - Other Race
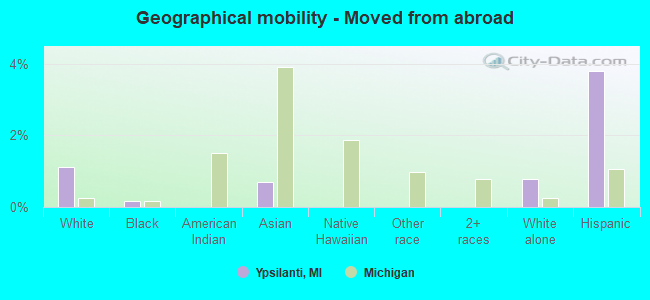
Geographical mobility - Moved from abroad (%)
Geographical mobility - Moved from abroad (%) - White
Geographical mobility - Moved from abroad (%) - Black or African American
Geographical mobility - Moved from abroad (%) - Asian
Geographical mobility - Moved from abroad (%) - Hispanic or Latino
Geographical mobility - Moved from abroad (%) - American Indian and Alaska Native
Geographical mobility - Moved from abroad (%) - Multirace
Geographical mobility - Moved from abroad (%) - Other Race
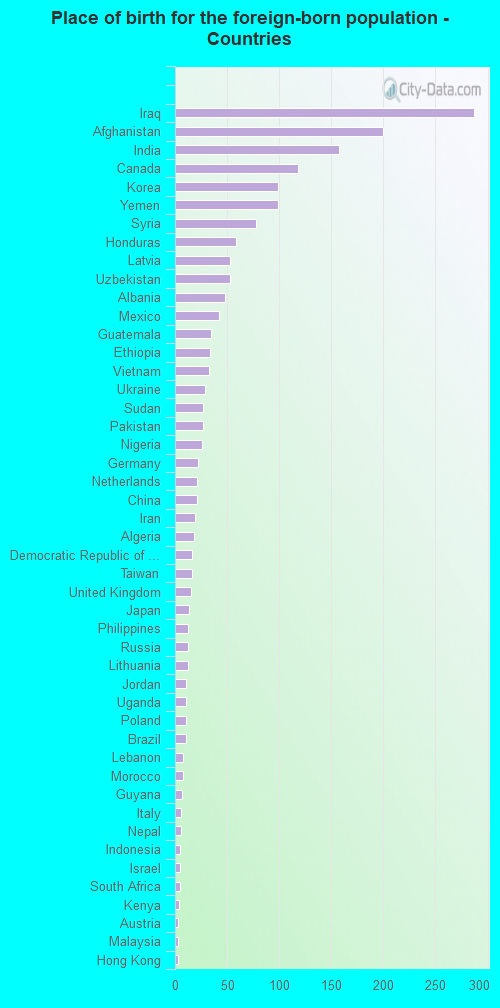
Place of birth for the foreign-born population - Ireland (%)
Place of birth for the foreign-born population - Denmark (%)
Place of birth for the foreign-born population - Norway (%)
Place of birth for the foreign-born population - Sweden (%)
Place of birth for the foreign-born population - United Kingdom (%)
Place of birth for the foreign-born population - England (%)
Place of birth for the foreign-born population - Scotland (%)
Place of birth for the foreign-born population - Other Northern Europe (%)
Place of birth for the foreign-born population - Austria (%)
Place of birth for the foreign-born population - Belgium (%)
Place of birth for the foreign-born population - France (%)
Place of birth for the foreign-born population - Germany (%)
Place of birth for the foreign-born population - Netherlands (%)
Place of birth for the foreign-born population - Switzerland (%)
Place of birth for the foreign-born population - Other Western Europe (%)
Place of birth for the foreign-born population - Greece (%)
Place of birth for the foreign-born population - Italy (%)
Place of birth for the foreign-born population - Portugal (%)
Place of birth for the foreign-born population - Spain (%)
Place of birth for the foreign-born population - Other Southern Europe (%)
Place of birth for the foreign-born population - Albania (%)
Place of birth for the foreign-born population - Belarus (%)
Place of birth for the foreign-born population - Bosnia and Herzegovina (%)
Place of birth for the foreign-born population - Bulgaria (%)
Place of birth for the foreign-born population - Croatia (%)
Place of birth for the foreign-born population - Czechoslovakia (%)
Place of birth for the foreign-born population - Hungary (%)
Place of birth for the foreign-born population - Latvia (%)
Place of birth for the foreign-born population - Lithuania (%)
Place of birth for the foreign-born population - North Macedonia (Macedonia) (%)
Place of birth for the foreign-born population - Moldova (%)
Place of birth for the foreign-born population - Poland (%)
Place of birth for the foreign-born population - Romania (%)
Place of birth for the foreign-born population - Russia (%)
Place of birth for the foreign-born population - Serbia (%)
Place of birth for the foreign-born population - Ukraine (%)
Place of birth for the foreign-born population - Other Eastern Europe (%)
Place of birth for the foreign-born population - China (%)
Place of birth for the foreign-born population - Hong Kong (%)
Place of birth for the foreign-born population - Taiwan (%)
Place of birth for the foreign-born population - Japan (%)
Place of birth for the foreign-born population - Korea (%)
Place of birth for the foreign-born population - Other Eastern Asia (%)
Place of birth for the foreign-born population - Afghanistan (%)
Place of birth for the foreign-born population - Bangladesh (%)
Place of birth for the foreign-born population - India (%)
Place of birth for the foreign-born population - Iran (%)
Place of birth for the foreign-born population - Kazakhstan (%)
Place of birth for the foreign-born population - Nepal (%)
Place of birth for the foreign-born population - Pakistan (%)
Place of birth for the foreign-born population - Sri Lanka (%)
Place of birth for the foreign-born population - Uzbekistan (%)
Place of birth for the foreign-born population - Other South Central Asia (%)
Place of birth for the foreign-born population - Burma (%)
Place of birth for the foreign-born population - Cambodia (%)
Place of birth for the foreign-born population - Indonesia (%)
Place of birth for the foreign-born population - Laos (%)
Place of birth for the foreign-born population - Malaysia (%)
Place of birth for the foreign-born population - Philippines (%)
Place of birth for the foreign-born population - Singapore (%)
Place of birth for the foreign-born population - Thailand (%)
Place of birth for the foreign-born population - Vietnam (%)
Place of birth for the foreign-born population - Other South Eastern Asia (%)
Place of birth for the foreign-born population - Armenia (%)
Place of birth for the foreign-born population - Iraq (%)
Place of birth for the foreign-born population - Israel (%)
Place of birth for the foreign-born population - Jordan (%)
Place of birth for the foreign-born population - Kuwait (%)
Place of birth for the foreign-born population - Lebanon (%)
Place of birth for the foreign-born population - Saudi Arabia (%)
Place of birth for the foreign-born population - Syria (%)
Place of birth for the foreign-born population - Turkey (%)
Place of birth for the foreign-born population - Yemen (%)
Place of birth for the foreign-born population - Other Western Asia (%)
Place of birth for the foreign-born population - Eritrea (%)
Place of birth for the foreign-born population - Ethiopia (%)
Place of birth for the foreign-born population - Kenya (%)
Place of birth for the foreign-born population - Somalia (%)
Place of birth for the foreign-born population - Uganda (%)
Place of birth for the foreign-born population - Zimbabwe (%)
Place of birth for the foreign-born population - Other Eastern Africa (%)
Place of birth for the foreign-born population - Cameroon (%)
Place of birth for the foreign-born population - Congo (%)
Place of birth for the foreign-born population - Democratic Republic of Congo (Zaire) (%)
Place of birth for the foreign-born population - Other Middle Africa (%)
Place of birth for the foreign-born population - Egypt (%)
Place of birth for the foreign-born population - Morocco (%)
Place of birth for the foreign-born population - Sudan (%)
Place of birth for the foreign-born population - Other Northern Africa (%)
Place of birth for the foreign-born population - South Africa (%)
Place of birth for the foreign-born population - Other Southern Africa (%)
Place of birth for the foreign-born population - Cabo Verde (%)
Place of birth for the foreign-born population - Ghana (%)
Place of birth for the foreign-born population - Liberia (%)
Place of birth for the foreign-born population - Nigeria (%)
Place of birth for the foreign-born population - Senegal (%)
Place of birth for the foreign-born population - Sierra Leone (%)
Place of birth for the foreign-born population - Other Western Africa (%)
Place of birth for the foreign-born population - Australia (%)
Place of birth for the foreign-born population - New Zealand (%)
Place of birth for the foreign-born population - Fiji (%)
Place of birth for the foreign-born population - Micronesia (%)
Place of birth for the foreign-born population - Bahamas (%)
Place of birth for the foreign-born population - Barbados (%)
Place of birth for the foreign-born population - Cuba (%)
Place of birth for the foreign-born population - Dominica (%)
Place of birth for the foreign-born population - Dominican Republic (%)
Place of birth for the foreign-born population - Grenada (%)
Place of birth for the foreign-born population - Haiti (%)
Place of birth for the foreign-born population - Jamaica (%)
Place of birth for the foreign-born population - St. Vincent and the Grenadines (%)
Place of birth for the foreign-born population - Trinidad and Tobago (%)
Place of birth for the foreign-born population - West Indies (%)
Place of birth for the foreign-born population - Other Caribbean (%)
Place of birth for the foreign-born population - Belize (%)
Place of birth for the foreign-born population - Costa Rica (%)
Place of birth for the foreign-born population - El Salvador (%)
Place of birth for the foreign-born population - Guatemala (%)
Place of birth for the foreign-born population - Honduras (%)
Place of birth for the foreign-born population - Mexico (%)
Place of birth for the foreign-born population - Nicaragua (%)
Place of birth for the foreign-born population - Panama (%)
Place of birth for the foreign-born population - Other Central America (%)
Place of birth for the foreign-born population - Argentina (%)
Place of birth for the foreign-born population - Bolivia (%)
Place of birth for the foreign-born population - Brazil (%)
Place of birth for the foreign-born population - Chile (%)
Place of birth for the foreign-born population - Colombia (%)
Place of birth for the foreign-born population - Ecuador (%)
Place of birth for the foreign-born population - Guyana (%)
Place of birth for the foreign-born population - Peru (%)
Place of birth for the foreign-born population - Uruguay (%)
Place of birth for the foreign-born population - Venezuela (%)
Place of birth for the foreign-born population - Other South America (%)
Place of birth for the foreign-born population - Canada (%)
Place of birth for the foreign-born population - Other Northern America (%)
Place of birth for the foreign-born population - Other (%)
Latest news about races in Ypsilanti, MI collected exclusively by city-data.com from local newspapers, TV, and radio stations
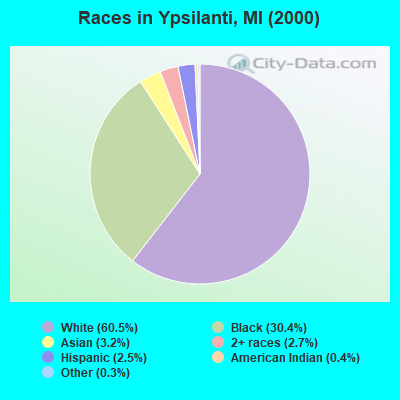
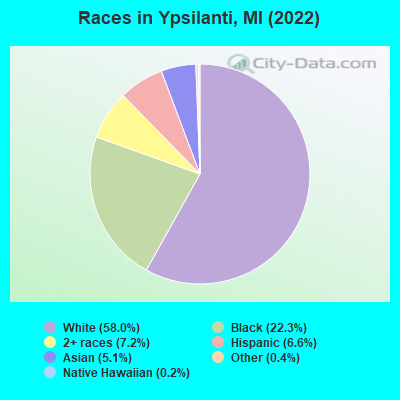
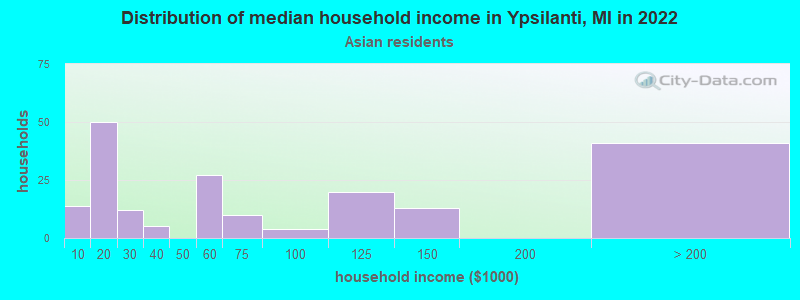
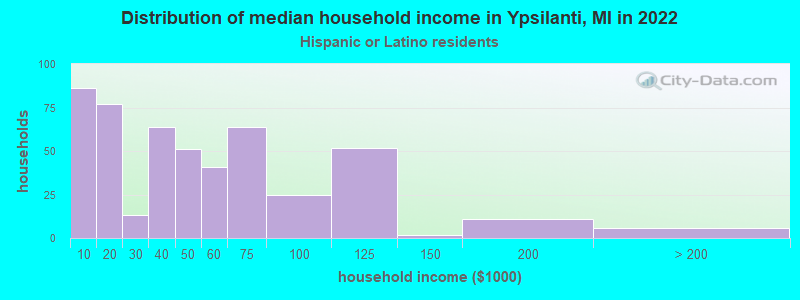
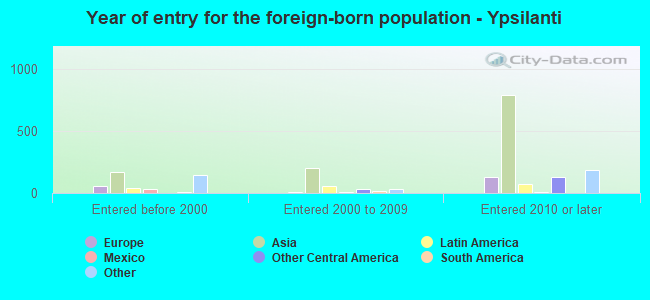
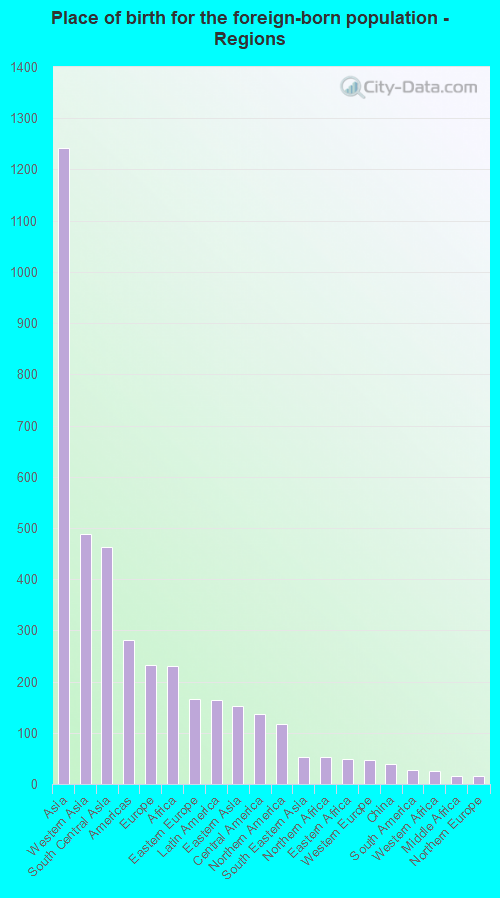
According to 2022 data, the most numerous races in Ypsilanti, MI are White alone (11,590 residents), Black alone (4,450 residents), and Hispanic (1,310 residents). 85.8% of Ypsilanti residents speak English at home. 9.9% of Ypsilanti, MI residents are foreign-born (6.1% born in Asia, 1.1% born in Europe, 1.1% born in Africa), which is 39.6% greater than the foreign-born rate of 6.0% across the entire state of Michigan.
Race distribution in Ypsilanti
2000 2022
7,806,691 78.6% White alone 1,402,047 14.1% Black alone 323,877 3.3% Hispanic 175,311 1.8% Asian alone 163,487 1.6% Two or more races 53,421 0.5% American Indian alone 11,465 0.1% Other race alone 2,145 0.02% Native Hawaiian and Other
7,289,051 72.6% White alone 1,310,464 13.1% Black alone 572,405 5.7% Hispanic 450,031 4.5% Two or more races 335,732 3.3% Asian alone 45,217 0.5% Other race alone 29,011 0.3% American Indian alone 2,207 0.02% Native Hawaiian and Other
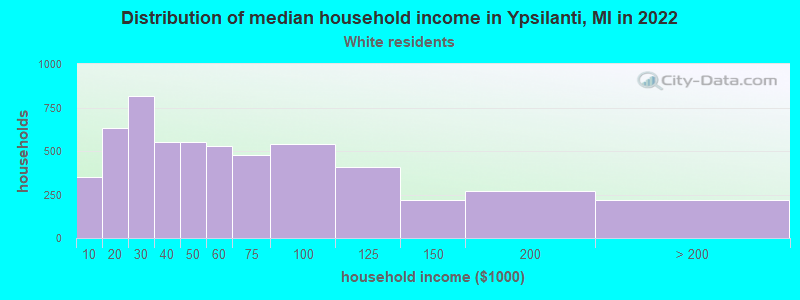
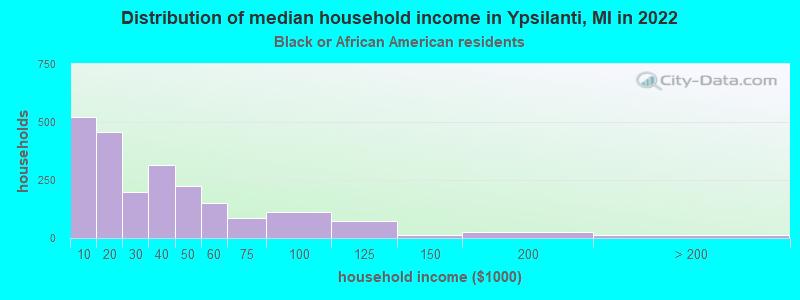
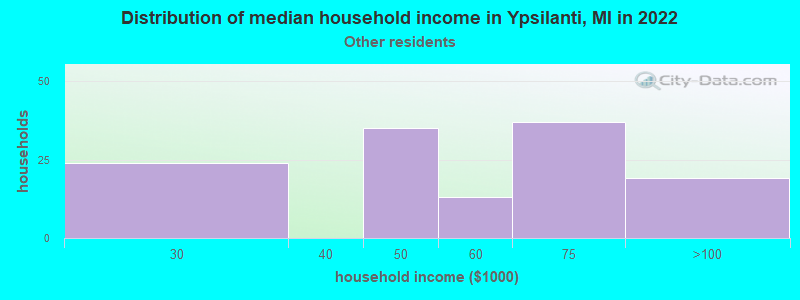
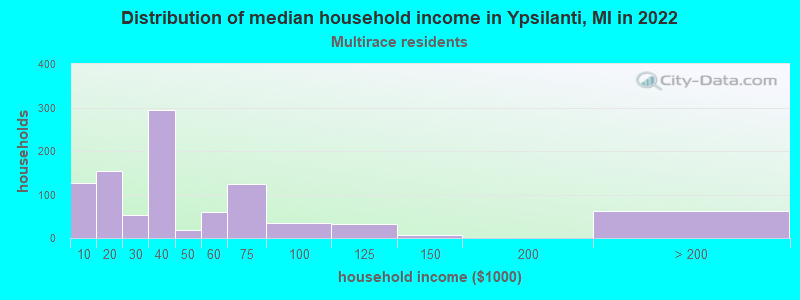
Income and house value in Ypsilanti Median household income in 2022 $49,046 White non-Hispanic householders$25,475 Black householders$46,840 Some other race householders$29,102 Two or more races householders$34,810 Hispanic or Latino race householdersMedian 2022 house value $242,879 White Non-Hispanic householders$153,951 Black or African American householders $258,944 Asian householders$247,087 Some other race householders$346,725 Two or more races householders$267,358 Hispanic or Latino householders
Median age by race in Ypsilanti
28.2 Median age for White residents28.5 26.3 27.6 Median age for Black or African American residents27.3 28.5 6.6 Median age for American Indian / Alaska Native residents5.6 -711,442,785.4 21.7 Median age for Asian residents22.4 20.3 12.5 Median age for Native Hawaiian / Pacific Islander residents-674,772,035.8 13.0 48.4 Median age for Other race residents45.8 59.3 24.0 Median age for Two or more races residents22.1 26.5 28.1 Median age for White alone residents28.7 26.2 25.0 Median age for Hispanic or Latino residents23.8 26.3
Owner/renter occupied households by race in Ypsilanti
House owners and renters - White residents 2,051 38.4% Owner occupied3,296 61.6% Renter occupiedHouse owners and renters - Black or African American residents 473 21.9% Owner occupied1,690 78.1% Renter occupiedHouse owners and renters - Asian residents 51 25.3% Owner occupied151 74.7% Renter occupiedHouse owners and renters - Native Hawaiian / Pacific Islander residents 14 100.0% Renter occupiedHouse owners and renters - Other race residents 45 33.9% Owner occupied87 66.1% Renter occupiedHouse owners and renters - Two or more races residents 282 27.8% Owner occupied732 72.2% Renter occupiedHouse owners and renters - White alone residents 2,041 38.8% Owner occupied3,221 61.2% Renter occupiedHouse owners and renters - Hispanic or Latino residents 86 22.8% Owner occupied293 77.2% Renter occupied
Language usage in Ypsilanti
English speakers - Total 85.8% of residents of Ypsilanti speak English at home.
3.8% of residents speak Spanish at home 575 78.0% Speak English very well162 22.0% Speak English less than very well10.3% of residents speak other language at home 1,383 69.9% Speak English very well595 30.1% Speak English less than very well
English speakers - Born in the United States 93.2% of residents of Ypsilanti speak English at home.
2.1% of residents speak Spanish at home 106 95.5% Speak English very well5 4.5% Speak English less than very well4.5% of residents speak other language at home 207 88.1% Speak English very well28 11.9% Speak English less than very well
English speakers - Native, born elsewhere 43.3% of residents of Ypsilanti speak English at home.
61.1% of residents speak Spanish at home 165 70.5% Speak English very well69 29.5% Speak English less than very well14.9% of residents speak other language at home 57 100.0% Speak English very well
English speakers - Foreign-born 16.6% of residents of Ypsilanti speak English at home.
8.1% of residents speak Spanish at home 43 28.1% Speak English very well110 71.9% Speak English less than very well75.5% of residents speak other language at home 868 61.1% Speak English very well552 38.9% Speak English less than very well
White (Caucasian) - Speak only English Native:
96.6% (10,325)Foreign-born:
21.8% (169)
White (Caucasian) - Speak another language Native:
3.4% (362)Foreign-born:
78.6% (607)
Black or African American - Speak only English Native:
99.3% (4,116)Foreign-born:
55.5% (122)
Black or African American - Speak another language Native:
1.1% (44)Foreign-born:
47.5% (104)
Asian - Speak only English Native:
32.1% (149)Foreign-born:
7.4% (42)
Asian - Speak another language Native:
70.6% (327)Foreign-born:
94.7% (545)
Other race - Speak another language Native:
13.9% (19)Foreign-born:
100.0% (130)
Two or more races - Speak only English Native:
77.7% (1,454)Foreign-born:
3.3% (5)
Two or more races - Speak another language Native:
25.5% (477)Foreign-born:
97.2% (162)
White alone - Speak only English Native:
97.9% (10,158)Foreign-born:
19.3% (159)
White alone - Speak another language Native:
2.0% (211)Foreign-born:
83.1% (687)
Hispanic or Latino - Speak only English Native:
58.0% (610)Foreign-born:
7.3% (12)
Hispanic or Latino - Speak another language Native:
42.7% (449)Foreign-born:
92.0% (155)
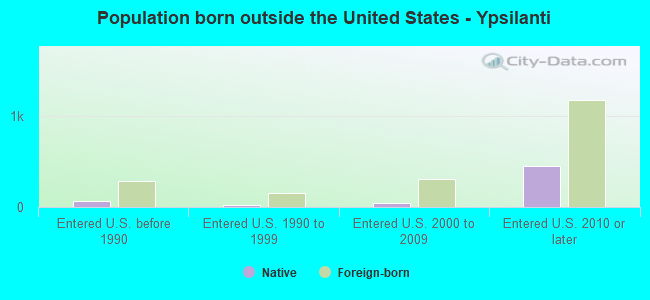
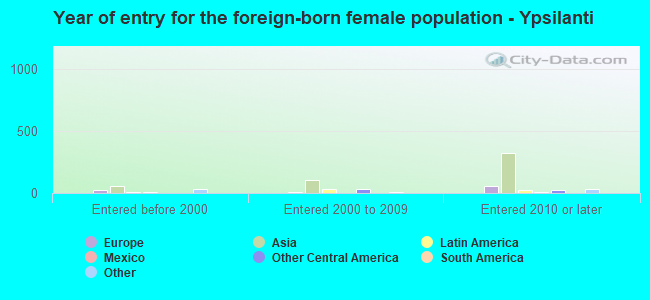
Foreign-born residents in Ypsilanti 1,985 residents are foreign born (6.1% Asia , 1.1% Europe , 1.1% Africa ).
This city:
9.9%Michigan:
6.9%
Marital status for residents in Ypsilanti Marital status - White (Caucasian) population 15 years and over
Males 68.1% Never married24.0% Now married0.6% Separated1.7% Widowed5.6% DivorcedFemales 65.4% Never married24.1% Now married1.0% Separated2.6% Widowed6.9% DivorcedWomen who gave birth in the past 12 months Now married:
38.8% (52)Unmarried:
61.2% (82)
Women who did not give birth in the past 12 months Now married:
18.9% (728)Unmarried:
81.1% (3,124)
Marital status - Black or African American population 15 years and over
Males 72.9% Never married14.5% Now married3.0% Separated2.5% Widowed7.0% DivorcedFemales 64.2% Never married11.8% Now married1.0% Separated4.4% Widowed18.6% DivorcedWomen who gave birth in the past 12 months Now married:
0.0% (0)Unmarried:
100.0% (58)
Women who did not give birth in the past 12 months Now married:
6.0% (83)Unmarried:
94.0% (1,294)
Marital status - Asian population 15 years and over
Males 71.5% Never married18.0% Now married9.2% Separated0.0% Widowed1.3% DivorcedFemales 70.5% Never married25.1% Now married0.0% Separated3.0% Widowed1.4% DivorcedWomen who did not give birth in the past 12 months Now married:
14.8% (52)Unmarried:
85.2% (301)
Marital status - Other race population 15 years and over
Males 26.5% Never married51.8% Now married0.0% Separated0.0% Widowed21.7% DivorcedFemales 38.0% Never married28.9% Now married9.1% Separated0.0% Widowed24.0% DivorcedWomen who did not give birth in the past 12 months Now married:
11.1% (7)Unmarried:
88.9% (57)
Marital status - Two or more races population 15 years and over
Males 66.4% Never married29.2% Now married0.0% Separated0.0% Widowed4.4% DivorcedFemales 70.8% Never married22.6% Now married0.0% Separated1.1% Widowed5.5% DivorcedWomen who gave birth in the past 12 months Now married:
2.6% (1)Unmarried:
97.4% (48)
Women who did not give birth in the past 12 months Now married:
15.9% (135)Unmarried:
84.1% (716)
Marital status - White alone, not Hispanic / Latino population 15 years and over
Males 68.3% Never married24.1% Now married0.6% Separated1.3% Widowed5.7% DivorcedFemales 64.2% Never married25.0% Now married1.1% Separated2.6% Widowed7.2% DivorcedWomen who gave birth in the past 12 months Now married:
38.8% (53)Unmarried:
61.2% (83)
Women who did not give birth in the past 12 months Now married:
19.9% (734)Unmarried:
80.1% (2,948)
Marital status - Hispanic or Latino population 15 years and over
Males 46.7% Never married41.7% Now married0.0% Separated6.8% Widowed4.8% DivorcedFemales 80.2% Never married14.6% Now married0.0% Separated1.5% Widowed3.7% DivorcedWomen who gave birth in the past 12 months Now married:
12.5% (1)Unmarried:
87.5% (7)
Women who did not give birth in the past 12 months Now married:
4.9% (23)Unmarried:
95.1% (458)
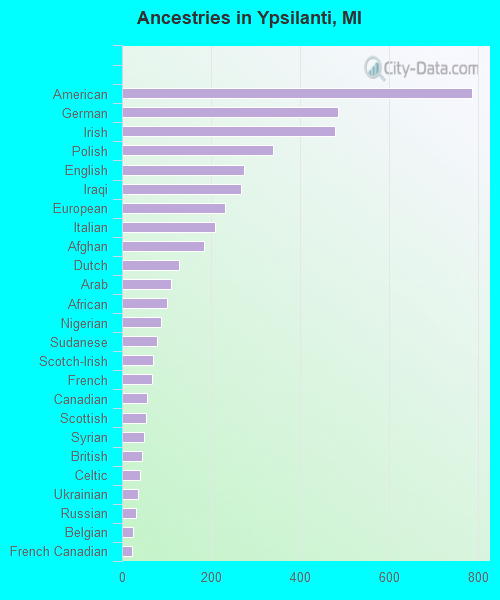
Ancestries in Ypsilanti
785 8.6% American484 5.3% German478 5.2% Irish340 3.7% Polish274 3.0% English267 2.9% Iraqi231 2.5% European209 2.3% Italian184 2.0% Afghan129 1.4% Dutch109 1.2% Arab102 1.1% African88 1.0% Nigerian78 0.9% Sudanese70 0.8% Scotch-Irish67 0.7% French56 0.6% Canadian54 0.6% Scottish50 0.5% Syrian44 0.5% British41 0.4% Celtic35 0.4% Ukrainian31 0.3% Russian24 0.3% Belgian23 0.3% French Canadian18 0.2% Norwegian14 0.2% Swedish13 0.1% Lebanese13 0.1% Greek12 0.1% Hungarian12 0.1% Finnish10 0.1% Scandinavian10 0.1% Latvian9 0.10% Moroccan8 0.09% Eastern European8 0.09% Ethiopian7 0.08% Iranian7 0.08% Haitian6 0.07% Danish6 0.07% Serbian6 0.07% Czech6 0.07% West Indian3 0.03% Romanian2 0.02% Slovak2 0.02% Northern European2 0.02% Swiss2 0.02% Austrian
Geographical mobility in Ypsilanti Same house 1 year ago 7,369 62.5% White (Caucasian)3,692 80.7% Black or African American22 100.0% American Indian / Alaska Native536 52.3% Asian49 100.0% Native Hawaiian / Pacific Islander231 88.9% Other race1,674 76.5% Two or more races7,219 62.7% White alone, not Hispanic / Latino1,062 82.3% Hispanic or LatinoMoved within same county 2,142 18.2% White / Caucasian581 12.7% Black or African American82 8.0% Asian15 5.9% Other race289 13.2% Two or more races2,101 18.2% White alone, not Hispanic / Latino141 11.0% Hispanic or LatinoMoved within same state 1,360 11.5% White / Caucasian116 2.5% Black or African American262 25.5% Asian8 3.1% Other race197 9.0% Two or more races1,332 11.6% White alone, not Hispanic / Latino24 1.9% Hispanic or LatinoMoved from different state 872 7.4% White / Caucasian175 3.8% Black or African American156 15.2% Asian5 2.0% Other race36 1.7% Two or more races875 7.6% White alone, not Hispanic / Latino22 1.7% Hispanic or LatinoMoved from abroad 132 1.1% White8 0.2% Black or African American7 0.7% Asian90 0.8% White alone, not Hispanic / Latino49 3.8% Hispanic or Latino
Children Nativity (place of birth) in Ypsilanti
Children under 6 years - Living with two parents Both parents native 396 100.0% NativeBoth parents foreign-born 63 100.0% NativeOne native, one foreign-born parent 11 100.0% NativeChildren under 6 years - Living with one parent Native parent 743 100.0% NativeForeign-born parent 8 100.0% NativeChildren 6 to 17 years - Living with two parents Both parents native 468 90.8% Native47 9.2% Foreign-bornBoth parents foreign-born 54 26.1% Native153 73.9% Foreign-bornOne native, one foreign-born parent 19 100.0% NativeChildren 6 to 17 years - Living with one parent Native parent 995 100.0% Native
Grandparents responsible for own grandchildren in Ypsilanti
Grandparents (30 to 59 years) White / Caucasian 14 100.0% Not responsible for grandchildrenBlack or African American 6 31.8% Responsible for grandchildren13 68.2% Not responsible for grandchildrenAsian 6 100.0% Not responsible for grandchildrenWhite alone, not Hispanic / Latino 14 100.0% Not responsible for grandchildrenGrandparents (60 years and over) White / Caucasian 5 67.6% Responsible for grandchildren2 32.4% Not responsible for grandchildrenBlack or African American 3 20.9% Responsible for grandchildren10 79.1% Not responsible for grandchildrenWhite alone, not Hispanic / Latino 5 80.9% Responsible for grandchildren1 19.1% Not responsible for grandchildren