Races in Zionsville, Indiana (IN) Detailed Stats
Data:
Races - White alone (%)
Races - White alone (% change since 2000)
Races - Black alone (%)
Races - Black alone (% change since 2000)
Races - American Indian alone (%)
Races - American Indian alone (% change since 2000)
Races - Asian alone (%)
Races - Asian alone (% change since 2000)
Races - Hispanic (%)
Races - Hispanic (% change since 2000)
Races - Native Hawaiian and Other Pacific Islander alone (%)
Races - Native Hawaiian and Other Pacific Islander alone (% change since 2000)
Races - Two or more races(%)
Races - Two or more races(% change since 2000)
Races - Other race alone (%)
Races - Other race alone (% change since 2000)
Racial diversity
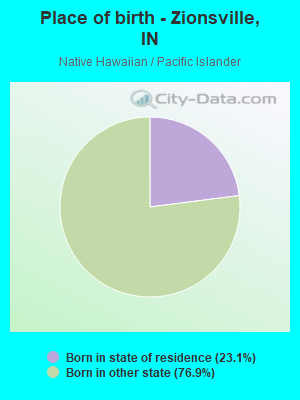
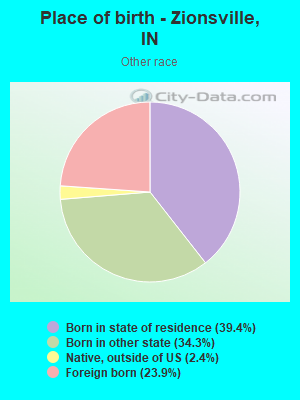
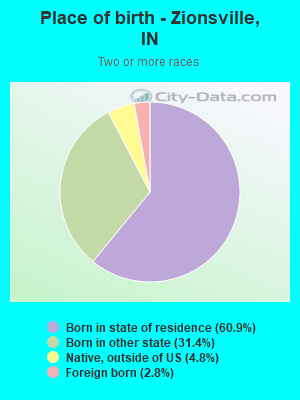
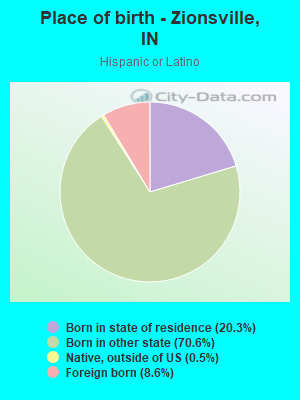
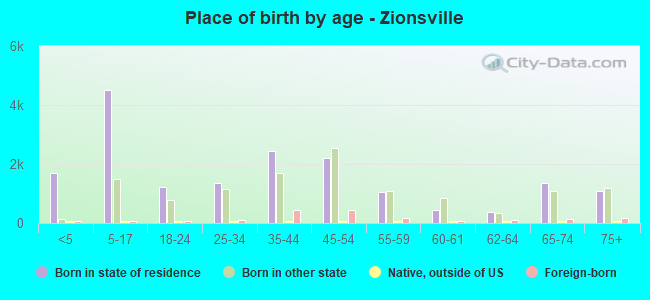
Place of birth - Born in state of residence (%)
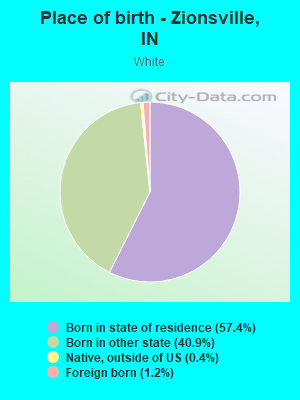
Place of birth - Born in state of residence (%) - White
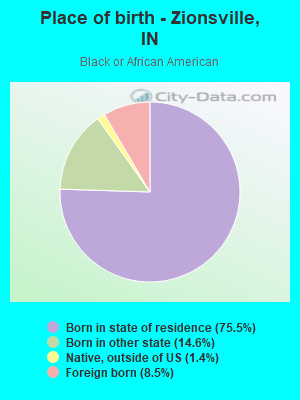
Place of birth - Born in state of residence (%) - Black or African American
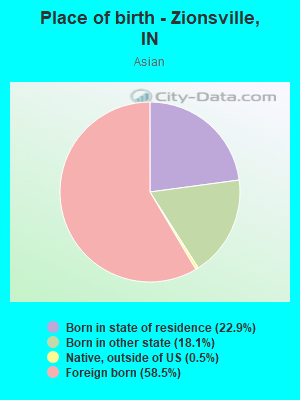
Place of birth - Born in state of residence (%) - Asian
Place of birth - Born in state of residence (%) - Hispanic or Latino
Place of birth - Born in state of residence (%) - American Indian and Alaska Native
Place of birth - Born in state of residence (%) - Multirace
Place of birth - Born in state of residence (%) - Other Race
Place of birth - Born in other state (%)
Place of birth - Born in other state (%) - White
Place of birth - Born in other state (%) - Black or African American
Place of birth - Born in other state (%) - Asian
Place of birth - Born in other state (%) - Hispanic or Latino
Place of birth - Born in other state (%) - American Indian and Alaska Native
Place of birth - Born in other state (%) - Multirace
Place of birth - Born in other state (%) - Other Race
Place of birth - Native, outside of US (%)
Place of birth - Native, outside of US (%) - White
Place of birth - Native, outside of US (%) - Black or African American
Place of birth - Native, outside of US (%) - Asian
Place of birth - Native, outside of US (%) - Hispanic or Latino
Place of birth - Native, outside of US (%) - American Indian and Alaska Native
Place of birth - Native, outside of US (%) - Multirace
Place of birth - Native, outside of US (%) - Other Race
Place of birth - Foreign born (%)
Place of birth - Foreign born (%) - White
Place of birth - Foreign born (%) - Black or African American
Place of birth - Foreign born (%) - Asian
Place of birth - Foreign born (%) - Hispanic or Latino
Place of birth - Foreign born (%) - American Indian and Alaska Native
Place of birth - Foreign born (%) - Multirace
Place of birth - Foreign born (%) - Other Race
Residents speaking English at home (%)
Residents speaking English at home - Born in the United States (%)
Residents speaking English at home - Native, born elsewhere (%)
Residents speaking English at home - Foreign born (%)
Residents speaking Spanish at home (%)
Residents speaking Spanish at home - Born in the United States (%)
Residents speaking Spanish at home - Native, born elsewhere (%)
Residents speaking Spanish at home - Foreign born (%)
Residents speaking other language at home (%)
Residents speaking other language at home - Born in the United States (%)
Residents speaking other language at home - Native, born elsewhere (%)
Residents speaking other language at home - Foreign born (%)
Marital status - Never married (%)
Marital status - Now married (%)
Marital status - Separated (%)
Marital status - Widowed (%)
Marital status - Divorced (%)
Ancestries Reported - Arab (%)
Ancestries Reported - Czech (%)
Ancestries Reported - Danish (%)
Ancestries Reported - Dutch (%)
Ancestries Reported - English (%)
Ancestries Reported - French (%)
Ancestries Reported - French Canadian (%)
Ancestries Reported - German (%)
Ancestries Reported - Greek (%)
Ancestries Reported - Hungarian (%)
Ancestries Reported - Irish (%)
Ancestries Reported - Italian (%)
Ancestries Reported - Lithuanian (%)
Ancestries Reported - Norwegian (%)
Ancestries Reported - Polish (%)
Ancestries Reported - Portuguese (%)
Ancestries Reported - Russian (%)
Ancestries Reported - Scotch-Irish (%)
Ancestries Reported - Scottish (%)
Ancestries Reported - Slovak (%)
Ancestries Reported - Subsaharan African (%)
Ancestries Reported - Swedish (%)
Ancestries Reported - Swiss (%)
Ancestries Reported - Ukrainian (%)
Ancestries Reported - United States (%)
Ancestries Reported - Welsh (%)
Ancestries Reported - West Indian (%)
Ancestries Reported - Other (%)
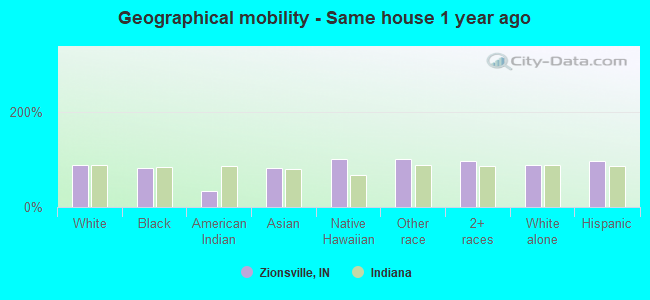
Geographical mobility - Same house 1 year ago (%)
Geographical mobility - Same house 1 year ago (%) - White
Geographical mobility - Same house 1 year ago (%) - Black or African American
Geographical mobility - Same house 1 year ago (%) - Asian
Geographical mobility - Same house 1 year ago (%) - Hispanic or Latino
Geographical mobility - Same house 1 year ago (%) - American Indian and Alaska Native
Geographical mobility - Same house 1 year ago (%) - Multirace
Geographical mobility - Same house 1 year ago (%) - Other Race
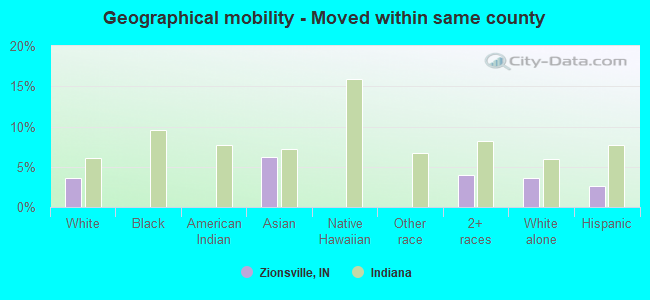
Geographical mobility - Moved within same county (%)
Geographical mobility - Moved within same county (%) - White
Geographical mobility - Moved within same county (%) - Black or African American
Geographical mobility - Moved within same county (%) - Asian
Geographical mobility - Moved within same county (%) - Hispanic or Latino
Geographical mobility - Moved within same county (%) - American Indian and Alaska Native
Geographical mobility - Moved within same county (%) - Multirace
Geographical mobility - Moved within same county (%) - Other Race
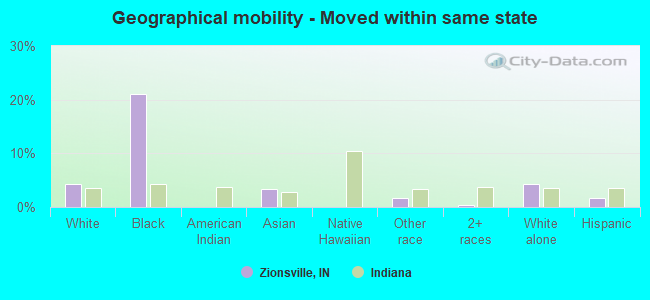
Geographical mobility - Moved from different county within same state (%)
Geographical mobility - Moved from different county within same state (%) - White
Geographical mobility - Moved from different county within same state (%) - Black or African American
Geographical mobility - Moved from different county within same state (%) - Asian
Geographical mobility - Moved from different county within same state (%) - Hispanic or Latino
Geographical mobility - Moved from different county within same state (%) - American Indian and Alaska Native
Geographical mobility - Moved from different county within same state (%) - Multirace
Geographical mobility - Moved from different county within same state (%) - Other Race
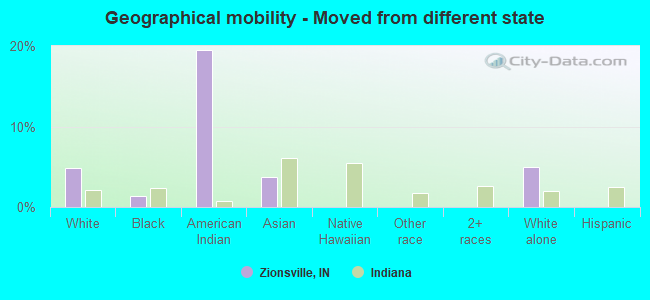
Geographical mobility - Moved from different state (%)
Geographical mobility - Moved from different state (%) - White
Geographical mobility - Moved from different state (%) - Black or African American
Geographical mobility - Moved from different state (%) - Asian
Geographical mobility - Moved from different state (%) - Hispanic or Latino
Geographical mobility - Moved from different state (%) - American Indian and Alaska Native
Geographical mobility - Moved from different state (%) - Multirace
Geographical mobility - Moved from different state (%) - Other Race
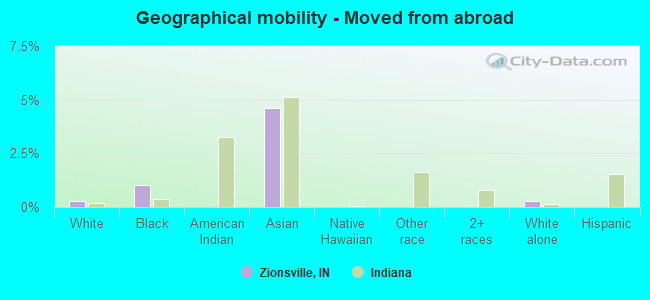
Geographical mobility - Moved from abroad (%)
Geographical mobility - Moved from abroad (%) - White
Geographical mobility - Moved from abroad (%) - Black or African American
Geographical mobility - Moved from abroad (%) - Asian
Geographical mobility - Moved from abroad (%) - Hispanic or Latino
Geographical mobility - Moved from abroad (%) - American Indian and Alaska Native
Geographical mobility - Moved from abroad (%) - Multirace
Geographical mobility - Moved from abroad (%) - Other Race
Place of birth for the foreign-born population - Ireland (%)
Place of birth for the foreign-born population - Denmark (%)
Place of birth for the foreign-born population - Norway (%)
Place of birth for the foreign-born population - Sweden (%)
Place of birth for the foreign-born population - United Kingdom (%)
Place of birth for the foreign-born population - England (%)
Place of birth for the foreign-born population - Scotland (%)
Place of birth for the foreign-born population - Other Northern Europe (%)
Place of birth for the foreign-born population - Austria (%)
Place of birth for the foreign-born population - Belgium (%)
Place of birth for the foreign-born population - France (%)
Place of birth for the foreign-born population - Germany (%)
Place of birth for the foreign-born population - Netherlands (%)
Place of birth for the foreign-born population - Switzerland (%)
Place of birth for the foreign-born population - Other Western Europe (%)
Place of birth for the foreign-born population - Greece (%)
Place of birth for the foreign-born population - Italy (%)
Place of birth for the foreign-born population - Portugal (%)
Place of birth for the foreign-born population - Spain (%)
Place of birth for the foreign-born population - Other Southern Europe (%)
Place of birth for the foreign-born population - Albania (%)
Place of birth for the foreign-born population - Belarus (%)
Place of birth for the foreign-born population - Bosnia and Herzegovina (%)
Place of birth for the foreign-born population - Bulgaria (%)
Place of birth for the foreign-born population - Croatia (%)
Place of birth for the foreign-born population - Czechoslovakia (%)
Place of birth for the foreign-born population - Hungary (%)
Place of birth for the foreign-born population - Latvia (%)
Place of birth for the foreign-born population - Lithuania (%)
Place of birth for the foreign-born population - North Macedonia (Macedonia) (%)
Place of birth for the foreign-born population - Moldova (%)
Place of birth for the foreign-born population - Poland (%)
Place of birth for the foreign-born population - Romania (%)
Place of birth for the foreign-born population - Russia (%)
Place of birth for the foreign-born population - Serbia (%)
Place of birth for the foreign-born population - Ukraine (%)
Place of birth for the foreign-born population - Other Eastern Europe (%)
Place of birth for the foreign-born population - China (%)
Place of birth for the foreign-born population - Hong Kong (%)
Place of birth for the foreign-born population - Taiwan (%)
Place of birth for the foreign-born population - Japan (%)
Place of birth for the foreign-born population - Korea (%)
Place of birth for the foreign-born population - Other Eastern Asia (%)
Place of birth for the foreign-born population - Afghanistan (%)
Place of birth for the foreign-born population - Bangladesh (%)
Place of birth for the foreign-born population - India (%)
Place of birth for the foreign-born population - Iran (%)
Place of birth for the foreign-born population - Kazakhstan (%)
Place of birth for the foreign-born population - Nepal (%)
Place of birth for the foreign-born population - Pakistan (%)
Place of birth for the foreign-born population - Sri Lanka (%)
Place of birth for the foreign-born population - Uzbekistan (%)
Place of birth for the foreign-born population - Other South Central Asia (%)
Place of birth for the foreign-born population - Burma (%)
Place of birth for the foreign-born population - Cambodia (%)
Place of birth for the foreign-born population - Indonesia (%)
Place of birth for the foreign-born population - Laos (%)
Place of birth for the foreign-born population - Malaysia (%)
Place of birth for the foreign-born population - Philippines (%)
Place of birth for the foreign-born population - Singapore (%)
Place of birth for the foreign-born population - Thailand (%)
Place of birth for the foreign-born population - Vietnam (%)
Place of birth for the foreign-born population - Other South Eastern Asia (%)
Place of birth for the foreign-born population - Armenia (%)
Place of birth for the foreign-born population - Iraq (%)
Place of birth for the foreign-born population - Israel (%)
Place of birth for the foreign-born population - Jordan (%)
Place of birth for the foreign-born population - Kuwait (%)
Place of birth for the foreign-born population - Lebanon (%)
Place of birth for the foreign-born population - Saudi Arabia (%)
Place of birth for the foreign-born population - Syria (%)
Place of birth for the foreign-born population - Turkey (%)
Place of birth for the foreign-born population - Yemen (%)
Place of birth for the foreign-born population - Other Western Asia (%)
Place of birth for the foreign-born population - Eritrea (%)
Place of birth for the foreign-born population - Ethiopia (%)
Place of birth for the foreign-born population - Kenya (%)
Place of birth for the foreign-born population - Somalia (%)
Place of birth for the foreign-born population - Uganda (%)
Place of birth for the foreign-born population - Zimbabwe (%)
Place of birth for the foreign-born population - Other Eastern Africa (%)
Place of birth for the foreign-born population - Cameroon (%)
Place of birth for the foreign-born population - Congo (%)
Place of birth for the foreign-born population - Democratic Republic of Congo (Zaire) (%)
Place of birth for the foreign-born population - Other Middle Africa (%)
Place of birth for the foreign-born population - Egypt (%)
Place of birth for the foreign-born population - Morocco (%)
Place of birth for the foreign-born population - Sudan (%)
Place of birth for the foreign-born population - Other Northern Africa (%)
Place of birth for the foreign-born population - South Africa (%)
Place of birth for the foreign-born population - Other Southern Africa (%)
Place of birth for the foreign-born population - Cabo Verde (%)
Place of birth for the foreign-born population - Ghana (%)
Place of birth for the foreign-born population - Liberia (%)
Place of birth for the foreign-born population - Nigeria (%)
Place of birth for the foreign-born population - Senegal (%)
Place of birth for the foreign-born population - Sierra Leone (%)
Place of birth for the foreign-born population - Other Western Africa (%)
Place of birth for the foreign-born population - Australia (%)
Place of birth for the foreign-born population - New Zealand (%)
Place of birth for the foreign-born population - Fiji (%)
Place of birth for the foreign-born population - Micronesia (%)
Place of birth for the foreign-born population - Bahamas (%)
Place of birth for the foreign-born population - Barbados (%)
Place of birth for the foreign-born population - Cuba (%)
Place of birth for the foreign-born population - Dominica (%)
Place of birth for the foreign-born population - Dominican Republic (%)
Place of birth for the foreign-born population - Grenada (%)
Place of birth for the foreign-born population - Haiti (%)
Place of birth for the foreign-born population - Jamaica (%)
Place of birth for the foreign-born population - St. Vincent and the Grenadines (%)
Place of birth for the foreign-born population - Trinidad and Tobago (%)
Place of birth for the foreign-born population - West Indies (%)
Place of birth for the foreign-born population - Other Caribbean (%)
Place of birth for the foreign-born population - Belize (%)
Place of birth for the foreign-born population - Costa Rica (%)
Place of birth for the foreign-born population - El Salvador (%)
Place of birth for the foreign-born population - Guatemala (%)
Place of birth for the foreign-born population - Honduras (%)
Place of birth for the foreign-born population - Mexico (%)
Place of birth for the foreign-born population - Nicaragua (%)
Place of birth for the foreign-born population - Panama (%)
Place of birth for the foreign-born population - Other Central America (%)
Place of birth for the foreign-born population - Argentina (%)
Place of birth for the foreign-born population - Bolivia (%)
Place of birth for the foreign-born population - Brazil (%)
Place of birth for the foreign-born population - Chile (%)
Place of birth for the foreign-born population - Colombia (%)
Place of birth for the foreign-born population - Ecuador (%)
Place of birth for the foreign-born population - Guyana (%)
Place of birth for the foreign-born population - Peru (%)
Place of birth for the foreign-born population - Uruguay (%)
Place of birth for the foreign-born population - Venezuela (%)
Place of birth for the foreign-born population - Other South America (%)
Place of birth for the foreign-born population - Canada (%)
Place of birth for the foreign-born population - Other Northern America (%)
Place of birth for the foreign-born population - Other (%)
Latest news about races in Zionsville, IN collected exclusively by city-data.com from local newspapers, TV, and radio stations
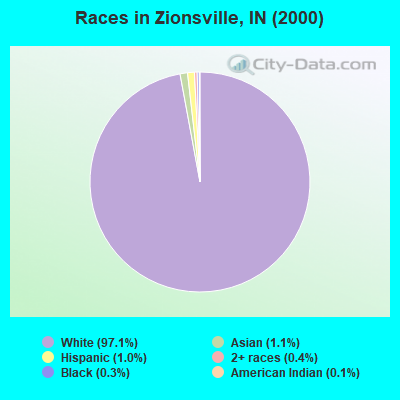
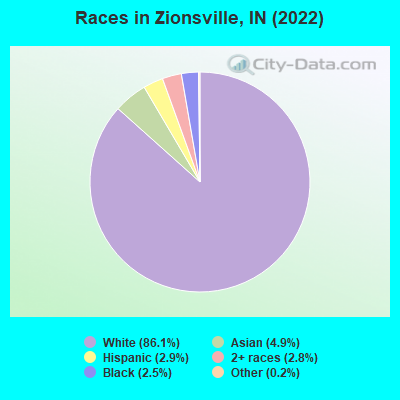
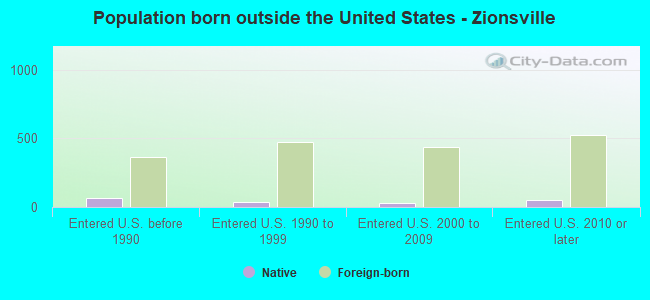
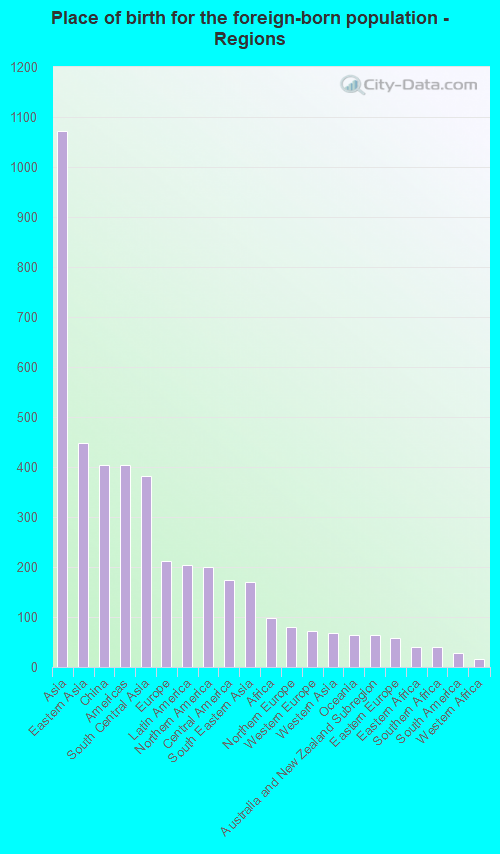
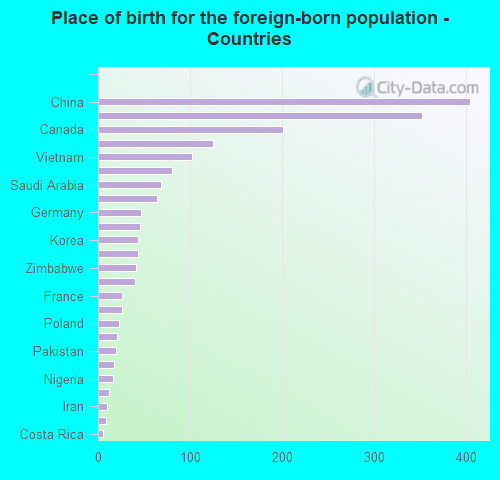
According to 2022 data, the most numerous races in Zionsville, IN are White alone (26,747 residents), Black alone (791 residents), and Hispanic (897 residents). 92.4% of Zionsville residents speak English at home. 5.8% of Zionsville, IN residents are foreign-born (3.2% born in Asia, 0.6% born in Europe, 0.6% born in Latin America, 0.6% born in North America), which is 3.8% less than the foreign-born rate of 6.0% across the entire state of Indiana.
Race distribution in Zionsville
2000 2022
5,219,373 85.8% White alone 505,462 8.3% Black alone 214,536 3.5% Hispanic 61,115 1.0% Two or more races 58,424 1.0% Asian alone 13,654 0.2% American Indian alone 6,348 0.1% Other race alone 1,573 0.03% Native Hawaiian and Other
5,192,455 76.0% White alone 628,054 9.2% Black alone 534,528 7.8% Hispanic 263,242 3.9% Two or more races 172,880 2.5% Asian alone 33,467 0.5% Other race alone 5,866 0.09% American Indian alone 2,545 0.04% Native Hawaiian and Other
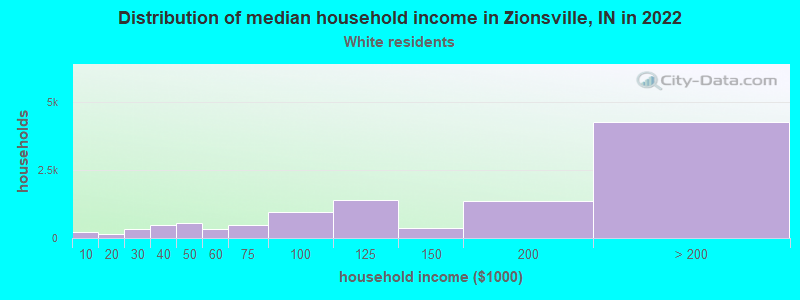
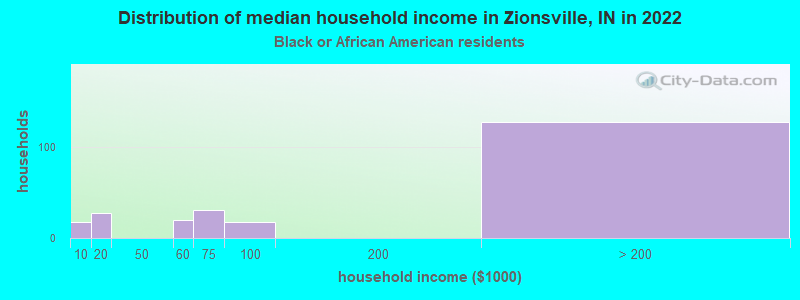
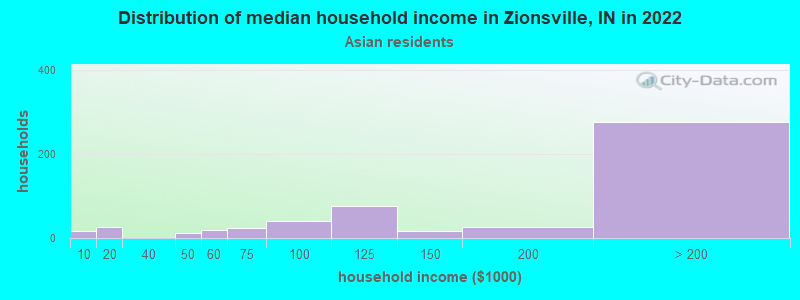
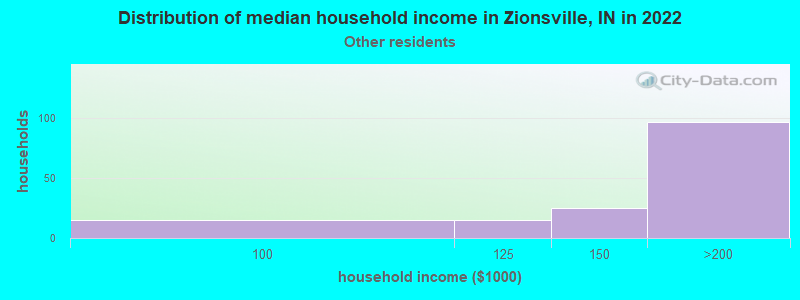
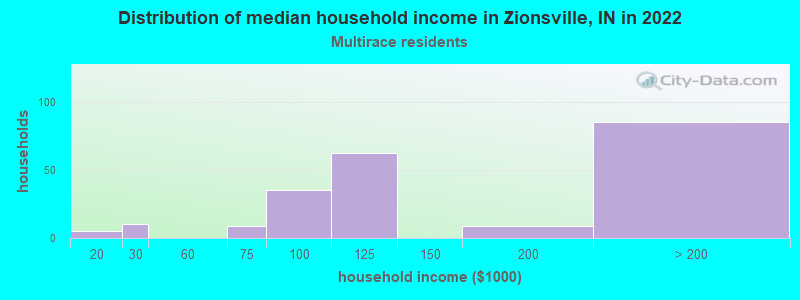
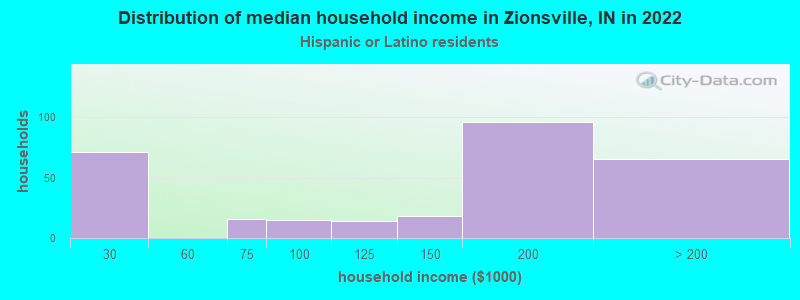
Income and house value in Zionsville Median household income in 2022 $149,779 White non-Hispanic householdersover $200,000 Black householdersover $200,000 Asian householders$168,056 Some other race householders$131,759 Hispanic or Latino race householdersMedian 2022 house value $574,461 White Non-Hispanic householders $315,827 Asian householders$258,404 Some other race householders$159,636 Two or more races householders
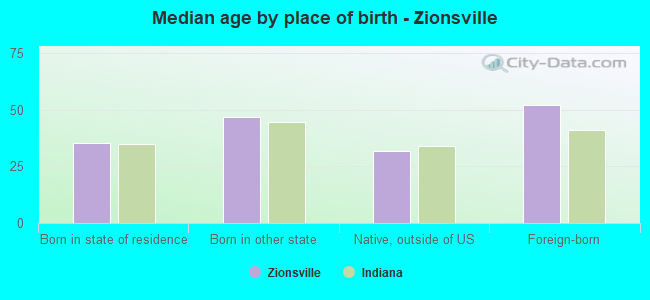
Median age by race in Zionsville
43.1 Median age for White residents41.0 44.6 40.7 Median age for Black or African American residents49.1 25.3 -558,797,523.8 Median age for American Indian / Alaska Native residents-666,666,666.0 -491,600,353.2 41.8 Median age for Asian residents37.1 40.3 43.4 Median age for Native Hawaiian / Pacific Islander residents-666,666,666.0 -666,666,666.0 48.8 Median age for Other race residents49.4 24.4 25.4 Median age for Two or more races residents23.1 38.8 43.4 Median age for White alone residents41.1 44.8 26.8 Median age for Hispanic or Latino residents23.9 27.6
Owner/renter occupied households by race in Zionsville
House owners and renters - White residents 9,579 88.1% Owner occupied1,296 11.9% Renter occupiedHouse owners and renters - Black or African American residents 117 42.8% Owner occupied156 57.2% Renter occupiedHouse owners and renters - American Indian / Alaska Native residents 21 100.0% Renter occupiedHouse owners and renters - Asian residents 556 75.6% Owner occupied180 24.4% Renter occupiedHouse owners and renters - Native Hawaiian / Pacific Islander residents 9 100.0% Owner occupiedHouse owners and renters - Other race residents 157 100.0% Owner occupiedHouse owners and renters - Two or more races residents 162 64.0% Owner occupied91 36.0% Renter occupiedHouse owners and renters - White alone residents 9,425 87.8% Owner occupied1,314 12.2% Renter occupiedHouse owners and renters - Hispanic or Latino residents 217 92.5% Owner occupied18 7.5% Renter occupied
Language usage in Zionsville
English speakers - Total 92.4% of residents of Zionsville speak English at home.
2.5% of residents speak Spanish at home 637 86.7% Speak English very well98 13.3% Speak English less than very well4.9% of residents speak other language at home 910 63.9% Speak English very well515 36.1% Speak English less than very well
English speakers - Born in the United States 96.0% of residents of Zionsville speak English at home.
3.0% of residents speak Spanish at home 330 100.0% Speak English very well0.8% of residents speak other language at home 94 100.0% Speak English very well
English speakers - Native, born elsewhere 86.7% of residents of Zionsville speak English at home.
5.6% of residents speak Spanish at home 10 100.0% Speak English very well8.9% of residents speak other language at home 16 100.0% Speak English very well
English speakers - Foreign-born 30.7% of residents of Zionsville speak English at home.
9.6% of residents speak Spanish at home 124 69.7% Speak English very well54 30.3% Speak English less than very well59.0% of residents speak other language at home 583 53.1% Speak English very well515 46.9% Speak English less than very well
White (Caucasian) - Speak only English Native:
98.9% (24,495)Foreign-born:
79.5% (320)
White (Caucasian) - Speak another language Native:
1.2% (298)Foreign-born:
29.6% (119)
Black or African American - Speak only English Native:
93.9% (609)Foreign-born:
68.2% (55)
Asian - Speak only English Native:
77.6% (535)Foreign-born:
14.9% (166)
Asian - Speak another language Native:
21.8% (150)Foreign-born:
85.8% (955)
Other race - Speak another language Native:
50.3% (137)Foreign-born:
97.7% (106)
Two or more races - Speak another language Native:
36.9% (375)Foreign-born:
99.0% (61)
White alone - Speak only English Native:
98.7% (24,385)Foreign-born:
68.4% (343)
White alone - Speak another language Native:
1.3% (319)Foreign-born:
28.0% (140)
Hispanic or Latino - Speak only English Native:
65.3% (415)Foreign-born:
7.8% (16)
Hispanic or Latino - Speak another language Native:
34.1% (217)Foreign-born:
92.0% (188)
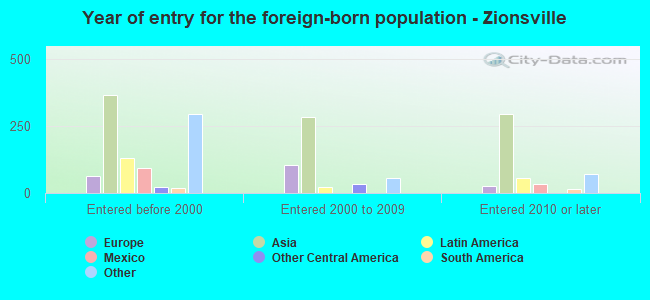
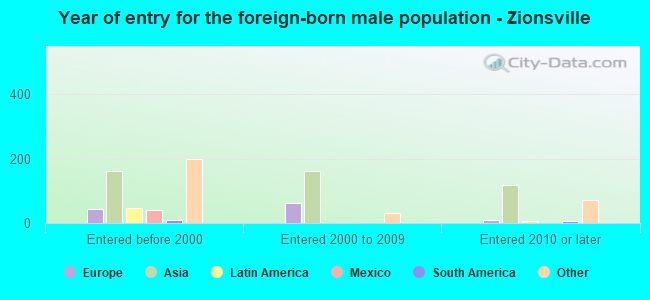
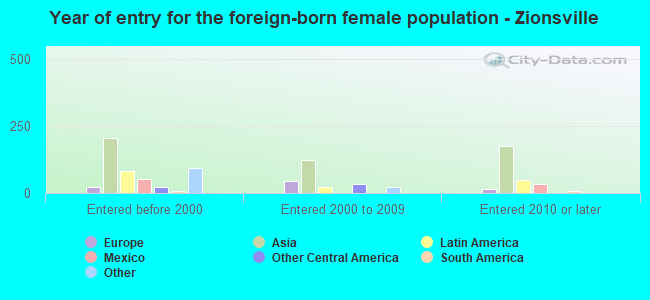
Foreign-born residents in Zionsville 1,855 residents are foreign born (3.2% Asia , 0.6% Europe , 0.6% Latin America , 0.6% North America ).
This city:
5.8%Indiana:
5.6%
Marital status for residents in Zionsville Marital status - White (Caucasian) population 15 years and over
Males 20.1% Never married72.5% Now married0.3% Separated1.6% Widowed5.5% DivorcedFemales 15.4% Never married71.6% Now married1.2% Separated6.0% Widowed5.8% DivorcedWomen who gave birth in the past 12 months Now married:
100.0% (312)Unmarried:
0.0% (0)
Women who did not give birth in the past 12 months Now married:
65.9% (3,653)Unmarried:
34.1% (1,889)
Marital status - Black or African American population 15 years and over
Males 35.1% Never married59.6% Now married0.0% Separated0.0% Widowed5.3% DivorcedFemales 28.4% Never married38.3% Now married0.0% Separated9.3% Widowed24.0% DivorcedWomen who did not give birth in the past 12 months Now married:
19.8% (42)Unmarried:
80.2% (169)
Marital status - Asian population 15 years and over
Males 20.5% Never married79.5% Now married0.0% Separated0.0% Widowed0.0% DivorcedFemales 12.9% Never married82.0% Now married0.0% Separated2.1% Widowed3.0% DivorcedWomen who did not give birth in the past 12 months Now married:
73.8% (296)Unmarried:
26.2% (105)
Marital status - Native Hawaiian / Pacific Islander population 15 years and over
Males 100.0% Never married0.0% Now married0.0% Separated0.0% Widowed0.0% DivorcedFemales 100.0% Never married0.0% Now married0.0% Separated0.0% Widowed0.0% DivorcedWomen who did not give birth in the past 12 months Now married:
0.0% (0)Unmarried:
100.0% (8)
Marital status - Other race population 15 years and over
Males 0.0% Never married100.0% Now married0.0% Separated0.0% Widowed0.0% DivorcedFemales 30.9% Never married69.1% Now married0.0% Separated0.0% Widowed0.0% DivorcedWomen who gave birth in the past 12 months Now married:
100.0% (11)Unmarried:
0.0% (0)
Women who did not give birth in the past 12 months Now married:
60.4% (70)Unmarried:
39.6% (46)
Marital status - Two or more races population 15 years and over
Males 64.4% Never married35.6% Now married0.0% Separated0.0% Widowed0.0% DivorcedFemales 30.7% Never married52.8% Now married0.0% Separated5.0% Widowed11.5% DivorcedWomen who did not give birth in the past 12 months Now married:
50.0% (126)Unmarried:
50.0% (126)
Marital status - White alone, not Hispanic / Latino population 15 years and over
Males 20.3% Never married72.3% Now married0.3% Separated1.6% Widowed5.5% DivorcedFemales 15.0% Never married72.0% Now married1.2% Separated6.1% Widowed5.8% DivorcedWomen who gave birth in the past 12 months Now married:
100.0% (308)Unmarried:
0.0% (0)
Women who did not give birth in the past 12 months Now married:
66.9% (3,610)Unmarried:
33.1% (1,784)
Marital status - Hispanic or Latino population 15 years and over
Males 5.7% Never married94.3% Now married0.0% Separated0.0% Widowed0.0% DivorcedFemales 34.9% Never married56.5% Now married0.0% Separated5.1% Widowed3.6% DivorcedWomen who gave birth in the past 12 months Now married:
100.0% (10)Unmarried:
0.0% (0)
Women who did not give birth in the past 12 months Now married:
38.5% (96)Unmarried:
61.5% (152)
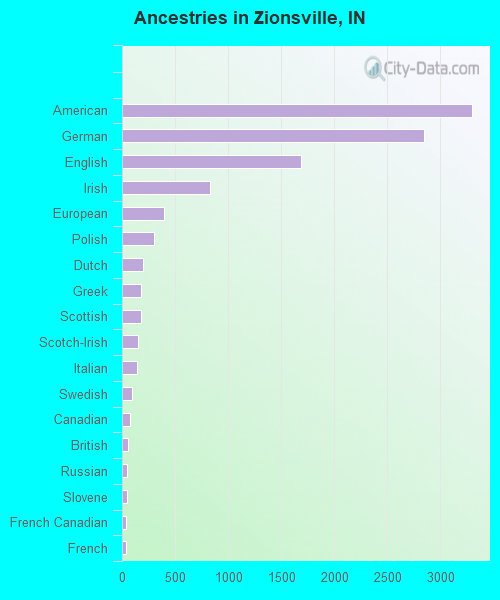
Ancestries in Zionsville
3,293 24.6% American2,845 21.3% German1,690 12.6% English825 6.2% Irish392 2.9% European304 2.3% Polish200 1.5% Dutch180 1.3% Greek176 1.3% Scottish151 1.1% Scotch-Irish142 1.1% Italian96 0.7% Swedish74 0.6% Canadian57 0.4% British47 0.4% Russian43 0.3% Slovene41 0.3% French Canadian38 0.3% French25 0.2% Finnish25 0.2% Nigerian24 0.2% Czechoslovakian24 0.2% Welsh17 0.1% Hungarian16 0.1% Norwegian15 0.1% Scandinavian14 0.1% Zimbabwean13 0.10% Northern European10 0.07% Iranian8 0.06% Swiss7 0.05% Slavic5 0.04% Belgian
Geographical mobility in Zionsville Same house 1 year ago 23,981 87.4% White (Caucasian)646 81.3% Black or African American12 33.9% American Indian / Alaska Native1,245 81.7% Asian29 100.0% Native Hawaiian / Pacific Islander444 100.0% Other race1,074 95.8% Two or more races23,571 87.2% White alone, not Hispanic / Latino847 95.9% Hispanic or LatinoMoved within same county 976 3.6% White / Caucasian94 6.2% Asian44 4.0% Two or more races969 3.6% White alone, not Hispanic / Latino23 2.6% Hispanic or LatinoMoved within same state 1,155 4.2% White / Caucasian167 21.0% Black or African American51 3.3% Asian8 1.8% Other race5 0.5% Two or more races1,173 4.3% White alone, not Hispanic / Latino15 1.7% Hispanic or LatinoMoved from different state 1,341 4.9% White / Caucasian11 1.3% Black or African American7 19.5% American Indian / Alaska Native56 3.7% Asian1,341 5.0% White alone, not Hispanic / LatinoMoved from abroad 75 0.3% White8 1.0% Black or African American70 4.6% Asian75 0.3% White alone, not Hispanic / Latino
Children Nativity (place of birth) in Zionsville
Children under 6 years - Living with two parents Both parents native 2,072 100.0% NativeOne native, one foreign-born parent 274 100.0% NativeChildren under 6 years - Living with one parent Native parent 162 100.0% NativeChildren 6 to 17 years - Living with two parents Both parents native 4,268 99.8% Native10 0.2% Foreign-bornBoth parents foreign-born 119 63.1% Native70 36.9% Foreign-bornOne native, one foreign-born parent 548 100.0% NativeChildren 6 to 17 years - Living with one parent Native parent 576 100.0% NativeForeign-born parent 62 52.0% Native57 48.0% Foreign-born
Grandparents responsible for own grandchildren in Zionsville
Grandparents (30 to 59 years) White / Caucasian 23 100.0% Responsible for grandchildrenBlack or African American 66 100.0% Not responsible for grandchildrenWhite alone, not Hispanic / Latino 24 100.0% Responsible for grandchildrenGrandparents (60 years and over) White / Caucasian 28 39.9% Responsible for grandchildren43 60.1% Not responsible for grandchildrenBlack or African American 27 100.0% Not responsible for grandchildrenWhite alone, not Hispanic / Latino 29 39.7% Responsible for grandchildren43 60.3% Not responsible for grandchildren