Delaware
Political parties
The Democrats were firmly entrenched in Delaware for three decades after the Civil War; a subsequent period of Republican dominance lasted until the depression of the 1930s. Since then, the two parties have been relatively evenly matched.
In 2002 there were 522,768 registered voters; 42% were Democratic, 36% Republican, and 23% unaffiliated or members of other parties in 1998. In the 2000 election, Democrat Al Gore won the state with 55% of the vote, to Republican George W. Bush's 42%. Green Party candidate Ralph Nader won 3% of the vote. The state had three electoral votes in the 2000 presidential election. Democratic Senator Joseph Biden was the ranking member of the Senate Foreign Relations Committee in 2003. Democrat Tom Carper was elected Delaware's junior Senator in 2000, after having served two terms as state governor, and five terms in the US House of Representatives. Former two-term governor and Republican Michael Castle was reelected Delaware's House Representative in 2002.
Democratic Governor Ruth Ann Minner, elected in 2001, was the first woman to serve in a leadership position in Delaware's House of Representatives, the state's first female lieutenant governor and first female governor. In 2003, Republicans controlled the state house (29–12), and Democrats controlled the state senate (13–8).
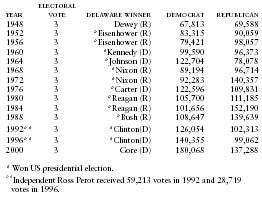
Delaware Presidential Vote by Major Political Parties, 1948–2000
| YEAR | ELECTORAL VOTE | DELAWARE WINNER | DEMOCRAT | REPUBLICAN |
| * Won US presidential election. | ||||
| **Independent Ross Perot received 59,213 votes in 1992 and 28,719 votes in 1996. | ||||
| 1948 | 3 | Dewey (R) | 67,813 | 69,588 |
| 1952 | 3 | *Eisenhower (R) | 83,315 | 90,059 |
| 1956 | 3 | *Eisenhower (R) | 79,421 | 98,057 |
| 1960 | 3 | *Kennedy (D) | 99,590 | 96,373 |
| 1964 | 3 | *Johnson (D) | 122,704 | 78,078 |
| 1968 | 3 | *Nixon (R) | 89,194 | 96,714 |
| 1972 | 3 | *Nixon (R) | 92,283 | 140,357 |
| 1976 | 3 | *Carter (D) | 122,596 | 109,831 |
| 1980 | 3 | *Reagan (R) | 105,700 | 111,185 |
| 1984 | 3 | *Reagan (R) | 101,656 | 152,190 |
| 1988 | 3 | *Bush (R) | 108,647 | 139,639 |
| 1992** | 3 | *Clinton(D) | 126,054 | 102,313 |
| 1996** | 3 | *Clinton(D) | 140,355 | 99,062 |
| 2000 | 3 | Gore (D) | 180,068 | 137,288 |