Indiana
Public finance
The State Budget Agency acts as watchdog over state financial affairs. The agency prepares the budget for the governor and presents it to the general assembly. The budget director, appointed by the governor, serves with four legislators (two from each house) on the state budget committee, which helps to prepare the budget. The state budget agency receives appropriations requests from the heads of state offices, estimates anticipated revenues for the biennium, and administers the budget. The fiscal year runs from 1 July to 30 June of the following year. Budgets are prepared for the biennium beginning and ending in odd-numbered years.
In the economic recession of 2001, and the slowdowns of 2002 and 2003, Indiana faced serious revenue shortfalls. In 2001/02, cuts totaling $468.7 million were made in the budget mid-term, and in 2002/03, cuts totaling $671.5 million were made after the budget's adoption. In 2001/02, strategies used to deal with the budget gap included tax increases, fee increases, across-the-board cuts and drawings from the state's rainy day fund. (the Counter Cyclical Revenue Fund). In 2003, furloughs, early retirement of government employees, reduced local aid, and the administrative transfer of funds were added to across-the-board cuts and drawings from the rainy day fund. Indiana's budget deficit was about 3% of the state budget in 2002/03, and projected at 8.8% for 2003/04. Revenues for the general fund were projected at $10.481 billion for 2004, while expenditures were projected at $11.292 billion, the difference to be made up by drawings on the rainy day fund and administrative transfers. Of funds appropriated, the major part is for education (36%), health and human services (30%), and transportation (11%).
The following table from the US Census Bureau contains information on revenues, expenditures, indebtedness, and cash/securities for 2001.
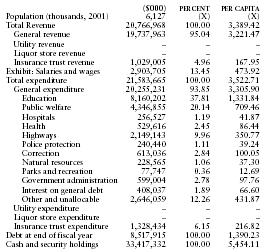
| ($000) | PERCENT | PER CAPITA | |
| Population (thousands, 2001) | 6,127 | (X) | (X) |
| Total Revenue | 20,766,968 | 100.00 | 3,389.42 |
| General revenue | 19,737,963 | 95.04 | 3,221.47 |
| Utility revenue | – | – | – |
| Liquor store revenue | – | – | – |
| Insurance trust revenue | 1,029,005 | 4.96 | 167.95 |
| Exhibit: Salaries and wages | 2,903,705 | 13.45 | 473.92 |
| Total expenditure | 21,583,665 | 100.00 | 3,522.71 |
| General expenditure | 20,255,231 | 93.85 | 3,305.90 |
| Education | 8,160,202 | 37.81 | 1,331.84 |
| Public welfare | 4,346,855 | 20.14 | 709.46 |
| Hospitals | 256,527 | 1.19 | 41.87 |
| Health | 529,616 | 2.45 | 86.44 |
| Highways | 2,149,143 | 9.96 | 350.77 |
| Police protection | 240,440 | 1.11 | 39.24 |
| Correction | 613,036 | 2.84 | 100.05 |
| Natural resources | 228,565 | 1.06 | 37.30 |
| Parks and recreation | 77,747 | 0.36 | 12.69 |
| Government administration | 599,004 | 2.78 | 97.76 |
| Interest on general debt | 408,037 | 1.89 | 66.60 |
| Other and unallocable | 2,646,059 | 12.26 | 431.87 |
| Utility expenditure | – | – | – |
| Liquor store expenditure | – | – | – |
| Insurance trust expenditure | 1,328,434 | 6.15 | 216.82 |
| Debt at end of fiscal year | 8,517,915 | 100.00 | 1,390.23 |
| Cash and security holdings | 33,417,332 | 100.00 | 5,454.11 |