Iowa
Public finance
The public budget is prepared by the Department of Management with the governor's approval and is adopted or revised by the general assembly. Each budget is prepared for the biennium of the upcoming fiscal year and the one following; the fiscal year runs from 1 July to 30 June.
The governor's 2001 budget recommendations outlined recommendations to bring expenditures into line with revenues by 2002, including a $10 million appropriations reduction, and measures to divert capital into more long-term, preventative projects including education, preventative health care, and environmental management. General fund receipts were forecast at almost $5.3 billion for 2001, but in that year of recession, revenues were only $4.648 billion, a 12.3% shortfall. The government filled the gap with drawings from the state's Economic Emergency Fund. In 2001/02, general fund revenues fell further, to $4.463 billion ($4.9 billion had been projected in the budget), which the government met by transfers from the Economic Emergency Fund and the Cash Reserve Fund, one-time transfers from some other funds, and a mid-term lowering of the revenue estimated to $4.3 billion. A total of $246.2 million was cut from the 2001/02 budget after it was passed, exempting only Medicare and public safety. In 2002/03, revenues reached $4.5 billion, allowing the state to end with a $1 million balance and $229 million in the state's rainy day fund. Projected general fund receipts for 2003/04 were $4.526 billion, still well below what had been expected in 2000 going into 2001, but with reduced expenditures (projected at $4.599 billion for 2004) and various fund transfers and tax adjustments, the state appeared to have avoided a major budget crisis.
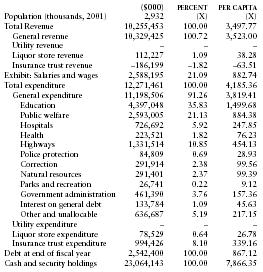
The following table from the US Census Bureau contains information on revenues, expenditures, indebtedness, and cash/securities for 2001.
| ($000) | PERCENT | PER CAPITA | |
| Population (thousands, 2001) | 2,932 | (X) | (X) |
| Total Revenue | 10,255,453 | 100.00 | 3,497.77 |
| General revenue | 10,329,425 | 100.72 | 3,523.00 |
| Utility revenue | – | – | – |
| Liquor store revenue | 112,227 | 1.09 | 38.28 |
| Insurance trust revenue | –186,199 | –1.82 | –63.51 |
| Exhibit: Salaries and wages | 2,588,195 | 21.09 | 882.74 |
| Total expenditure | 12,271,461 | 100.00 | 4,185.36 |
| General expenditure | 11,198,506 | 91.26 | 3,819.41 |
| Education | 4,397,048 | 35.83 | 1,499.68 |
| Public welfare | 2,593,005 | 21.13 | 884.38 |
| Hospitals | 726,692 | 5.92 | 247.85 |
| Health | 223,521 | 1.82 | 76.23 |
| Highways | 1,331,514 | 10.85 | 454.13 |
| Police protection | 84,809 | 0.69 | 28.93 |
| Correction | 291,914 | 2.38 | 99.56 |
| Natural resources | 291,401 | 2.37 | 99.39 |
| Parks and recreation | 26,741 | 0.22 | 9.12 |
| Government administration | 461,390 | 3.76 | 157.36 |
| Interest on general debt | 133,784 | 1.09 | 45.63 |
| Other and unallocable | 636,687 | 5.19 | 217.15 |
| Utility expenditure | – | – | – |
| Liquor store expenditure | 78,529 | 0.64 | 26.78 |
| Insurance trust expenditure | 994,426 | 8.10 | 339.16 |
| Debt at end of fiscal year | 2,542,400 | 100.00 | 867.12 |
| Cash and security holdings | 23,064,143 | 100.00 | 7,866.35 |