Kentucky
Public finance
The Kentucky biennial state budget is prepared by the Governor's Office for Policy and Management late in each odd-numbered year and submitted by the governor to the general assembly for approval. The fiscal year runs from July 1 to June 30.
Revenues for Kentucky's general fund were projected at $7 billion for 2002, but the actual figure was only $6.560 billion. Most state services (with the exception of roads) are paid for from the general fund. Cuts in general fund expenditures totaling $231.5 million were made in 2002 after the budget had been enacted, exempting only elementary and secondary education. In 2002/03, the budget deficit totaled about $220 million, and the projected deficit for 2003/04 was $360 million, about 5.1% of the state general fund budget. The legislature could not agree on either expenditure cuts or tax increases, and left it to the governor to make the adjustments. General fund revenue was increased by allocations from the Tobacco Settlement funds ($133 million in 2001/02, $127 million in 2002/03 $110 million in 2003/04). Other adjustments were made by transfers to the general fund from other funds.
In 2002, 80% of general fund expenditures went to three areas: education, Medicaid, and the criminal justice system. The rest of the government accounted for the other 20%, including social services (8.37%), general government (3.28%), finance and administration (3.11%), revenue (1.26%), natural resources and environmental protection (0.95%), workforce development (0.75%) and public protection (0.73%). Revenues for 2003/04 were projected at $7.2 billion, with adjustments mainly from fund transfers bringing total resources to $7.6 billion to cover projected expenditures of $7.42 billion.
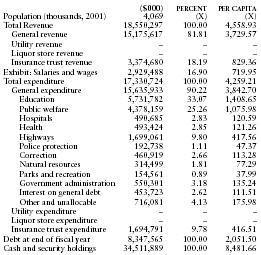
The following table from the US Census Bureau contains information on revenues, expenditures, indebtedness, and cash/securities for 2001.
| ($000) | PERCENT | PER CAPITA | |
| Population (thousands, 2001) | 4,069 | (X) | (X) |
| Total Revenue | 18,550,297 | 100.00 | 4,558.93 |
| General revenue | 15,175,617 | 81.81 | 3,729.57 |
| Utility revenue | – | – | – |
| Liquor store revenue | – | – | – |
| Insurance trust revenue | 3,374,680 | 18.19 | 829.36 |
| Exhibit: Salaries and wages | 2,929,488 | 16.90 | 719.95 |
| Total expenditure | 17,330,724 | 100.00 | 4,259.21 |
| General expenditure | 15,635,933 | 90.22 | 3,842.70 |
| Education | 5,731,782 | 33.07 | 1,408.65 |
| Public welfare | 4,378,159 | 25.26 | 1,075.98 |
| Hospitals | 490,685 | 2.83 | 120.59 |
| Health | 493,424 | 2.85 | 121.26 |
| Highways | 1,699,061 | 9.80 | 417.56 |
| Police protection | 192,738 | 1.11 | 47.37 |
| Correction | 460,919 | 2.66 | 113.28 |
| Natural resources | 314,499 | 1.81 | 77.29 |
| Parks and recreation | 154,561 | 0.89 | 37.99 |
| Government administration | 550,301 | 3.18 | 135.24 |
| Interest on general debt | 453,723 | 2.62 | 111.51 |
| Other and unallocable | 716,081 | 4.13 | 175.98 |
| Utility expenditure | – | – | – |
| Liquor store expenditure | – | – | – |
| Insurance trust expenditure | 1,694,791 | 9.78 | 416.51 |
| Debt at end of fiscal year | 8,347,565 | 100.00 | 2,051.50 |
| Cash and security holdings | 34,511,889 | 100.00 | 8,481.66 |