Minnesota
Public finance
Minnesota spends a relatively large amount on state government and local assistance, especially on a per capita basis. The state budget is prepared by the Department of Finance and submitted biennially by the governor to the legislature for amendment and approval. The fiscal year runs from 1 July to 30 June.
The fiscal year 2000–01 biennium budget for Minnesota included general fund revenues of $24.6 and spending of $23.4 billion. The tobacco lawsuit brought in revenues of almost one billion, which was set aside for tobacco use prevention, public health, and medical education. Personal income tax rates were cut from 6% to 5.5%, 8% to 7.25%, and 8.5% to 8%; as well as property taxes, sales taxes, and health care provider taxes. Investments were scheduled in the areas of education, health and human services, agriculture, criminal justice, economic development, government operations, and transportation.
The governor's 2000–01 budget reduced taxes by almost $1.4 billion, with the biggest cuts coming from income tax reductions. Tax revenues for 2000/01 were forecast at $12.6 billion, but the actual collection was only $12.15 billion, well short of expenditures of $12.703 billion. However, the gap was covered by previous surpluses: 2000/01 began with a starting balance of $2.125 billion and ended with a balance of $1.594 billion, all in the state's revenue stabilization fund. In 2001/02, however, revenues only reached $12.31 billion, while expenditures increased to $12.75 billion, and in 2002/03, the gap was more than $900 million: $13.046 billion in general fund revenues vs. $13.997 billion in general fund expenditures. Minnesota's budget deficit for 2002/03, was estimated at 10.7% of the state budget, and for 2003/04, was projected to increase to 18.7% of the state budget. Minnesota had gone from a starting balance equal to 12.4% of expenditures in 2000/01 to a starting balance in 2002/ 03 equal to only 1.3% of expenditures.
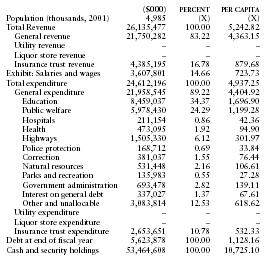
The following table from the US Census Bureau contains information on revenues, expenditures, indebtedness, and cash/securities for 2001.
| ($000) | PERCENT | PER CAPITA | |
| Population (thousands, 2001) | 4,985 | (X) | (X) |
| Total Revenue | 26,135,477 | 100.00 | 5,242.82 |
| General revenue | 21,750,282 | 83.22 | 4,363.15 |
| Utility revenue | – | – | – |
| Liquor store revenue | – | – | – |
| Insurance trust revenue | 4,385,195 | 16.78 | 879.68 |
| Exhibit: Salaries and wages | 3,607,801 | 14.66 | 723.73 |
| Total expenditure | 24,612,196 | 100.00 | 4,937.25 |
| General expenditure | 21,958,545 | 89.22 | 4,404.92 |
| Education | 8,459,037 | 34.37 | 1,696.90 |
| Public welfare | 5,978,430 | 24.29 | 1,199.28 |
| Hospitals | 211,154 | 0.86 | 42.36 |
| Health | 473,095 | 1.92 | 94.90 |
| Highways | 1,505,330 | 6.12 | 301.97 |
| Police protection | 168,712 | 0.69 | 33.84 |
| Correction | 381,037 | 1.55 | 76.44 |
| Natural resources | 531,448 | 2.16 | 106.61 |
| Parks and recreation | 135,983 | 0.55 | 27.28 |
| Government administration | 693,478 | 2.82 | 139.11 |
| Interest on general debt | 337,027 | 1.37 | 67.61 |
| Other and unallocable | 3,083,814 | 12.53 | 618.62 |
| Utility expenditure | – | – | – |
| Liquor store expenditure | – | – | – |
| Insurance trust expenditure | 2,653,651 | 10.78 | 532.33 |
| Debt at end of fiscal year | 5,623,878 | 100.00 | 1,128.16 |
| Cash and security holdings | 53,464,608 | 100.00 | 10,725.10 |