North Dakota
Political parties
Between 1889 and 1960, Republicans held the governorship for 58 years. North Dakota politics were not monolithic, however, for aside from the Populist and Democratic opposition, the Republican Party was itself torn by factionalism, with Progressive and Nonpartisan League challenges to the conservative, probusiness party establishment. Between 1960 and 1980, the statehouse was in Democratic hands. In the early and midnineties, the Republican party increased its influence at the state level, gaining dominance in both houses of the state legislature, having wrestled control of the senate away from the Democrats in the November 1994 election. The state had 481,351 registered voters in 2002, 49% of whom turned out to vote. Following the 2002 election, the state senate had 31 Republicans and 16 Democrats. The state house was dominated by the Republicans, who held 66 seats, while the Democrats had 28.
In the 2000 presidential election, Republican George W. Bush won 61% of the vote to Democrat Al Gore's 33%. Independent candidate Ralph Nader and Reform Party candidate Pat Buchanan each received 3% of the vote. North Dakota had three electoral votes in the 2000 presidential election.
Republican John Hoeven was elected governor in 2000. North Dakota's US senators in 2003 were Kent Conrad, a Democrat elected in 1992 to fill a seat vacated by the death of Quentin D. Burdick and reelected to full terms in 1994 and 2000, and Democrat Byron Dorgan, who was also reelected for a second term in 1998. Following the 2002 elections, North Dakota's sole representative to the US House was a Democrat.
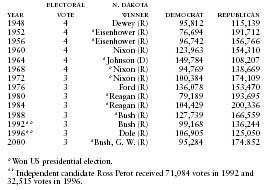
North Dakota Presidential Vote by Major Political Parties, 1948–2000
| YEAR | ELECTORAL VOTE | N. DAKOTA WINNER | DEMOCRAT | REPUBLICAN |
| *Won US presidential election. | ||||
| ** Independent candidate Ross Perot received 71,084 votes in 1992 and 32,515 votes in 1996. | ||||
| 1948 | 4 | Dewey (R) | 95,812 | 115,139 |
| 1952 | 4 | *Eisenhower (R) | 76,694 | 191,712 |
| 1956 | 4 | *Eisenhower (R) | 96,742 | 156,766 |
| 1960 | 4 | Nixon (R) | 123,963 | 154,310 |
| 1964 | 4 | *Johnson (D) | 149,784 | 108,207 |
| 1968 | 4 | *Nixon (R) | 94,769 | 138,669 |
| 1972 | 3 | *Nixon (R) | 100,384 | 174,109 |
| 1976 | 3 | Ford (R) | 136,078 | 153,470 |
| 1980 | 3 | *Reagan (R) | 79,189 | 193,695 |
| 1984 | 3 | *Reagan (R) | 104,429 | 200,336 |
| 1988 | 3 | *Bush (R) | 127,739 | 166,559 |
| 1992** | 3 | Bush (R) | 99,168 | 136,244 |
| 1996** | 3 | Dole (R) | 106,905 | 125,050 |
| 2000 | 3 | *Bush, G. W. (R) | 95,284 | 174.852 |