Pennsylvania
Ethnic groups
During the colonial period, under the religious tolerance of a Quaker government, Pennsylvania was a haven for dissident sectarians from continental Europe and the British Isles. Some German sectarians, including the Amish, have kept up their traditions to this day. An initially friendly policy toward the Indians waned in the late 18th century under the pressures of population growth and the anxieties of the French and Indian War. The famous Carlisle Indian School (1879–1918) educated many leaders from various tribes throughout the US. In
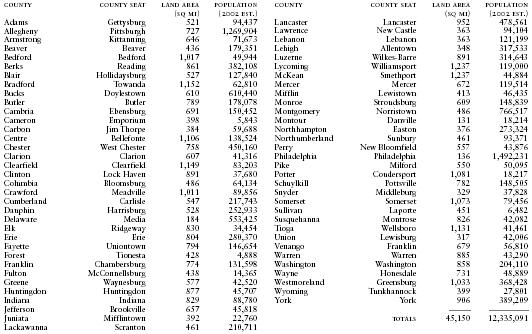
Pennsylvania Counties, County Seats, and County Areas and Populations
| COUNTY | COUNTY SEAT | LAND AREA (SQ MI) | POPULATION (2002 EST.) | COUNTY | COUNTY SEAT | LAND AREA (SQ MI) | POPULATION (2002 EST.) |
| Adams | Gettysburg | 521 | 94,437 | Lancaster | Lancaster | 952 | 478,561 |
| Allegheny | Pittsburgh | 727 | 1,269,904 | Lawrence | New Castle | 363 | 94,104 |
| Armstrong | Kittanning | 646 | 71,673 | Lebanon | Lebanon | 363 | 121,199 |
| Beaver | Beaver | 436 | 179,351 | Lehigh | Allentown | 348 | 317,533 |
| Bedford | Bedford | 1,017 | 49,944 | Luzerne | Wilkes-Barre | 891 | 314,643 |
| Berks | Reading | 861 | 382,108 | Lycoming | Williamsport | 1,237 | 119,000 |
| Blair | Hollidaysburg | 527 | 127,840 | McKean | Smethport | 1,237 | 44,884 |
| Bradford | Towanda | 1,152 | 62,810 | Mercer | Mercer | 672 | 119,514 |
| Bucks | Doylestown | 610 | 610,440 | Mifflin | Lewistown | 413 | 46,435 |
| Butler | Butler | 789 | 178,078 | Monroe | Stroudsburg | 609 | 148,839 |
| Cambria | Ebensburg | 691 | 150,452 | Montgomery | Norristown | 486 | 766,517 |
| Cameron | Emporium | 398 | 5,843 | Montour | Danville | 131 | 18,214 |
| Carbon | Jim Thorpe | 384 | 59,688 | Northhampton | Easton | 376 | 273,324 |
| Centre | Bellefonte | 1,106 | 138,524 | Northumberland | Sunbury | 461 | 93,371 |
| Chester | West Chester | 758 | 450,160 | Perry | New Bloomfield | 557 | 43,876 |
| Clarion | Clarion | 607 | 41,316 | Philadelphia | Philadelphia | 136 | 1,492,231 |
| Clearfield | Clearfield | 1,149 | 83,203 | Pike | Milford | 550 | 50,095 |
| Clinton | Lock Haven | 891 | 37,680 | Potter | Coudersport | 1,081 | 18,217 |
| Columbia | Bloomsburg | 486 | 64,134 | Schuylkill | Pottsville | 782 | 148,505 |
| Crawford | Meadville | 1,011 | 89,856 | Snyder | Middleburg | 329 | 37,828 |
| Cumberland | Carlisle | 547 | 217,743 | Somerset | Somerset | 1,073 | 79,456 |
| Dauphin | Harrisburg | 528 | 252,933 | Sullivan | Laporte | 451 | 6,482 |
| Delaware | Media | 184 | 553,425 | Susquehanna | Montrose | 826 | 42,082 |
| Elk | Ridgeway | 830 | 34,454 | Tioga | Wellsboro | 1,131 | 41,461 |
| Erie | Erie | 804 | 280,370 | Union | Lewisburg | 317 | 42,006 |
| Fayette | Uniontown | 794 | 146,654 | Venango | Franklin | 679 | 56,810 |
| Forest | Tionesta | 428 | 4,888 | Warren | Warren | 885 | 43,290 |
| Franklin | Chambersburg | 774 | 131,598 | Washington | Washington | 858 | 204,110 |
| Fulton | McConnellsburg | 438 | 14,365 | Wayne | Honesdale | 731 | 48,889 |
| Greene | Waynesburg | 577 | 42,520 | Westmoreland | Greensburg | 1,033 | 368,428 |
| Huntingdon | Huntingdon | 877 | 45,707 | Wyoming | Tunkhannock | 399 | 27,801 |
| Indiana | Indiana | 829 | 88,780 | York | York | 906 | 389,209 |
| Jefferson | Brookville | 657 | 45,818 | ——— | —————– | ||
| Juniata | Mifflintown | 392 | 22,760 | TOTALS | 45,150 | 12,335,091 | |
| Lackawanna | Scranton | 461 | 210,711 |
Pennsylvania itself, however, there were only 18,348 American Indians in 2000, up from 15,000 in 1990.
Modest numbers of black slaves were utilized as domestics, field workers, and iron miners in colonial Pennsylvania. Antislavery sentiment was stirred in the 18th century through the efforts of a Quaker, John Woolman, and other Pennsylvanians. The Gradual Abolition of Slavery Act was passed in 1780, and the important antislavery newspaper The Liberator appeared in Philadelphia in 1831. As of 2000, black Americans numbered 1,224,612 (10% of the total state population), and were concentrated in the large cities. Philadelphia was 43.2% black in 2000, with 655,824 African American residents.
The late 19th and early 20th centuries brought waves of immigrants from Ireland, Wales, various Slavic nations, and the eastern Mediterranean and the Balkans. Many of the new immigrants settled in the east-central anthracite coal-mining region. In 2000, 508,291 Pennsylvania residents, or 4.1% of the total population, were foreign born, up from 3.1% in 1990. Italy, Germany, the United Kingdom, India, the former Soviet Union, Korea, and Poland were the leading countries of origin. In the valleys surrounding Pittsburgh there are still self-contained ethnic enclaves, and there has been increased interest in preserving distinctive ethnic traditions.
Hispanics and Latinos in Pennsylvania numbered 394,088 in 2000 (3.2%), up from 232,000 in 1990. Most were Puerto Ricans, with smaller numbers of Cubans and Central Americans. In 2000, Asians numbered 219,813; the Asian population included 50,650 Chinese (almost double the 1990 total of 25,908), 31,612 Koreans, 57,241 Asian Indians (almost triple the 1990 figure of 19,769), 14,506 Filipinos, and 30,037 Vietnamese, up sharply from 14,126 in 1990. Pacific Islanders numbered 3,417.