Pennsylvania
Public finance
Pennsylvania's budget is prepared annually by the Office of Budget and submitted by the governor to the general assembly for amendment and approval. By law, annual operating expenditures may not exceed available revenues and surpluses from prior years. The fiscal year runs from 1 July to 30 June.
For 2003/04, allocations from Pennsylvania's general fund were for education (42.8%), health and human services (35.7%), protection (11.8%), regulation and direction (4.1%), other programs, including general government (2.9%) and economic development (2.7%). In 2002/03, Pennsylvania's budget deficit was estimated at 2.4% of the state budget, and for 2003/04, the deficit was projected at 2.4% to 9.6% of the state budget.
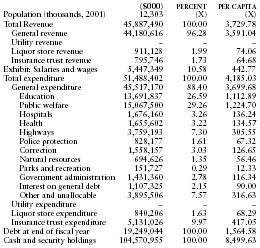
The following table from the US Census Bureau contains information on revenues, expenditures, indebtedness, and cash/securities for 2001.
| ($000) | PERCENT | PER CAPITA | |
| Population (thousands, 2001) | 12,303 | (X) | (X) |
| Total Revenue | 45,887,490 | 100.00 | 3,729.78 |
| General revenue | 44,180,616 | 96.28 | 3,591.04 |
| Utility revenue | – | – | – |
| Liquor store revenue | 911,128 | 1.99 | 74.06 |
| Insurance trust revenue | 795,746 | 1.73 | 64.68 |
| Exhibit: Salaries and wages | 5,447,349 | 10.58 | 442.77 |
| Total expenditure | 51,488,402 | 100.00 | 4,185.03 |
| General expenditure | 45,517,170 | 88.40 | 3,699.68 |
| Education | 13,691,837 | 26.59 | 1,112.89 |
| Public welfare | 15,067,500 | 29.26 | 1,224.70 |
| Hospitals | 1,676,160 | 3.26 | 136.24 |
| Health | 1,655,602 | 3.22 | 134.57 |
| Highways | 3,759,193 | 7.30 | 305.55 |
| Police protection | 828,177 | 1.61 | 67.32 |
| Correction | 1,558,157 | 3.03 | 126.65 |
| Natural resources | 694,626 | 1.35 | 56.46 |
| Parks and recreation | 151,727 | 0.29 | 12.33 |
| Government administration | 1,431,360 | 2.78 | 116.34 |
| Interest on general debt | 1,107,325 | 2.15 | 90.00 |
| Other and unallocable | 3,895,506 | 7.57 | 316.63 |
| Utility expenditure | – | – | – |
| Liquor store expenditure | 840,206 | 1.63 | 68.29 |
| Insurance trust expenditure | 5,131,026 | 9.97 | 417.05 |
| Debt at end of fiscal year | 19,249,044 | 100.00 | 1,564.58 |
| Cash and security holdings | 104,570,955 | 100.00 | 8,499.63 |