Washington
Public finance
Washington's biennial budget is prepared by the Office of Financial Management and submitted by the governor to the legislature for amendment and approval. The fiscal year runs from 1 July through 30 June.
The 1999–2001 State budget plan had resources totaling $20.7 billion and proposed expenditures of $20.6 billion. The majority of general funds were put towards education, $435 million towards health services, and $200 million to salmon recovery, amongst other initiatives. Total resources for 2001–03 were expected to reach $23 billion, with an expenditure limit of $22 billion. In 2002/03, the Washington's budget deficit was reported to be about $1.12 billion or about 5% of the state budget. Projections in early 2003 for 2003/04 were for a budget deficit ranging from $1.3 billion to $2.87 billion (11.5% to 25.3% of the state budget). Total resources for the 2003-05 biennium were projected at $22.979 billion appropriated to K-12 education (44.1%), higher education (11.6%), social and health services (28.2%), corrections (4.9%), bond retirement (5.5%), government operations (1.7%), natural resources (1.3%) and other, including the legislature and judiciary (2.7%)
The following table from the US Census Bureau contains information on revenues, expenditures, indebtedness, and cash/securities for 2001.
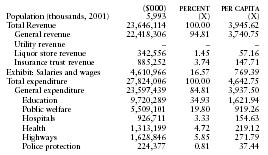
| ($000) | PERCENT | PER CAPITA | |
| Population (thousands, 2001) | 5,993 | (X) | (X) |
| Total Revenue | 23,646,114 | 100.00 | 3,945.62 |
| General revenue | 22,418,306 | 94.81 | 3,740.75 |
| Utility revenue | – | – | – |
| Liquor store revenue | 342,556 | 1.45 | 57.16 |
| Insurance trust revenue | 885,252 | 3.74 | 147.71 |
| Exhibit: Salaries and wages | 4,610,966 | 16.57 | 769.39 |
| Total expenditure | 27,824,006 | 100.00 | 4,642.75 |
| General expenditure | 23,597,439 | 84.81 | 3,937.50 |
| Education | 9,720,289 | 34.93 | 1,621.94 |
| Public welfare | 5,509,101 | 19.80 | 919.26 |
| Hospitals | 926,711 | 3.33 | 154.63 |
| Health | 1,313,199 | 4.72 | 219.12 |
| Highways | 1,628,846 | 5.85 | 271.79 |
| Police protection | 224,377 | 0.81 | 37.44 |
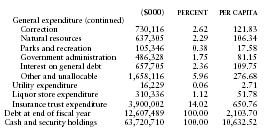
| ($000) | PERCENT | PER CAPITA | |
| General expenditure (continued) | |||
| Correction | 730,116 | 2.62 | 121.83 |
| Natural resources | 637,305 | 2.29 | 106.34 |
| Parks and recreation | 105,346 | 0.38 | 17.58 |
| Government administration | 486,328 | 1.75 | 81.15 |
| Interest on general debt | 657,705 | 2.36 | 109.75 |
| Other and unallocable | 1,658,116 | 5.96 | 276.68 |
| Utility expenditure | 16,229 | 0.06 | 2.71 |
| Liquor store expenditure | 310,336 | 1.12 | 51.78 |
| Insurance trust expenditure | 3,900,002 | 14.02 | 650.76 |
| Debt at end of fiscal year | 12,607,489 | 100.00 | 2,103.70 |
| Cash and security holdings | 63,720,710 | 100.00 | 10,632.52 |