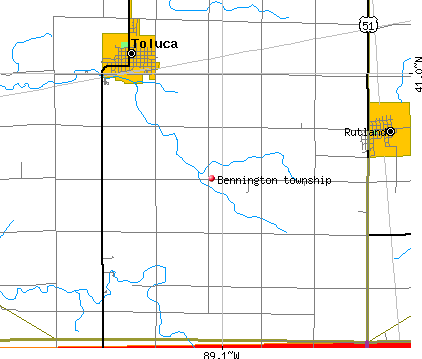
Bennington township, Marshall County, Illinois (IL) detailed profile
Number of foreign born residents: 2 (63% naturalized citizens)
| Bennington township: | 2.0% |
| Whole state: | 12.3% |
66% of Bennington township residents lived in the same house 5 years ago.
Out of people who lived in different houses, 56% lived in this county.
Out of people who lived in different counties, 88% lived in Illinois.
Place of birth for U.S.-born residents:
- This state: 1364
- Northeast: 12
- Midwest: 94
- South: 67
- West: 21
Median price asked for vacant for-sale houses in 2000: $56,700
Percentage of households with unmarried partners: 5.0%
Likely homosexual households (counted as self-reported same-sex unmarried-partner households)
- Lesbian couples: 0.9% of all households
- Gay men: 0.0% of all households
81 people in nursing homes
Housing units in structures:
- One, detached: 637
- One, attached: 14
- Two: 22
- 3 or 4: 40
- 5 to 9: 19
- 10 to 19: 2
- 20 to 49: 4
- Mobile homes: 10
Median worth of mobile homes: $17,500
Housing units in Bennington township with a mortgage: 254 (11 second mortgage, 10 home equity loan, 0 both second mortgage and home equity loan)
Houses without a mortgage: 243
- Agriculture, forestry, fishing and hunting (11%)
- Machinery (9%)
- Truck transportation (9%)
- Food (8%)
- Construction (7%)
- Accommodation and food services (7%)
- Metal and metal products (6%)
- Health care (23%)
- Food (13%)
- Educational services (11%)
- Accommodation and food services (10%)
- Apparel (9%)
- Finance and insurance (5%)
- Nonmetallic mineral products (4%)
- Other production occupations including supervisors (12%)
- Driver/sales workers and truck drivers (11%)
- Farmers and farm managers (10%)
- Building and grounds cleaning and maintenance occupations (4%)
- Metal workers and plastic workers (4%)
- Electrical equipment mechanics and other installation, maintenance, and repair occupations including supervisors (3%)
- Food processing workers (3%)
- Other production occupations including supervisors (9%)
- Registered nurses (8%)
- Secretaries and administrative assistants (7%)
- Textile, apparel, and furnishings workers (7%)
- Other sales and related workers including supervisors (5%)
- Health technologists and technicians (5%)
- Nursing, psychiatric, and home health aides (4%)
Most common first ancestries reported in Bennington township:
- German (42.5%)
- Italian (14.0%)
- United States or American (10.0%)
- Irish (9.2%)
- English (7.3%)
- Polish (4.5%)
- Swedish (2.4%)
Most common places of birth for the foreign-born residents:
- Mexico (25%)
- Germany (22%)
- Canada (22%)
- Poland (13%)
- United Kingdom (6%)
- Italy (6%)
- Japan (6%)
Means of transportation to work:
- Drove a car alone: 565 (78%)
- Carpooled: 61 (8%)
- Bicycle: 3 (0%)
- Walked: 48 (7%)
- Worked at home: 48 (7%)
Most commonly used house heating fuel:
- Utility gas (69%)
- Electricity (18%)
- Bottled, tank, or LP gas (11%)
- Fuel oil, kerosene, etc. (1%)
81 people in nursing homes
98.0% of residents of Bennington township speak English at home.
1.1% of residents speak Spanish at home (53% speak English very well, 29% speak English well, 6% speak English not well, 12% don't speak English at all).
0.9% of residents speak other Indo-European language at home (69% speak English very well, 15% speak English not well, 15% don't speak English at all).
Household type by relationship:
Households: 1,507- In family households: 1,194 (373 male householders, 56 female householders)
350 spouses, 388 children (372 natural, 2 adopted, 14 stepchildren), 11 grandchildren, 1 brothers or sisters, 0 parents, 3 other relatives, 12 non-relatives
- In nonfamily households: 313 (112 male householders (83 living alone)), 160 female householders (151 living alone)), 41 nonrelatives
- In group quarters: 83 (all institutionalized)
Size of family households: 234 2-persons, 90 3-persons, 59 4-persons, 35 5-persons, 9 6-persons, 2 7-or-more-persons,
Size of nonfamily households: 234 1-person, 36 2-persons, 2 5-persons,
264 married couples with children.
72 single-parent households (20 men, 52 women).
Private vs. public school enrollment:
Students in private schools in grades 1 to 8 (elementary and middle school): 0
| Here: | 0.0% |
| Illinois: | 13.4% |
Students in private schools in grades 9 to 12 (high school): 6
| Here: | 9.8% |
| Illinois: | 11.1% |
Students in private undergraduate colleges: 0
| Here: | 0.0% |
| Illinois: | 25.8% |