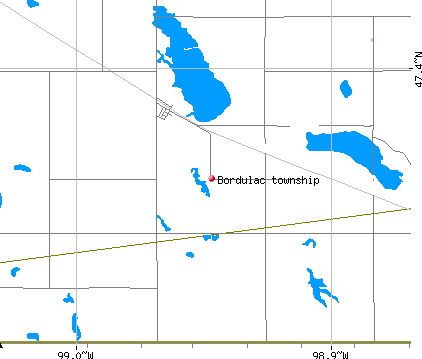
Bordulac township, Foster County, North Dakota (ND) detailed profile
Number of foreign born residents: 22 (24% naturalized citizens)
| Bordulac township: | 21.6% |
| Whole state: | 1.9% |
74% of Bordulac township residents lived in the same house 5 years ago.
Out of people who lived in different houses, 75% lived in this county.
Out of people who lived in different counties, 98% lived in North Dakota.
Place of birth for U.S.-born residents:
- This state: 1665
- Northeast: 5
- Midwest: 12
- South: 16
- West: 17
Median price asked for vacant for-sale houses in 2000: $56,300
Percentage of households with unmarried partners: 0.0%
No gay or lesbian households reported
Housing units in structures:
- One, detached: 588
- One, attached: 6
- Two: 18
- 3 or 4: 19
- 5 to 9: 15
- 10 to 19: 14
- 50 or more: 2
- Mobile homes: 61
Median worth of mobile homes: $29,600
Housing units in Bordulac township with a mortgage: 201 (12 second mortgage, 18 home equity loan, 0 both second mortgage and home equity loan)
Houses without a mortgage: 172
- Construction (15%)
- Transportation equipment (12%)
- Agriculture, forestry, fishing and hunting (9%)
- Machinery (8%)
- Plastics and rubber products (5%)
- Metal and metal products (5%)
- Educational services (5%)
- Health care (19%)
- Educational services (12%)
- Transportation equipment (9%)
- Plastics and rubber products (8%)
- Accommodation and food services (7%)
- Machinery (5%)
- Personal and laundry services (5%)
- Metal workers and plastic workers (10%)
- Farmers and farm managers (8%)
- Other production occupations including supervisors (7%)
- Driver/sales workers and truck drivers (5%)
- Other management occupations except farmers and farm managers (5%)
- Building and grounds cleaning and maintenance occupations (4%)
- Vehicle and mobile equipment mechanics, installers, and repairers (4%)
- Other production occupations including supervisors (7%)
- Other office and administrative support workers including supervisors (7%)
- Health technologists and technicians (6%)
- Secretaries and administrative assistants (5%)
- Personal appearance workers (5%)
- Assemblers and fabricators (4%)
- Retail sales workers except cashiers (4%)
Most common first ancestries reported in Bordulac township:
- Polish (39.2%)
- German (31.1%)
- United States or American (5.2%)
- Irish (4.8%)
- English (4.6%)
- French (except Basque) (3.5%)
- Scottish (2.5%)
Most common places of birth for the foreign-born residents:
- Other Northern Europe (29%)
- Germany (29%)
- Canada (19%)
- Philippines (10%)
- Other Australian and New Zealand Subregion (10%)
Means of transportation to work:
- Drove a car alone: 659 (83%)
- Carpooled: 68 (9%)
- Bus or trolley bus: 1 (0%)
- Walked: 23 (3%)
- Other means: 5 (1%)
- Worked at home: 36 (5%)
Most commonly used house heating fuel:
- Utility gas (56%)
- Bottled, tank, or LP gas (19%)
- Fuel oil, kerosene, etc. (14%)
- Electricity (6%)
- Wood (5%)
- Other fuel (1%)
96.0% of residents of Bordulac township speak English at home.
0.1% of residents speak Spanish at home (100% speak English very well).
3.7% of residents speak other Indo-European language at home (87% speak English very well, 13% speak English well).
0.1% of residents speak Asian or Pacific Island language at home (100% speak English very well).
0.1% of residents speak other language at home (100% speak English very well).
Household type by relationship:
Households: 1,727- In family households: 1,483 (408 male householders, 66 female householders)
420 spouses, 557 children (517 natural, 20 adopted, 20 stepchildren), 17 grandchildren, 1 brothers or sisters, 0 parents, 2 other relatives, 12 non-relatives
- In nonfamily households: 244 (99 male householders (80 living alone)), 110 female householders (104 living alone)), 35 nonrelatives
- In group quarters: 14 (0 institutionalized population)
Size of family households: 210 2-persons, 83 3-persons, 119 4-persons, 47 5-persons, 12 6-persons, 3 7-or-more-persons,
Size of nonfamily households: 184 1-person, 20 2-persons, 3 3-persons, 2 6-persons,
29 married couples with children.
1 single-parent households (0 men, 1 women).
Private vs. public school enrollment:
Students in private schools in grades 1 to 8 (elementary and middle school): 4
| Here: | 1.8% |
| North Dakota: | 7.1% |
Students in private schools in grades 9 to 12 (high school): 0
| Here: | 0.0% |
| North Dakota: | 6.0% |
Students in private undergraduate colleges: 8
| Here: | 12.1% |
| North Dakota: | 10.5% |